EUR USD longas trend suggest and as today is Friday everything should settle this trade can be viable but the question that the target will hit would not be answered today
Please note: This is for educational purposes only and not a trading signal. These ideas are shared purely for back testing and to exchange views. The goal is to inspire ideas and encourage discussion. If you notice anything wrong, feel free to share your thoughts. In the end, to learn is to share !
EURUSD trade ideas

EURUSD BUYTapped into an orderblock on the 4hr time frame, so i scaled down to the 30mins to look for a buy entry
Entry : 1.17172
TP : 1.17891
SL : 1.17001

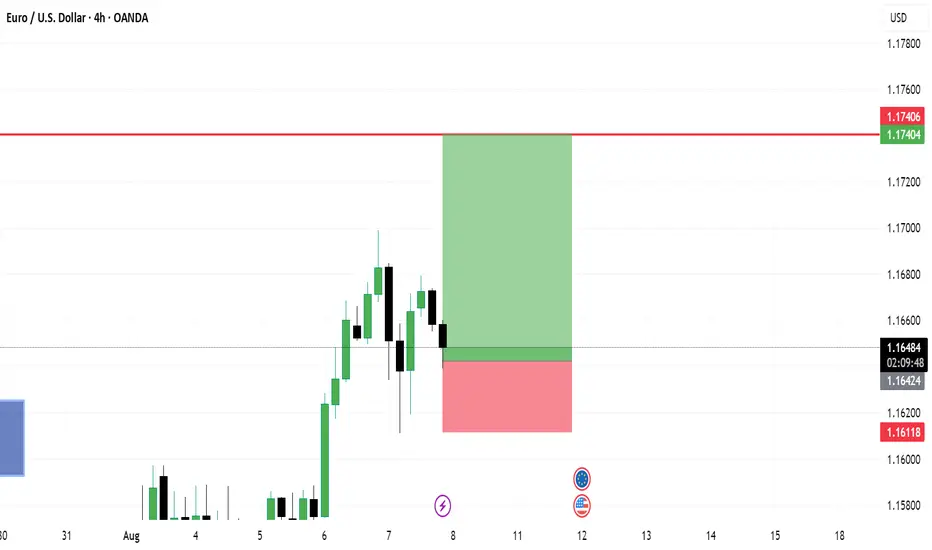
EURUSD Intraweek tradeI know, it's Thursday, but i still think that this can be a good intraweek trade. I expect the price to perform a correction here, till the support area at 1.17. If my analysis is correct i expect the price to be there later today or tomorrow morning
I'm optymist. 1.183-1.185 In front us3 year channel saying that we should to touch it.
Yellow line.
Before us
In my opinion before us is level. 1.18-1.20 before bigger correction until 1.12 even.
Then in few month i see 1.4-1.6

EURUSD: Will Go Up! Long!
My dear friends,
Today we will analyse EURUSD together☺️
The price is near a wide key level
and the pair is approaching a significant decision level of 1.17201 Therefore, a strong bullish reaction here could determine the next move up.We will watch for a confirmation candle, and then target the next key level of 1.17348.Recommend Stop-loss is beyond the current level.
❤️Sending you lots of Love and Hugs❤️

EURUSD: Long Signal with Entry/SL/TP
EURUSD
- Classic bullish pattern
- Our team expects retracement
SUGGESTED TRADE:
Swing Trade
Buy EURUSD
Entry - 1.1724
Stop - 1.1714
Take - 1.1743
Our Risk - 1%
Start protection of your profits from lower levels
Disclosure: I am part of Trade Nation's Influencer program and receive a monthly fee for using their TradingView charts in my analysis.
❤️ Please, support our work with like & comment! ❤️

EURUSD | Time For A Pullback?The week kicked off with strong impulsive moves to the upside, leaving no room for deeper correction. Then slowly from Wednesday, we started to see a decline in strength in the bullish run.
Now, with price edging toward the next swing low for a possible bearish change of character, is this a good way to ride the stream to the downside?
Keep your A-game on as we watch price unfold, and trade reactively to price movement.
Do not forget to guard your capitals with risk management.
Good luck traders. 👍
Follow me for more and more of these analyses.
See you on the next one. 🫡

EURUSD OUTLOOK On EURUSD, the previous day closed bearish. I then identified the most recent and significant supply and demand zones. After that, I proceeded to map out a possible entry and exit based on price reaction within those key areas.

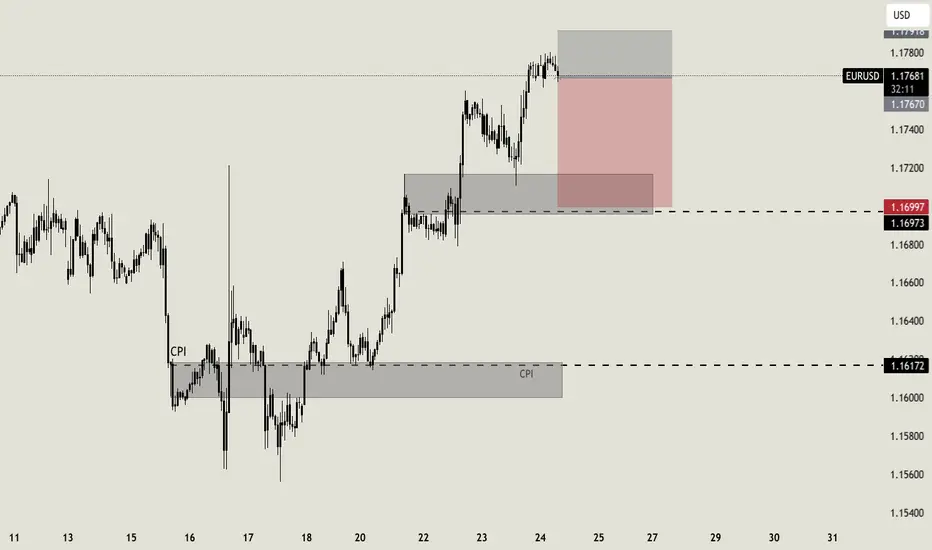
EURUSD –Bearish Pressure Below 1.1780 |Channel Structure HoldingEURUSD | UPDATE
The price is currently respecting the descending channel, failing to close above the pivot zone (1.1780 – 1.1750) and rejecting from the upper boundary of the structure.
Bias: Bearish While Below 1.1780
As long as price remains under the pivot zone and inside the descending channel, the bearish pressure is likely to persist. A potential correction may retest 1.1750 – 1.1730 levels before continuation.
Next Targets:
1.1700 – Minor support
1.1684 – Short-term level
1.1627 – Mid-target
1.1557 – Main support zone and channel bottom
Invalidation:
Clear breakout and H4 close above 1.1780 would invalidate the short bias and open a path toward 1.1820 and possibly 1.1882.
Structure: Bearish inside descending channel

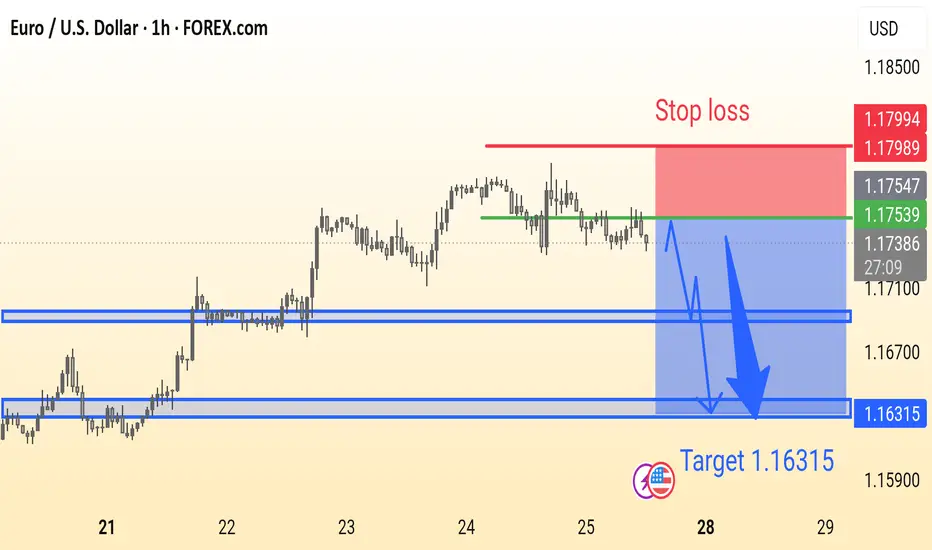
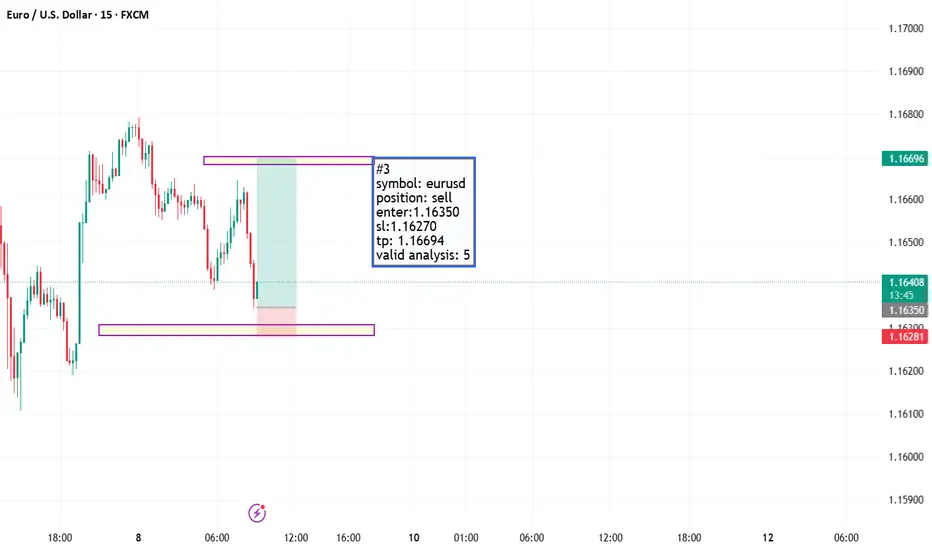
EURUSD Analysis is ReadyEUR/USD Trade Idea (1H Chart):
Price is ranging below resistance with a potential bearish breakout. Suggested Sell near 1.1753 with Stop Loss at 1.1799 and Target at 1.16315. Strong support zones marked for possible reaction.
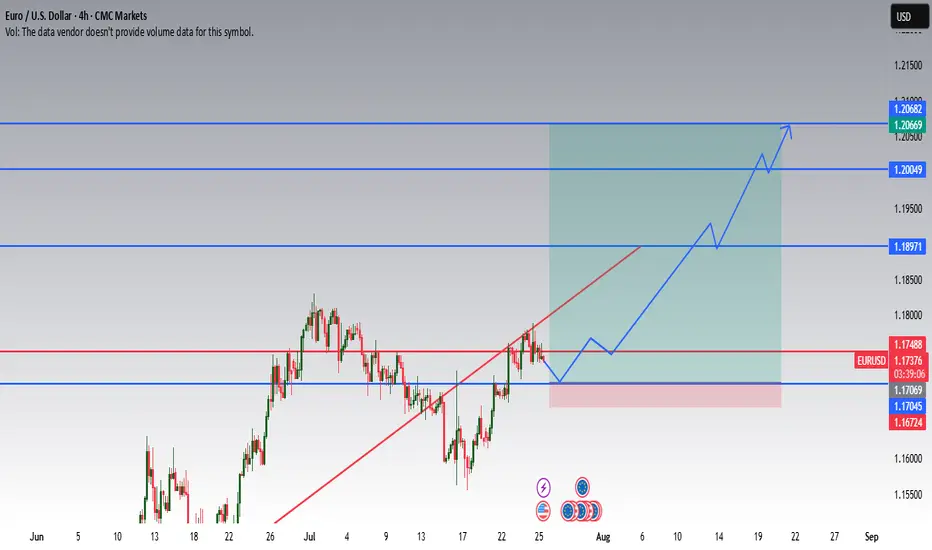
EURUSD Long Setup: Technically and Fundamentally Supported Push 📈 I'm expecting a climb of this pair due to weakening USD.
This idea is based on both technical and fundamental parameters:
🔍 Fundamentals
ECB kept rates unchanged, signaling stability and reluctance to tighten policy further.
FED is expected to cut rates in 5 days, as inflation eases and growth concerns rise in the US.
A weaker dollar is likely to support EURUSD strength.
1.20 is a psychological and political level – above that, European exporters begin to suffer, and ECB might intervene verbally or with policy action.
🧠 Technical Setup
Price has reclaimed a key support zone around 1.17069 – 1.17488, with consolidation signaling accumulation.
Break of the descending trendline shows bullish intent.
Next major resistance lies at 1.18971, followed by 1.20049 – a strong historical level and likely ECB reaction zone.
Final target at 1.20669 – 1.20682 marked by previous highs.
Entry Zone: 1.17045–1.17488 (current area of interest)
Stop Loss: Below 1.16724
Targets: 1.18971 / 1.20049 / 1.20669
💬 Feel free to monitor price action at key zones. Entry should be based on reaction at support or a confirmed breakout. This is not a blind entry setup.
📅 If the FED cuts rates as expected, USD weakness could accelerate the move.


EURUSD confidence 84% BullOur analysis found that the current market for the future trend of the currency to reach a more consistent bearish expectations, mainly benefited from the improvement of macroeconomic indicators and liquidity environment easing.
Combined with news and professional analysis reports, identified "policy support", "economic recovery" and other key words accounted for a significant increase in the proportion of market participants in a positive mood, promoting the formation of a long atmosphere.
The capital flow model shows that cross-border capital inflows have increased, and institutional investors are gradually increasing their holdings of the currency, indicating that there is sufficient support on the capital side to enhance the sustained upward momentum of the price.
We recommended that investors combine the signal to reasonably plan the position layout, especially in the market adjustment to grasp the timing of entry and achieve cost optimization.
Position Management Recommendations:
Layout in batches, control the overall position ratio, avoid over-concentration, and pay attention to risk points in time to ensure capital safety.

EURUSD → The correction is over. Bullish trend...FX:EURUSD is consolidating above key support from D1. The trend is bullish, and against the backdrop of a weaker dollar, the currency pair is returning to its main movement.
The currency pair is forming a local uptrend, with a fairly clear upward support line that intersects with an important support level. The price has emerged from correction and returned to the trend amid a decline in the dollar, which is mainly bearish. Given the situation with EUR/USD, I would focus on the support zone of 1.1631 - 1.1613, 1.1597. A fairly large pool of liquidity has formed in this zone. A false breakdown and the price holding in the buy zone could trigger a bullish run...
Resistance levels: 1.1676, 1.171, 1.175
Support levels: 1.163, 1.161, 1.160
If the bulls keep the price in the buying zone, i.e. above the key support zone mentioned above, then in the medium term, the currency pair may continue to rise with the possibility of updating local highs...
Best regards, R. Linda!

EUR/USD at Major Resistance Confluence – Rejection Ahead?EUR/USD – Key Decision Zone
The price is testing a major confluence between horizontal resistance (1.16–1.20) and a long-term descending trendline. The weekly RSI shows overbought conditions, similar to 2017, 2018, and 2021 — all followed by corrections. Likely scenario: a possible false breakout above resistance followed by rejection and consolidation. Price action in this zone will be crucial.
Technical Analysis Process: EUR/USD (Weekly Chart)
1. Descending Red Line (Trendline)
This line represents a long-term dynamic resistance.
It has been respected multiple times in the past, which increases its relevance.
The current price action is approaching this trendline again, suggesting a potential bearish reaction from sellers.
2. Static Resistance Zone (Upper Brown Rectangle)
Ranges approximately between 1.16 – 1.20.
Historically acted as both support and resistance, marking it as a strong horizontal level of confluence.
Now overlaps with the descending trendline, increasing its technical significance.
3. Major Support Zone (Lower Brown Rectangle)
Located around 1.03 – 1.05.
This is the area from which the price previously launched a strong upward movement, potentially marking a cyclical bottom.
Projected Scenario (Yellow Arrow)
Indicates a possible false breakout above the resistance area and trendline.
Suggests a structure of consolidation or distribution, where price may spike above key resistance but quickly retreat.
This could lead to a retracement back toward lower support, or act as a base before a real breakout develops.
RSI Indicator (Relative Strength Index)
Weekly RSI is currently in the overbought zone, near the 70 level.
The vertical dotted orange line aligns with previous RSI peaks (2017, 2018, 2021), each followed by major tops and corrections.
This pattern suggests that the market could again experience a local top and a retracement after this overbought signal.
Overall Interpretation
EUR/USD is currently at a critical technical zone, where:
A long-term trendline and a horizontal resistance intersect.
RSI signals a potential reversal point.
The most probable outcome (as indicated by the yellow arrow):
A short-lived breakout above resistance, followed by a bearish rejection and consolidation.
Alternatively, price could consolidate here before attempting a stronger breakout.

EURUSD stops at the SMA200, ready to pullback.EURUSD stops at the SMA200, ready to pullback.
The pair has been forming the bearish wedge since the April 2025 till July 2025. At the end of July the lower border of the pattern got broken and the price has rapidly reached the 1.14000 support level. Then the rebound from this level occurred and currently the price is retesting the lower border of the wedge from below. Additionally, the SMA200 is situated just above the current price, which is a fair argument for the price to pullback in the nearest future. The price is expected to decline with a first target of 1.14000.


EURUSD – DAILY FORECAST Q3 | W32 | D8 | Y25📊 EURUSD – DAILY FORECAST
Q3 | W32 | D8 | Y25
Daily Forecast 🔍📅
Here’s a short diagnosis of the current chart setup 🧠📈
Higher time frame order blocks have been identified — these are our patient points of interest 🎯🧭.
It’s crucial to wait for a confirmed break of structure 🧱✅ before forming a directional bias.
This keeps us disciplined and aligned with what price action is truly telling us.
📈 Risk Management Protocols
🔑 Core principles:
Max 1% risk per trade
Only execute at pre-identified levels
Use alerts, not emotion
Stick to your RR plan — minimum 1:2
🧠 You’re not paid for how many trades you take, you’re paid for how well you manage risk.
🧠 Weekly FRGNT Insight
"Trade what the market gives, not what your ego wants."
Stay mechanical. Stay focused. Let the probabilities work.
FX:EURUSD

Fundamental Market Analysis for August 8, 2025 EURUSDThe EUR/USD exchange rate remains stable after rising during the previous three sessions, trading at around 1.1660 during Asian trading hours on Friday. The pair may regain its positions as the US dollar (USD) may struggle as markets assess the probability of a 25 basis point (bp) rate cut at the September meeting at nearly 93%, compared to 48% a week ago.
Expectations for a Fed rate cut in September have intensified as the number of new applications for unemployment benefits in the US increased after the US nonfarm payrolls (NFP) report for July pointed to a cooling labor market.
Data on initial jobless claims in the US showed that the number of US citizens filing new claims for unemployment benefits rose to 226,000 for the week ending August 2. This figure exceeded the market consensus forecast of 221,000 and was higher than the previous week's figure of 218,000.
The probability that the central bank will leave rates unchanged is approximately 87%. Markets estimate the probability of another ECB rate cut before March 2026 at only 60%.
Trade recommendation: BUY 1.1660, SL 1.1625, TP 1.1710

EURUSD TODAYEURUSD chart 15m now waiting for a mitigation of POI above to take 15m swing low. but most probably a sideway could happen.
