EURUSD trade ideas
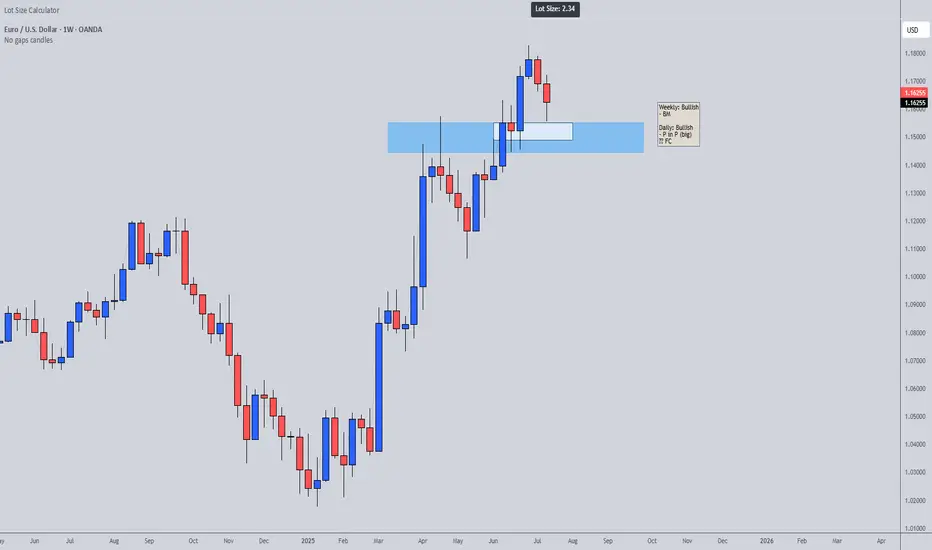

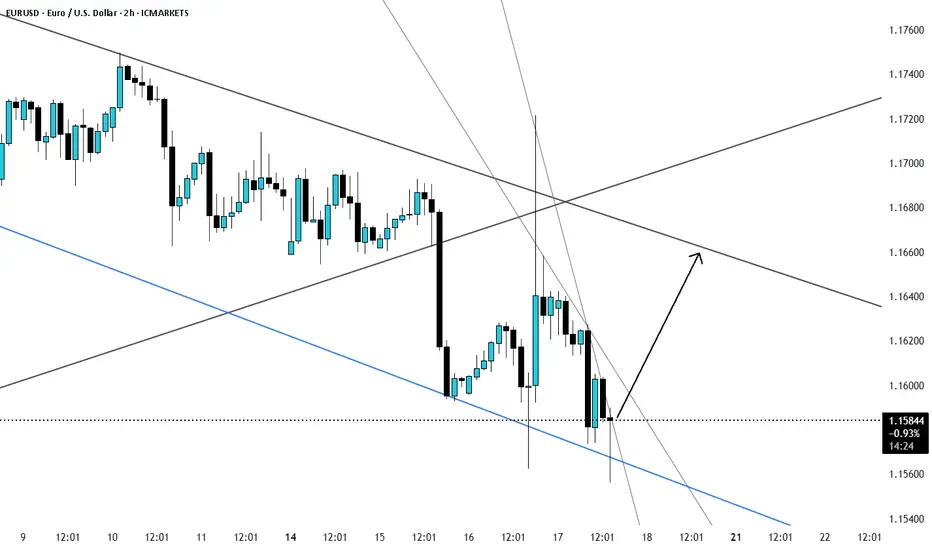
EURUSD potential being range recently story background:
1. a strong bullish momentum appear 23Jun - 1Jul
2. potential range of price level between 1.17176 and 1.15625
position enter criteria
1. if the price reach the key support lv 1.15451 and rebound with strong bullish momentum >>> the first entry point would be around 1.15693
2. if the price breakout the key resistance lv of 1.17183, i will wait for the price retest to around 1.16350 to long again

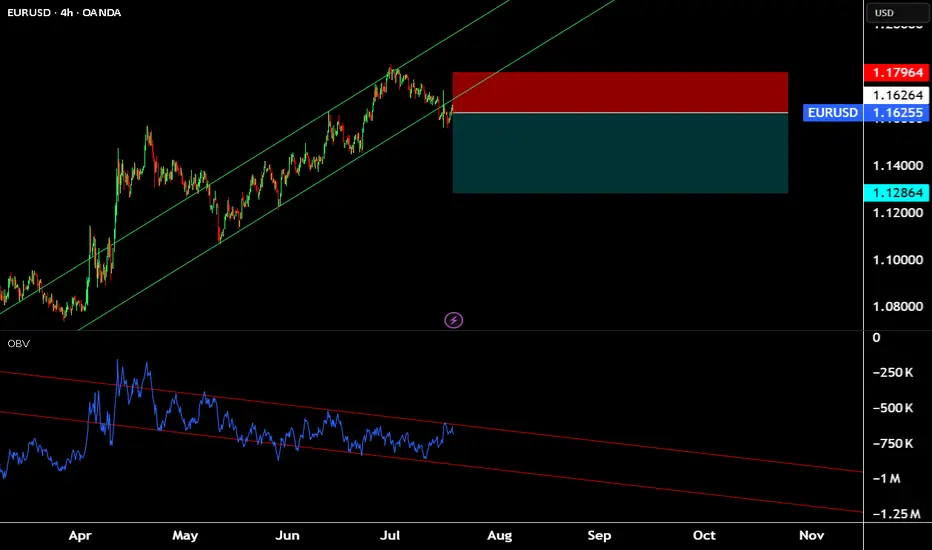
Time to play the Euro It's hard for me to remember the last time the Euro burned me. its been a long trend since liberation day. Time to play the Euro this week, Volume Divergence. Eurozone PMIs
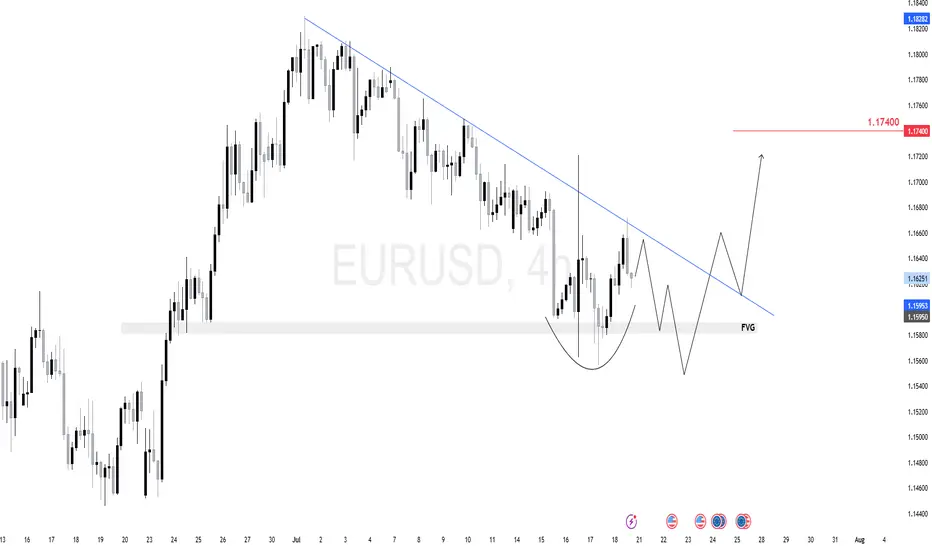
$EU (EURUSD) 4HEURUSD is forming a potential inverse head-and-shoulders just above a 4H fair value gap (FVG).
We expect one more dip toward the 1.1580–1.1595 zone to complete the right shoulder and tap demand.
From there, a breakout above the descending trendline can target 1.1740 next.
The key here is watching the reaction after the FVG test — if buyers step in strong, we ride it up.
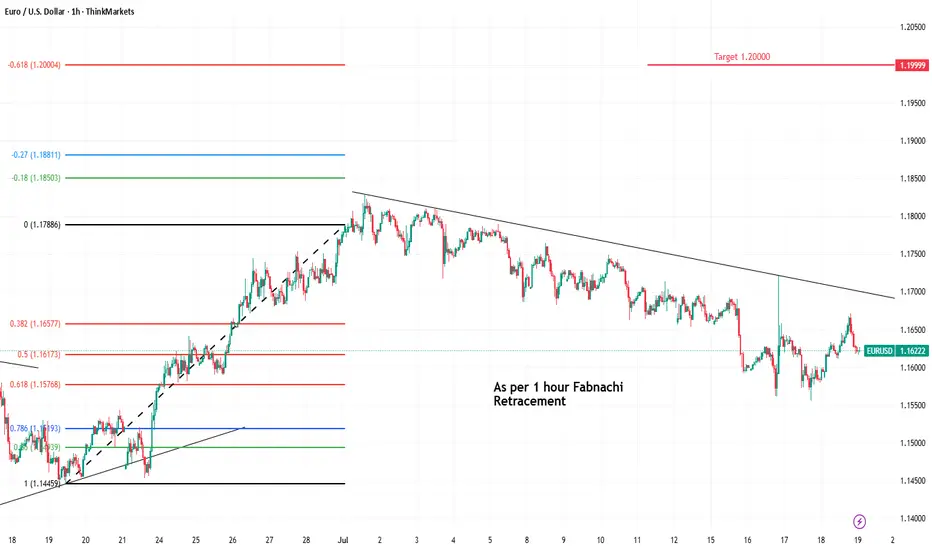
EUR/USD chart As Per 1 hour Time FrameEUR/USD chart As Per 1 hour Time Frame
Fibonacci Retracement Buy entry.
THINKMARKETS:EURUSD
Buy 1.16200
Target 1,20000
Stoploss 1.14300
EUR/USD Daily Chart Analysis For Week of July 18, 2025Technical Analysis and Outlook:
In the current trading session, the Euro has continued its decline, completing our Mean Support level of 1.160. Recent analyses indicate that the Euro is likely to experience a sustained downward trend, with an anticipated retest at the Mean Support level of 1.159 and a possible further decline to reach a Currency Dip of 1.152. Nevertheless, it is crucial to consider the potential for a dead-cat bounce toward the Mean Resistance level of 1.167, which could trigger a significant reversal of the downtrend and target a Currency Dip of 1.152.


EURUSD Liquidity Grab at supportEURUSD respacing this trendline support and price pulled back several time and price may move up with this.
EURUSD: Bears Are Winning! Short!
My dear friends,
Today we will analyse EURUSD together☺️
The market is at an inflection zone and price has now reached an area around 1.16557 where previous reversals or breakouts have occurred.And a price reaction that we are seeing on multiple timeframes here could signal the next move down so we can enter on confirmation, and target the next key level of 1.16419..Stop-loss is recommended beyond the inflection zone.
❤️Sending you lots of Love and Hugs❤️

EURUSD 1st Sell EntryEntry: 1.16216
Stop Loss (R): 1.16516
Take Profit (4R): 1.15016
*Disclaimer: I will not accept liability for any loss or damage, including without limitation to any loss of profit, which may arise directly or indirectly from use of or reliance on such information.

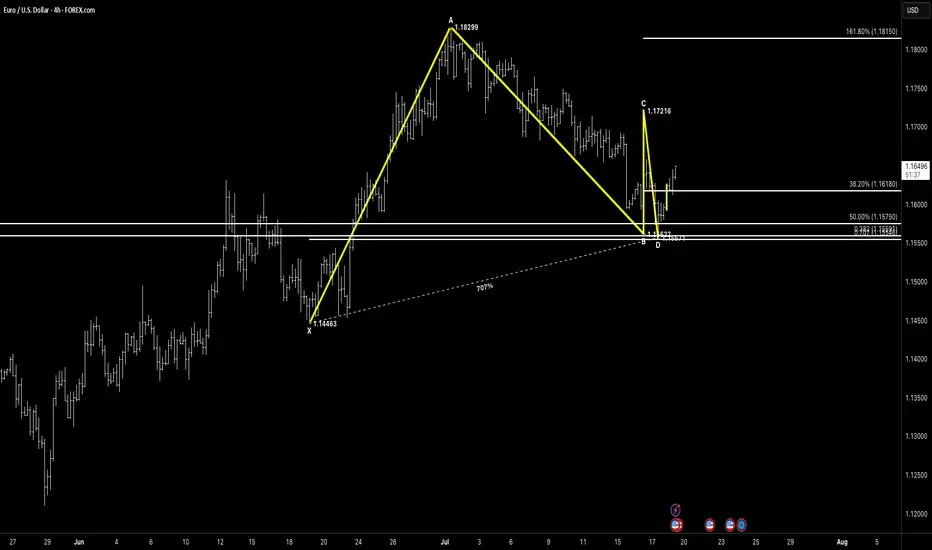
EURUSD / Euro – U.S. Dollar (4H) – ABC Bullish Structure EURUSD / Euro – U.S. Dollar (4H) – ABC Bullish Structure with Double Bottom Base
Pattern Overview:
Pattern Type: ABC Bullish + Corrective Double Bottom
Asset: EURUSD
Timeframe: 4H
Trade Type: Bullish Bias – Monitoring for continuation after rejection from cluster support
🔎 Key Levels
XA: 1.14663 → 1.18299
AB: 1.18299 → 1.16292
BC: 1.16292 → 1.17216
CD: Completion just under 1.15621 cluster
Major Fib Cluster: 0.707% XA, 0.886 AB, 50% CD, Prior Horizontal Support Zone
📐 Fibonacci Extensions & Key Ratios
38.2% retracement: 1.16180
50.0% retracement: 1.15750
161.8% extension: 1.18150
💡 Price Action & Setup
Price has completed an ABC corrective leg, forming a clean double bottom at the D point, hovering over the fib-rich support cluster.
The rejection candle shows buyer interest, and the recent higher low structure implies potential for continuation, especially if price reclaims and holds above 1.1650 short-term structure.
🧠 Market Sentiment
DXY easing slightly after strong dollar dominance
EUR macro calendar quiet – technicals may dominate next moves
Strong base = smart money accumulation likely underway
📊 Next Potential Movement
Break above 1.1675 opens path toward 1.1720, then possibly 1.1815
If 1.1575 cluster fails → risk of full XA retracement
🛡 Risk Management
Aggressive long entries already in play
Conservative entries should wait for higher low confirmation above 1.1650
Protective stop: under 1.1550 zone
📌 Conclusion
This is a bullish structure with a corrective double bottom base sitting right inside a dense confluence zone. Price is compressing between key fibs – expect a directional move next week. Keep your eye on the 1.1675 breakout or 1.1570 loss for next major decision.
“In the densest zones of indecision, patterns and confluence provide the clearest map.”
EURUSD BULLISH MOMENTUMMarket Structure
Higher highs and higher lows forming on the H4 and Daily timeframe.
Price may have broken out of a previous consolidation range, confirming bullish momentum.
Key Levels
former resistance, now support, psychological and historical levelS.

EUR/USD Drops to $1.16 Amid Strong U.S. DataThe euro declined to $1.16 on Thursday, reaching its lowest level in almost a month as the U.S. dollar regained strength. The dollar’s rise followed solid U.S. inflation data and President Trump’s comments suggesting he will keep Fed Chair Jerome Powell in place, reducing expectations for near-term Fed rate cuts. Meanwhile, markets continued to monitor U.S.-EU trade negotiations ahead of the August 1 deadline.
Resistance for the pair is at 1.1670, while support is at 1.1580.
EURUSD – Long Setup from 15M OB
Idea:
- Market structure is bullish on H1
- CHoCH + OB on 15M confirmed entry
TP: 3R | SL: Below 15M OB | Risk: 1%
#XAUUSD #ICT #OrderBlock #FundedTrader #TradingStrategy
Buy EUR USD from Pivoton higher charts like 1D price seems in an uptrend so I would look to open a Long position
price is now correction to Monthly pivot line which could be good RR

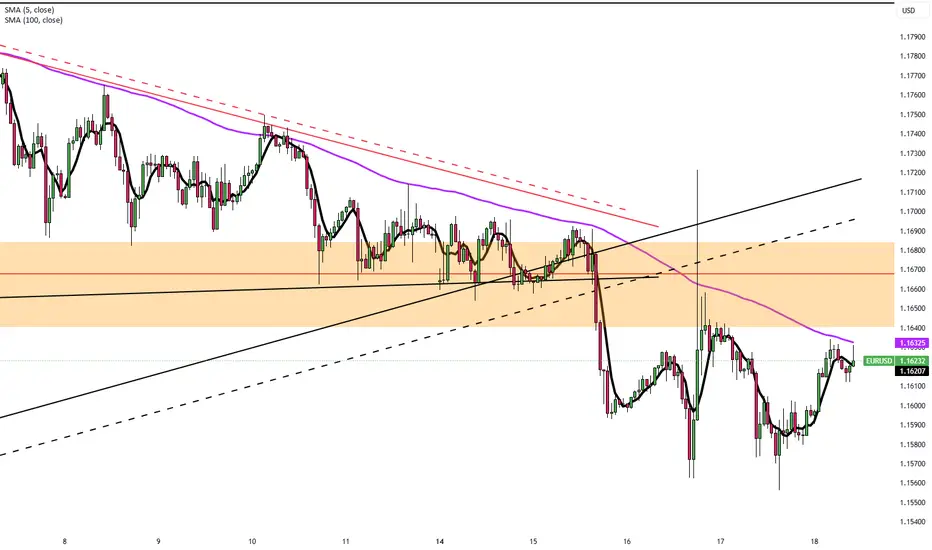
EURUSD(20250718) Today's AnalysisMarket news:
① Kugler: It is appropriate to keep the interest rate policy stable for "a while".
② Daly: Whether to cut interest rates in July or September is not the most critical.
③ Bostic: It may be difficult to cut interest rates in the short term.
Technical analysis:
Today's buying and selling boundaries:
1.1597
Support and resistance levels:
1.1683
1.1651
1.1630
1.1565
1.1544
1.1512
Trading strategy:
If the price breaks through 1.1630, consider buying in, the first target price is 1.1651
If the price breaks through 1.1597, consider selling in, the first target price is 1.1565

EURUSD | Bullish EURUSD has printed bullish divergence on one hour timeframe.It is already bullish on daily as well four hour timeframe bigger.Moreover,on candles chart it has formed a double bottom formation which also indicates a bullish reversal.

Eurousd techinical analysis.Eurousd techinical analysis next move posibale at h1 time frame.not finchinal advice.

LONG for EURUSD?LONG EURUSD
What is going on with EURUSD
We see how beautiful the market went up from the beginning of the trend line constatly with pullbacks that means a steady uptrend not really the urge that the market want to go back.
We used the fib as always to indicate 61.8% perfect pullback on that and as we see on the resistance that has to be tested.
There will be a fake break out of 100-150 pips.
If we go back on the RSI we see divergence momentum is back to average.
We call this hidden divergence price goes up and indicator goes down.
What indicates us that we also have new space for a higher high.
Targets we have in mind 1.19035 with high momentum what I expect it will hit the 1.20274 , important to have in mind 1.20000 is a key level price wants to go there as a magnet.
Reverse of the analyses:
If it breaks the 61.8% it will retest the market structure and goes to the 1.13544 with high momentum just to test price and set us offside because that is what the market want hit as many stop losses because that’s where the liquidity is build up, takes out and will continue the uptrend.
Follow my journey I try to post daily.
Markets I analyse XAUUSD, EURUSD, USDMXN, XTIUSD, XRPUSD, BTCUSD.
Will start more forex and Crypto soon.

Euro Slips, Brussels Stalls RetaliationEUR/USD is pulling back toward 1.1620 in Thursday’s Asian session as markets await Eurozone HICP data, with eyes on US June retail sales later in the day. The dollar stays firm on expectations that the Fed will hold rates at 4.25%-4.50% in July amid tariff-driven uncertainty.
President Trump announced plans to notify over 150 countries of a 10% tariff, possibly rising to 15-20%, targeting those with minimal U.S. trade ties. He criticized Fed Chair Powell but admitted removing him might destabilize markets, while floating possible trade deals with Europe and India.
Strong June CPI has reignited concerns about prolonged high rates. Dallas Fed’s Lorie Logan and New York Fed’s John Williams both warned that tariffs may keep inflation elevated, reinforcing the case for keeping rates steady.
Resistance for the pair is at 1.1670, while support is at 1.1580.

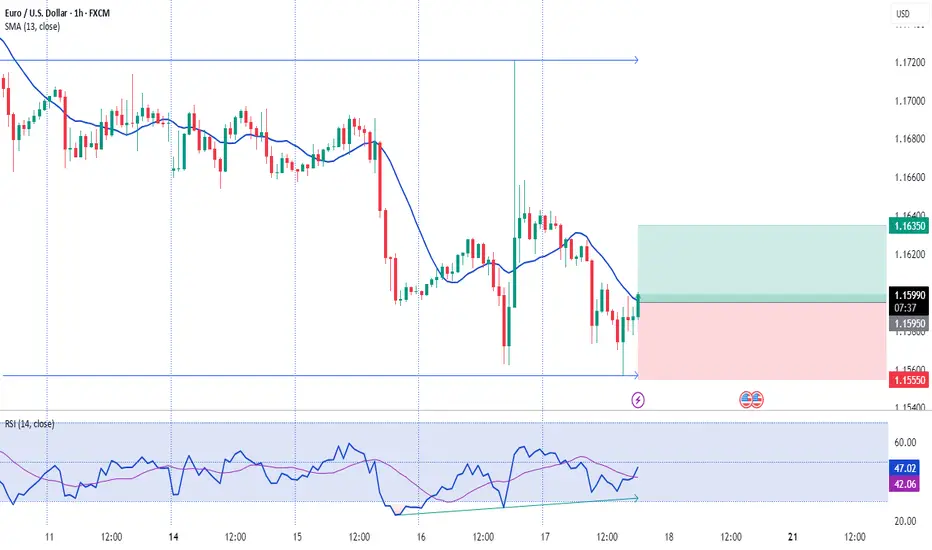
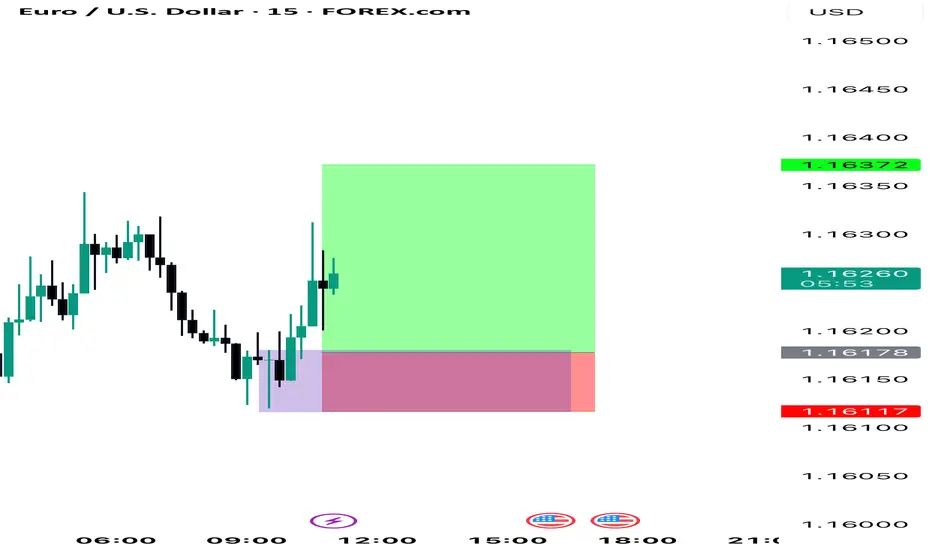
Trade Setup: EUR/USD 15min | OB Mitigation Play⚙️ Type: Countertrend (Risk-managed Buy)
Direction: Long
Entry Zone: 1.15850–1.15886 (Refined OB)
Entry Type: Buy Limit
Stop Loss: Below the OB low → 1.15790
Take Profit Targets:
TP1: 1.16043 (minor imbalance fill)
TP2: 1.16140 (supply zone re-test / 50% fib)
Risk to Reward: ~1:3 minimum (depending on fill and management)
🎯 Why This Setup Works
Price swept sell-side liquidity into a refined OB from the CPI move.
Confluence with 0.786 retracement, suggesting algo entry interest.
Strong momentum imbalance above gives room for retracement pullback.
DXY showing signs of short-term exhaustion at intraday highs.
🔒 Invalidation Criteria
15m candle close below 1.15790
Clean break and hold of OB low → Flip bias bearish
