EURUSD trade ideas

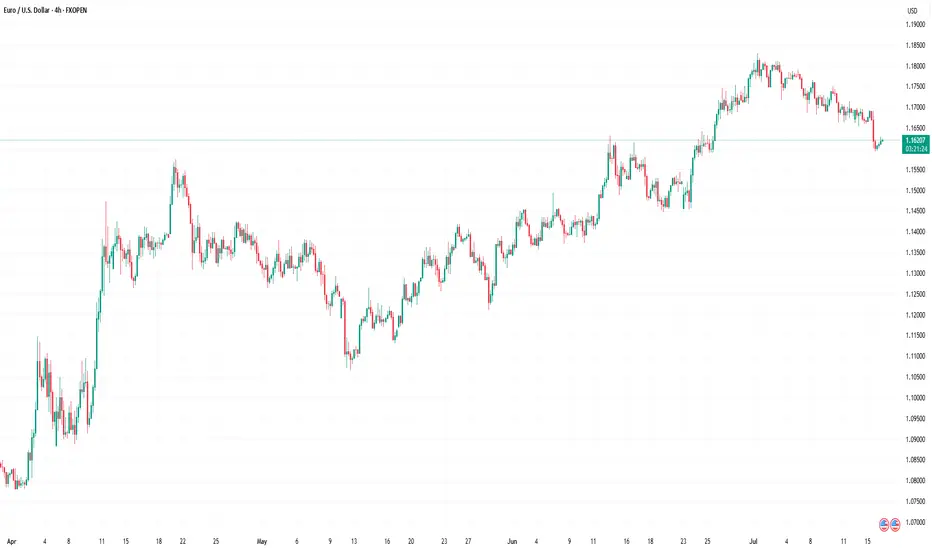
Euro-dollar pushes below $1.16 for nowThe announcement of 30% American tariffs on the EU from 1 August caused some negativity on the prospects for the bloc’s economy, but as with any similar announcement so far this year it’s likely that the figure can be negotiated down or just backtracked by the American government. A more immediate important factor driving euro-dollar down has been the significant rise in American annual headline inflation in June to 2.7%. The ECB is likely to cut once more this year and the Fed twice, but there’s some intrigue on the timing of the latter.
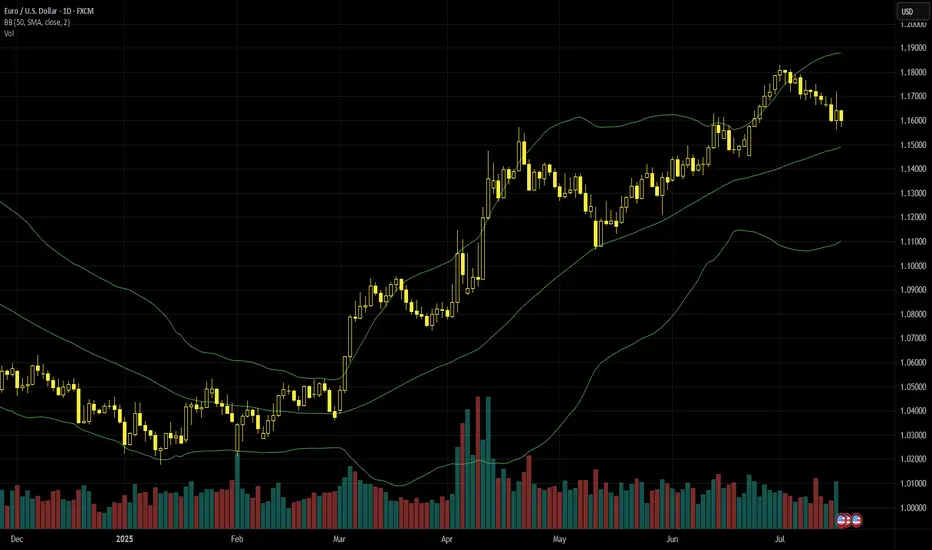
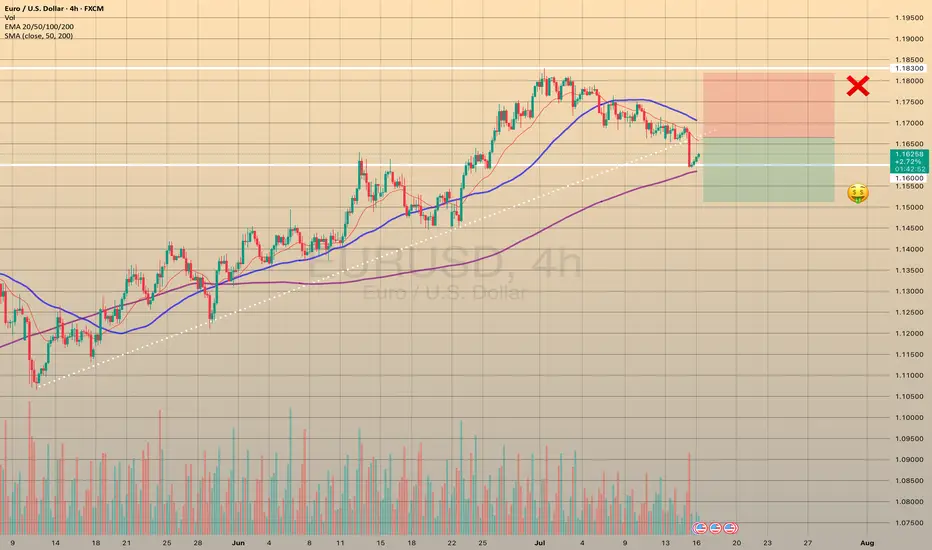
The retreat from the area of $1.18 – a high of nearly four years – has so far been fairly consistent with some momentum. However, $1.16 still seems to be an important battleground, with the long wick on 16 July indicating buying pressure. With the price currently oversold and there not being a clear uptick in selling volume, the 50 SMA around $1.155 might be an important short-term dynamic support.
A move back up to the 38.2% monthly Fibonacci retracement around $1.166 seems possible in the next few days depending on the volume of buying and reactions to upcoming news. For now, the movement seems more like a relatively small retracement in the context of the uptrend than the beginning of a new downward or sideways trend, but this depends on the reaction to the ECB’s meeting on 24 July as well.
This is my personal opinion, not the opinion of Exness. This is not a recommendation to trade.
BullsHaving in mind that the have been in buys through the year so far. This would be a flag formation and we currently on the daily FVG which provides an entry to continuation in buys.
NB we have a resistance line and that would be iur target before EURUSD starts to dunp massively. Closure below the FVG will result in closure of the buys.

Eurousd techinical analysis.This chart shows a technical analysis of the EUR/USD currency pair on a 2-hour timeframe. Let's break down the elements and implications:
---
Key Chart Elements:
Current Price: 1.15988
Bullish Move Expected:
A potential price increase of 0.00574 (0.50%), targeting 1.16385 around 21:00 on July 17, 2025.
This is indicated by the curved arrow pointing upwards and the blue box highlighting a projected move.
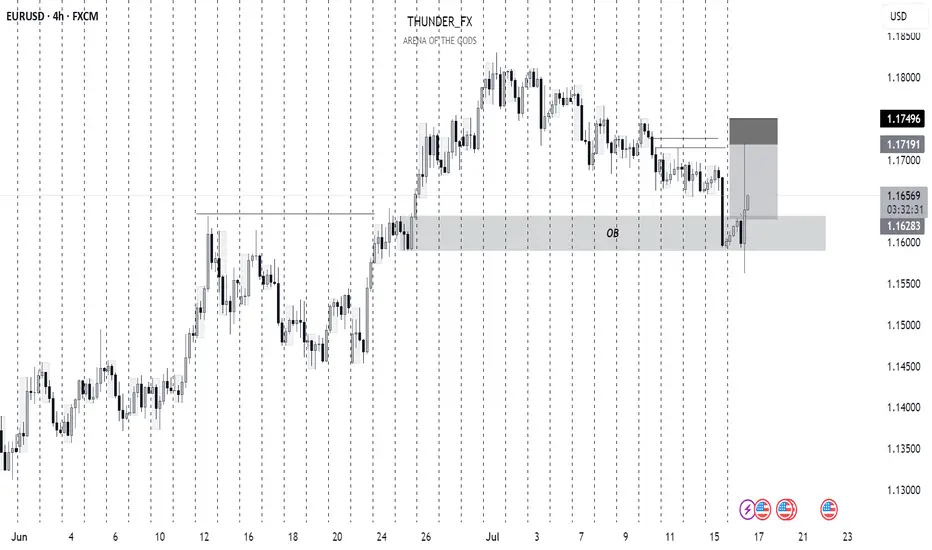
FVG (Fair Value Gap):
This zone often represents inefficiencies in the market where price might return to fill the gap. There's a visible FVG around the current action zone.
O.B (Order Block):

Fundamental Market Analysis for July 17, 2025 EURUSDThe euro is edging back toward the 1.16 – 1.17 range highs after headlines suggesting former U.S. president Donald Trump might try to dismiss Fed Chair Jerome Powell and a softer-than-expected U.S. Producer Price Index (PPI) print pressured the dollar. Political noise around the Fed’s independence, coupled with a cooling inflation pulse, has pushed market pricing toward a longer policy pause; the pair is hovering near 1.16250 at the time of writing.
Fundamental support also stems from the upcoming 24 July ECB meeting. Governing-Council commentary reveals a split between hawks and would-be doves, yet consensus that euro-area inflation remains above target makes an aggressive rate cut unlikely for now. Meanwhile, subdued U.S. Treasury yields—futures price a 95 % probability of no change this month and only 50 bp of total easing over 12 months—help narrow the U.S.–German 10-year spread to about 150 bp.
Against a backdrop of ongoing U.S. trade tensions and steady inflows into euro-area assets, that narrower spread leaves room for EURUSD to grind toward the 1.1680 target if sentiment stays risk-positive.
Trading recommendation: BUY 1.16250, SL 1.15950, TP 1.16800

EUR USD LONG RESULT Euro Price had been trading inside a falling channel then broke down the channel holding the Order Block Support from which I Opened the long position, just misread/ didn't extend our sl taking the 4HTF Support Trendline into consideration which cost the downside to be taken first before heading up
But no worries, better Setups and Results on the way 🙌
_THE_KLASSIC_TRADER_.

Potential IdeaCould see price go for last months low seeing that it took last months high so giving that this month has opened high now looking for the low then close at the end

EUR/USD Trend Analysis: Pullback or Reversal?Alright Traders,
Looking at the charts, it seems price just broke below a really strong trend line support – that line held up multiple times (you can see the circled spots!).
Now, the big question is: Is this just a quick dip (a pullback) in our current uptrend, or is this the end of the uptrend altogether?
If the price holds up at the 1.16146 support level, we could see a strong move higher, potentially all the way to our daily trend line resistance (that dotted line).
But, if the 0.618 Fibonacci support level fails to hold, we might be looking at a short downtrend heading towards a daily or even weekly support zone.
My technical indicators are flashing 'buy' right now, but we know we can't just follow indicators blindly.
So, here's my plan: I'm waiting. I want to see if this pullback finishes and price starts climbing again, or if it clearly shows us the uptrend is over and a downtrend has started. Patience is key!
Timeframes used: Daily and Weekly
Current Trend: Uptrend"

Bearish Momentum Builds Below Broken Support
Hello everybody!
Price is in a strong bearish trend and has broken a support area, which we now expect to act as resistance.
The break of the upward trendline adds a second confirmation to take a short position.
The target is around 1.14990.
The stop loss is placed beyond the downward trendline and will be trailed along with it.
If the downward trendline is broken, the short position will be invalidated.

EUR/USD Technical Outlook Daily chart frame**EUR/USD has bounced from the S1 zone (\~1.1595–1.1575)**, chart analysis
**EUR/USD Technical Outlook**
**Current Price:** \~1.1618
**Recent Action:** Rejection from S1 zone, forming a potential base.
**Bullish Scenario (Active)**
The pair has bounced from key **S1 support** (1.1595 area), suggesting demand is present.
**If momentum holds:**
* **Immediate Target 1:** 1.1645 (Fibonacci + 21 EMA)
* **Target 2:** 1.1665–1.1685 zone (7 EMA + minor resistance)
* **Target 3:** 1.1725 (R1 zone and mid-July resistance)
* Breakout above R1 would shift momentum firmly bullish.
*Watch for bullish continuation candles and rising volume.*
**Bearish Risk (Still Possible)**
* If the bounce stalls near **1.1645–1.1665**, and the pair reverses:
* A drop back toward **1.1595–1.1575** support could occur again.
* Break below that zone would expose:
* **S2 support at 1.1510**
* Possibly extend to **1.1475** in case of stronger USD demand
Summary:
* **Bounce from S1** shows initial bullish strength.
* **Key resistance to break:** 1.1645–1.1685 for bullish continuation.
* **Key support to hold:** 1.1595–1.1575 to avoid deeper correction.

trade idea fulfilledi expected EU to take out the eh above, get into the fvg and then sell off. it has done just that
EUR USD shortThis is not my original idea. I took some advice and looked at other ideas, so I decided to come up with a short one. Let's see what happens.
Please note: This is for educational purposes only and not a trading signal. These ideas are shared purely for back testing and to exchange views. The goal is to inspire ideas and encourage discussion. If you notice anything wrong, feel free to share your thoughts. In the end, to learn is to share !

EURUSD: The Market Is Looking Down! Short!
My dear friends,
Today we will analyse EURUSD together☺️
The in-trend continuation seems likely as the current long-term trend appears to be strong, and price is holding below a key level of 1.15850 So a bearish continuation seems plausible, targeting the next low. We should enter on confirmation, and place a stop-loss beyond the recent swing level.
❤️Sending you lots of Love and Hugs❤️

Euro Steady, EU Prepares $84B RetaliationEUR/USD hovered near 1.1670 in Tuesday’s Asian session as markets awaited US-EU trade updates. Despite Trump’s 30% tariff announcement on EU imports, he confirmed that negotiations with Brussels are ongoing ahead of the August 1 deadline. According to Bloomberg, the EU is ready to respond with proportional tariffs targeting $84B (€72B) worth of US goods, including Boeing jets, bourbon, cars, and machinery.
Resistance for the pair is at 1.1715, while support is at 1.1645.
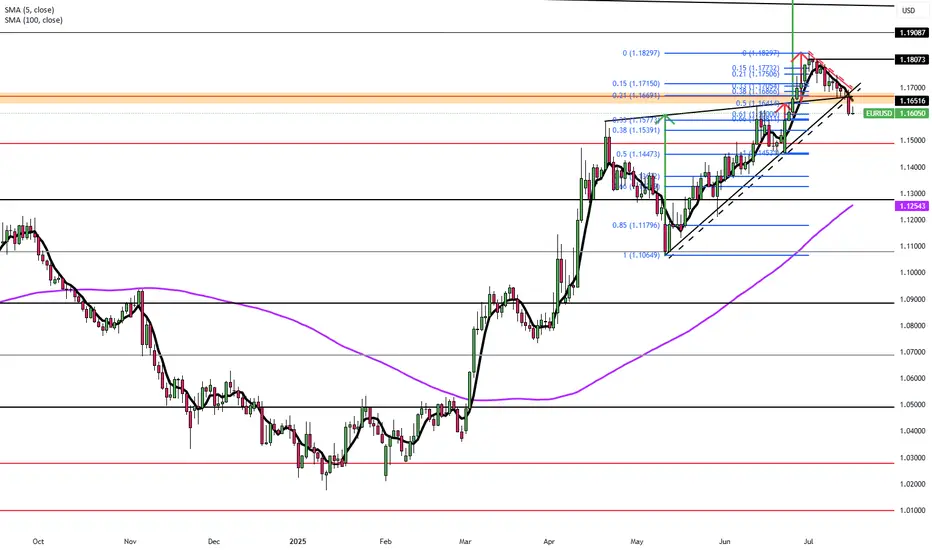
EURUSD Under Pressure as Macro Divergence WidensEURUSD is facing renewed downward pressure after rallying from 1.02 to 1.18 in a strong multi-month move. However, diverging inflation expectations between the EU and the U.S. are now weighing heavily on the pair.
One major signal comes from real yields. The Germany–U.S. 10-year real yield spread currently sits at -1.1182, the same level seen during the 2024 top near 1.11 and the 2023 top near 1.10. By that measure, EURUSD appears expensive. Over the past five years, 69% of EURUSD’s moves can be statistically explained by this real yield spread, making it a key macro indicator.
Inflation expectations are also diverging. The U.S. 5y5y inflation swap is trending upward, while the EU’s equivalent has remained flat. This suggests the Fed may keep rates elevated for longer than initially expected.
Beyond bond market dynamics, the August 1 tariff deadline is approaching with no deal in sight. In fact, tensions are rising, as the EU prepares possible countermeasures targeting $84 billion worth of U.S. goods. Adding to the pressure, political risk in France is building due to ongoing budget negotiations.
Technically, the recent break of both the uptrend (yellow) and the downtrend channel was significant. Euro bulls now need to reclaim and hold above 1.1660 to avoid deeper losses. If they fail, 1.1445 could become the next key support level, with further downside possible depending on how the news develops.
EURUSD could see further downside potentialFundamental:
The euro slipped as mixed ECB signals and political jitters pressured sentiment. ECB President Lagarde reiterated that borrowing costs will remain restrictive 'as long as needed,' even as inflation eases and economic activity stabilizes.
Renewed political tensions in France and soft German industrial data also weighed on the euro, though stronger services PMIs offered a modest offset. At the same time, the dollar held firm after a hotter US CPI print reduced the likelihood of near-term Fed rate cuts, keeping EURUSD near a three-week low.
Technical:
EURUSD retreated below the resistance at 1.1800 and within the ascending channel. If the price extends its decline, it could approach the support at 1.1450. Conversely, a break above the resistance at 1.1800 could prompt a further rise toward the resistance at 1.1920.
By Li Xing Gan, Financial Markets Strategist Consultant to Exness

EURUSD SHORT SETUP4hour structure is extremely bearish creating series of lower lows and lower highs.
Couple with the fact that GBPUSD is also bearish, while DXY is bullish.
So, I expect price to move lower and break the major swing low below price.

EUR/USD : US Dollar Strengthens Following Inflation ReportEUR/USD Analysis: US Dollar Strengthens Following Inflation Report
Yesterday, the US Consumer Price Index (CPI) report was released, showing an increase in consumer prices. According to Forex Factory, annual CPI rose from 2.4% to 2.7%, exceeding analysts' expectations of a 2.6% rise.
As reported by Reuters, the data supports the stance of Federal Reserve Chair Jerome Powell, who has repeatedly stated that the anticipated inflationary pressure—driven in part by tariffs—is a reason to refrain from further interest rate cuts.
However, President Donald Trump interpreted the data differently. On his Truth Social platform, he posted that consumer prices remain low and called for an immediate rate cut.
The market responded with a stronger US dollar—indicating that participants believe interest rates are likely to remain at current levels in the near term. Notably, the EUR/USD exchange rate fell to the 1.1600 level for the first time since late June (as indicated by the arrow).
Technical Analysis of the EUR/USD Chart
Analysing the EUR/USD chart as of 7 July, we identified:
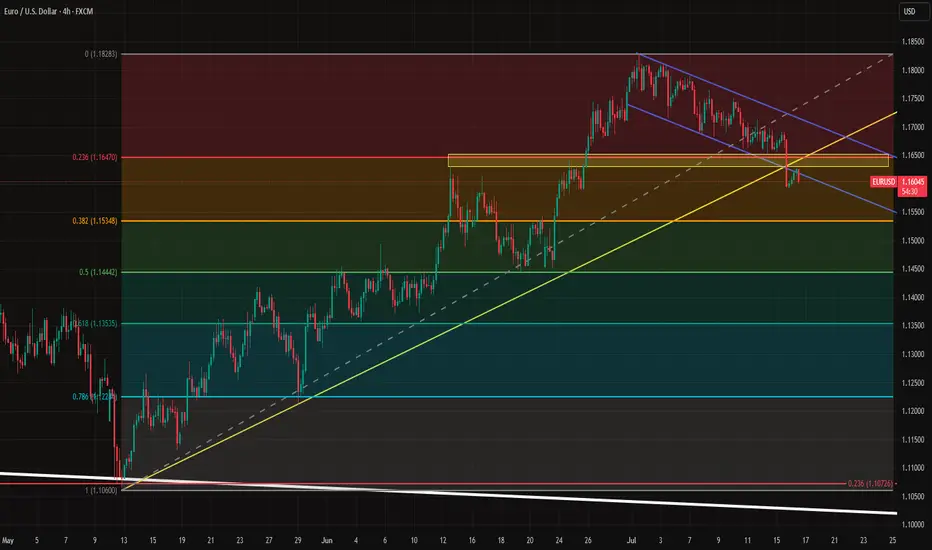
→ A long-term ascending channel
→ A potential downward trajectory (marked by red lines)
Since then, the pair has followed the outlined path and declined by more than 1%.
It is worth noting that today, the EUR/USD price is near the lower boundary of a key trend channel, which may offer significant support — traders may look for a technical rebound from this level.
Additionally, attention should be paid to the upcoming release of the US Producer Price Index (PPI) at 15:30 GMT+3. These figures carry particular weight in light of potential renewed inflationary pressures. This and other upcoming data may prove decisive for the near-term direction of EUR/USD.
This article represents the opinion of the Companies operating under the FXOpen brand only. It is not to be construed as an offer, solicitation, or recommendation with respect to products and services provided by the Companies operating under the FXOpen brand, nor is it to be considered financial advice.

EURUSD: Deeper Pullback Before Bullish MoveHello Traders,
On EURUSD, we opened the new week with a significant downside gap, which has already been filled during the Asian session. Price has reacted from that gap area, and heading into the London session, I’m expecting a deeper pullback into the daily demand zone before the bullish continuation.

check the trendConsidering the price behavior in the current support area, possible scenarios have been identified. It is expected that a trend change will form in the current support area and we will see the start of an upward trend.
If the price passes the support area, the continuation of the downward trend will be likely.

EURUSD TRIGGERED STOP LOSSTRADING IDEA UPDATE - EURUSD TRIGGERED STOP LOSS
The U.S. CPI report data came out right what the market expected (2.7% vs. 2.7% annually). After this report the pair went downwards on increased volume, triggering my stop loss and found the support only on 4-h sma200 and 1.16000 level.
What will be the possible scenario next?
I assume that the asset will go testing the trendline at 1.16650. If the test is successful, I will consider opening a
🔽 a pending sell stop order at 1.16651 with
❌a stop loss at 1.18180 and
🤑a take profit at 1.15122
Only if the retest is successful, not earlier! Let's observe first. Additionally, today is the U.S. PPI report coming out at 12:30 p.m. UTC, so got to be careful around this time
July 15 2025 -Sell Limit ActivatedGood day, folks!
Just sharing another learning from my ideas here:
EURUSD has been in a bearish structure since July 14, 2025 (1H Intraday). As you know, I always look for clear supply or demand validation before placing a sell or buy limit order. On the chart, you can see a valid supply zone that was generated on Monday. After that, I waited for a clear move during the Tuesday London and New York sessions, with the CPI news release acting as a catalyst for more volatility. The trade came to fruition during the New York session on Tuesday. (See chart for the complete breakdown of the movement and entry.)
RR: 1:3
Another Wyckoff schematics and structure analysis.
