EUR/USD Breaks Major Trendline Support – Bearish Continuation In🔍 EUR/USD Technical Breakdown – Bearish Structure Confirmed
The EUR/USD pair has officially broken below a well-established ascending trendline that supported the bullish structure since early May. This technical break is a strong bearish signal, suggesting a potential shift in market sentiment as the pair loses upward momentum.
The pair is now trading around 1.16760, with sellers gaining control after failing to sustain above the 1.1700 region. The breakdown aligns with classic market structure principles, where a clean trendline violation often leads to a continuation move toward the next key support zone.
📍 Target Zone:
The identified downside target is around 1.1500, a critical demand zone that aligns with previous consolidation and potential liquidity pools. This area may act as a magnet for price before any significant reversal occurs.
📘 Trader's Insight:
This setup presents a clear example of a trendline break leading to a bearish continuation pattern. Professional traders may look for retests of the broken trendline for confirmation entries, or short-term rallies to add positions, while maintaining disciplined risk management.
✅ Technical Summary:
Structure: Bearish Breakout
Resistance: 1.1700
Support/Target: 1.1500
Bias: Bearish below trendline
EURUSD trade ideas

bearish on eurusdNot much clarity on EUR/USD to kick off the week. We're consolidating within that weekly FVG, and DXY is beginning to show strength. If we start closing below the CE of the weekly FVG, I'd like to see the sell-side get targeted.

EUR USD -+As it's approximately in the middle of the channel, there is no clear direction for me. Also, today is a French bank holiday, so I expect little to no range to be created. Therefore, we might not trade this pair today. The price movement is as slow as a snail crawling toward the bottom..
good luck ...

Do you feel stuck in trading“Ask, and it will be given to you; seek, and you will find; knock, and the door will be opened to you.” — Matthew 7:7
This verse isn’t just spiritual—it’s strategic.
📈 Ask for clarity
🔍 Seek wisdom
🚪 Knock with action
Breakthrough starts with faith and persistence.
Let this be your reminder: You’re not stuck—you’re being positioned. 💡🙌

EUR/USD| - Bullish BiasHTF Context: Noted a clear break of structure to the upside, signaling strong bullish intent. Originally expected a deeper liquidity grab, but price shifted before reaching lower zones.
MTF Refinement: Dropped down to the 30M for better alignment — spotted a liquidity sweep confirming smart money interest.
LTF Execution Plan: Now watching for mitigation of the 30M OB. Once tapped, I’ll look for internal structure shift (1M/5M BOS or CHoCH) to confirm continuation.
Mindset: Staying patient — if price wants higher, it should respect this OB and show its hand first.
Bless Trading!

EURUSD: focus on inflationThis week was calm when it comes to currently important US macro data. The most important event was related to the release of the FOMC meeting minutes from the June session. There was no new information revealed in the Minutes, which has not already been communicated with the public. The Fed is aimed to maintain flexibility around future rate cuts. They will most probably remain on hold until the economic data more clearly supports a slowdown. Analysts continue to be of the opinion that the Fed will most probably make the next rate cut somewhere in late 2025 and into 2026. Such opinion is supported with ongoing risks of both rising inflation and unemployment due to introduced trade tariffs, putting challenge to Fed officials.
Industrial Production in Germany during May increased by 1,2% for the month, which was much better from estimated 0%. Retail Sales in the Euro Zone dropped in May by -0,7%, bringing the indicator to the yearly level of 1,8%. Balance of Trade in Germany in May reached euro 18,4B, better from expected euro 15,5B. Inflation rate in Germany, final for June, was standing at the level of 0% for the month and 2% for the year. Both figures were in line with market expectations. Wholesale prices in Germany in June were higher by 0,2% and 0,9% on a yearly basis.
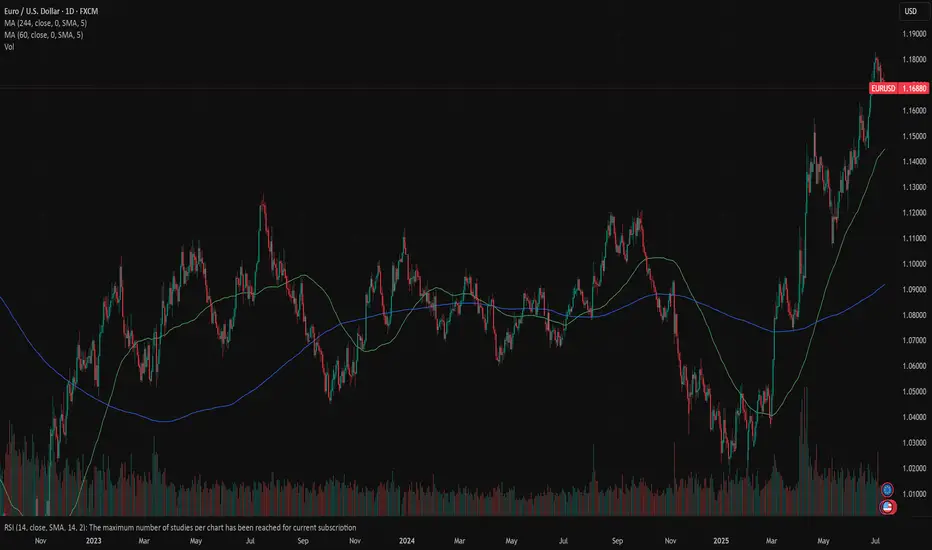
Markets favored US Dollar during the previous week, where the eurusd was traded within a range from 1,1790 down to 1,1670. The RSI moved from the overbought market side, ending the week at the level of 57. As long as the indicator is holding above the level of 50, there will be no indication that the market has started to clearly eye the oversold market side. At the same time, the MA50 continues to strongly diverge from MA200, within an indication of a potential slowdown in the coming period, as well as potential crossovers.
Although this week was a relatively calm one, the week ahead brings some important US macro data, including June inflation, PPI and University of Michigan Consumer Sentiment data. Considering current market sensitivity on any negative movements in inflation figures, the week ahead might bring some increased volatility on financial markets. As per current charts, eurusd has some space for a further move toward the downside, at least till the level of 1,1650. There is also potential for a short term reversal indicated on charts, with some potential that 1,1750 might be tested during the week.
Important news to watch during the week ahead are:
EUR: Industrial Production in the Euro Zone in May, ZEW Economic Sentiment Index in July in the EuroZone and Germany,
USD: Inflation Rate in June, Producers Price Index in June, Retail Sales in June, Building Permits preliminary for June, Housing Starts in June, Michigan Consumer Sentiment preliminary for July.
Week of 7/13/25: EURUSD AnalysisLast week's candle was a bearish engulfing meaning that most likely price will continue lower this week as a daily trend retracement. Waiting for LTF bearish price action before entering.
Major News:
Tuesday - CPI
Wednesday - PPI
Thursday - Unemployment

Ready to Swipe the Pips? | EUR/USD Heist Blueprint Unlocked🏴☠️💸 EUR/USD "Fiber Heist Plan" – Thief Trader Style 💸🏴☠️
The Vault is Open – Swipe the Bullish Bags! 🚀📈💰
🌟Hi! Hola! Ola! Bonjour! Hallo! Marhaba!🌟
Welcome, Money Makers & Market Robbers! 🤑✨
Here’s the latest masterstroke based on our Thief Trading Style™—a tactical breakdown of EUR/USD primed for a bullish breakout robbery. We’re targeting the red zone 🎯—where the weak hands panic, and the real players win.
🔓 Entry Plan (Buy Setup):
🟢 "The vault is wide open!" — We’re planning bullish entries using 15m–30m timeframe swing levels.
✅ Buy Limit Orders: Plot them smartly around most recent swing lows/highs.
⚠️ Chart Alert Suggested: Eyes on the prize, don’t miss the break-in.
🛑 Risk Guard (SL Setup):
💼 Stop-Loss: Set at nearest 30-min swing low (based on your risk appetite).
Remember, it’s about preserving your loot, not just grabbing it.
🎯 Target Area:
🎯 Primary Target: 1.19000
🎯 Optional Trailing SL: Ride the wave, lock the profits as price moves.
🧲 Scalpers' Notice:
Only scalp long. Got big pockets? Jump in. Smaller bags? Swing along.
💡 Trailing stop advised—don’t let the market steal your gains.
💹 Current Market Outlook:
EUR/USD is moving bullish—supported by technical signals, macro news, COT insights, and intermarket vibes.
🧠 Use all tools: Fundamental 📊 + Sentiment 🧭 + Quant + Bias Score 📈.
📎 Want the full breakdown? Check the 👉.Liinkk.🔗
(Keep updated, conditions shift fast!)
⚠️ News Risk Alert:
🚨 Stay alert during news drops—avoid fresh trades then.
Use trailing SLs to lock profits & guard against reversal raids.
💖 Support the Robbery Plan!
💥 Hit that Boost Button 💥 if you're riding with the Thief Team!
We steal smart, we trade sharp — every day’s a new heist in this market.
See you on the next plan! Stay legendary 🐱👤💸🤑🔥

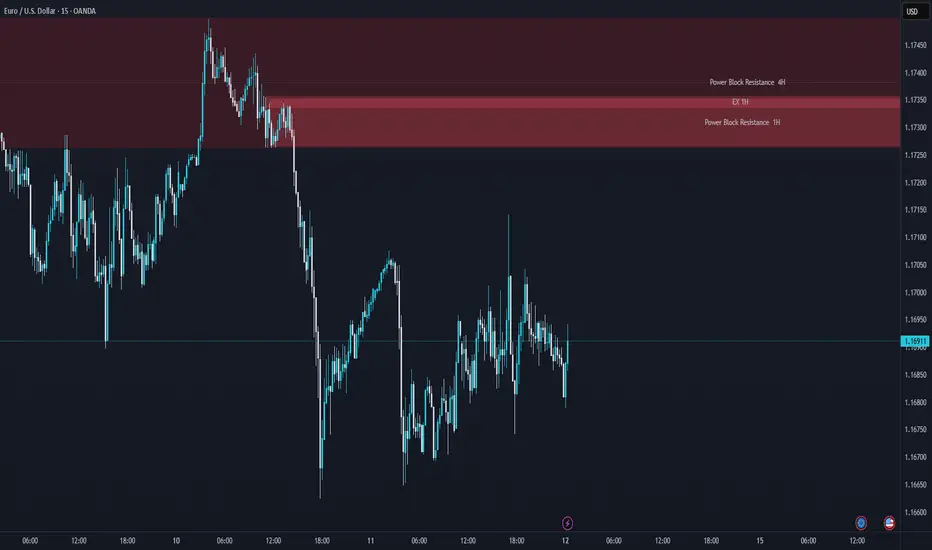
EURUSD: NEW WEEK TECHNICAL BIAS ( MARKET OPEN) Higher Timeframe Bias:
The Ascend Sequence on Monthly, Weekly, and Daily remains intact; current Descend Sequence is viewed as a pullback within bullish orderflow. HTF bullish stance is maintained unless invalidated.
Current Structure (Short-Term):
Descend Sequence is still active across Daily, 4H, 1H, and micro-timeframes—momentum favors sell-side flow for now.
Decision Range:
Defined Decision Zone: 1.17494 – 1.16624
▫︎ A break below 1.16624 strengthens the case for continuation of bearish leg.
▫︎ A break above 1.17494 would signal a bullish reclaim and potential Trend Signature Shift (TSS).
Execution Scenarios:
Scenario 1: If price trades into the 4H Order Clustering Zone (OCZ) from below and shows weakness, I’ll consider a short setup, ideally via Momentum Breach Entry (MBE) or a Retrace Precision Entry (RPE).
Scenario 2: If market opens with a sharp Impulse Drive to the downside without tapping into the OCZ, I may consider tactical short opportunities, but only with caution and reduced risk.
Target Zone for Shorts:
Primary short-term target: Discount Zone of the Weekly/Daily price leg, where a Weekly PIZ and Rally Origin align.
Bias Invalidation:
A strong reclaim and hold above the decision range will invalidate short bias and reposition me for long setups in alignment with the HTF bullish framework.
Summary:
Sell-side lean remains valid short-term. However, macro bullish context persists. Awaiting structural resolution from decision range to confirm directional intent.

Bearish Signal | Technical + Custom AlgoSmart Trend Signal | Technical Analysis + Custom Algorithm
This signal is the result of a combination of classic technical trend analysis and a proprietary software I personally developed.
eur usd possible scenario for eur usd if it is to repeat the last swing pattern it can be a viable trade

eur usd bullish ideahope you have a green portfolio this is an idea based on trending lines and bullish flag pattern there is possibility that this happen today

eur usd bullish flag scenarioas it seem we may have a bullish flag today or tomorrow lets see.
for break out confirmation use 15 min chart, use candle stick patterns and avoid trades on major news out come cuase they can to lead unpredictable result so every analyze can go wrong.. good luck

EURUSD LONG TERM UPEURUSD Live Trading Session/ EURUSD analysis #forex #forextraining #forexHello Traders
In This Video EURUSD HOURLY Forecast By World of Forex
today EURUSD Analysis
This Video includes_ (EURUSD market update)
EURUSD Analysis today | Technical and Order Flow
#usdjpy #usdchftechnicalanalysis #usdjpytoday #gold
What is The Next Opportunity on EURUSD Market
how to Enter to the Valid Entry With Assurance Profit?
This Video is For Trader's that Want to Improve Their Technical Analysis Skills and Their Trading By Understanding How To Analyze The Market Using Multiple Timeframes and Understanding The Bigger Picture on the Charts.
Disclaimer: Financial Trading Has Large Potential Rewards, But Also Large Potential Risk. You must be aware of the Risk and Be Welling to Accept Them in order to Trade the Financial Market . Please be Carefully With Your Money.
We are talking about future market, anything can Happen,Markets are Always like that.dnt Risky more Than 2% of your account
Now you can join with our "vip premium" service
Join us and let's make trading together

EURUSD Daily: More trouble ahead or ready to recover?The last Friday NY bearish closed sited at Fibo(38.2) and still showing a strong bullish move since last March we may see a bit more downward move to test the Fibo(50) at 1.16388 before start another bullish leg up again. While the price stays above the 1.5956 level I will look for any price action towards 1.18298 but with all chaos caused by this tariff war we need to be careful.
As a technical reference, Resistance at 1.182998, Support at 1.14522 and RSI(14) at 58 that seems to be heading to test the 50 level.

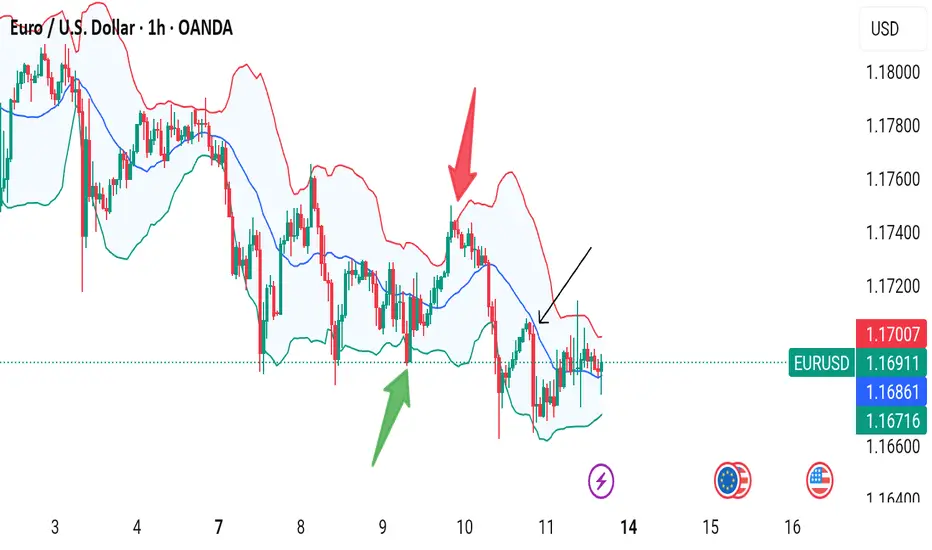
What Are Bollinger Bands? How to use it.✅ What Are Bollinger Bands?
Bollinger Bands are a volatility-based technical analysis tool developed by John Bollinger. They consist of three lines:
1. Middle Band: 20-period Simple Moving Average (SMA)
2. Upper Band: Middle Band + 2 standard deviations
3. Lower Band: Middle Band - 2 standard deviations
The bands expand and contract based on price volatility.
📊 What Bollinger Bands Tell You
Contraction (Squeeze): Low volatility, possible breakout coming
Expansion: High volatility, breakout in progress or exhausted
Price Touches Band: Doesn’t mean reversal—it's a sign of strength or weakness
🎯 Mastering Strategies with Bollinger Bands
1. Bollinger Band Squeeze (Breakout Strategy)
Setup: Bands are very close together (low volatility)
Signal: Wait for breakout and volume spike
Action: Enter in direction of breakout
Tip: Combine with MACD or RSI for confirmation
> 🔍 Example: If the price breaks above the upper band with strong volume after a squeeze → potential long entry.
2. Mean Reversion (Reversal Strategy)
Setup: Price touches or exceeds upper/lower band
Signal: Look for RSI divergence, candlestick reversal patterns
Action: Fade the move back to the 20 SMA (mean reversion)
Tip: Works best in ranging markets
> ⚠️ Warning: Don’t short just because price touches the upper band. Look for confluence.
3. Trend Riding with Bands
Setup: Price rides upper/lower band
Signal: Pullbacks to the 20 SMA in a strong trend
Action: Enter on bounce near SMA if the trend is strong
Tip: Use higher timeframes to confirm the trend
> 🟢 In an uptrend, buy near the 20 SMA when price pulls back but doesn’t break lower band.
📌 Key Tips for Mastery
1. Adjust settings for asset/timeframe (e.g., crypto might need a 10 or 14 SMA)
2. Never use Bollinger Bands alone – combine with:
RSI (for overbought/oversold confirmation)
MACD (trend confirmation)
Volume (for breakout confirmation)
3. Use multiple timeframes – e.g., 4H for trend, 15m for entry
4. Avoid chasing band breakouts without confirmation
5. Backtest strategies with your preferred asset
🧠 Advanced Concepts
Double Bottoms Outside Band: When price forms a W-bottom with the second low outside the lower band bullish reversal setup.
Walking the Band: In strong trends, price can "walk" along the band don’t fade too early.
Band Width: Track the width of bands to detect upcoming breakouts.
⚠️ Disclaimer
This guide is for educational purposes only and does not constitute financial advice. Trading involves risk, and past performance does not guarantee future results. Always do your own research (DYOR) and consult with a financial advisor before making any investment decisions.
continue example 1 how to identify direction of the marketeurussd replicated on w d 4 Today 1220254
join the bullies

EURUSD EU has been bearish from last week as we can see..
We expect further drop from next week after a small rally to to resistance
I will update the analysis depending on price action ..
Kindly and support for and follow more setups

direction example 1 finding directionbullish mostly
market reading saturday 12 25
2 ways to identify which direction its going

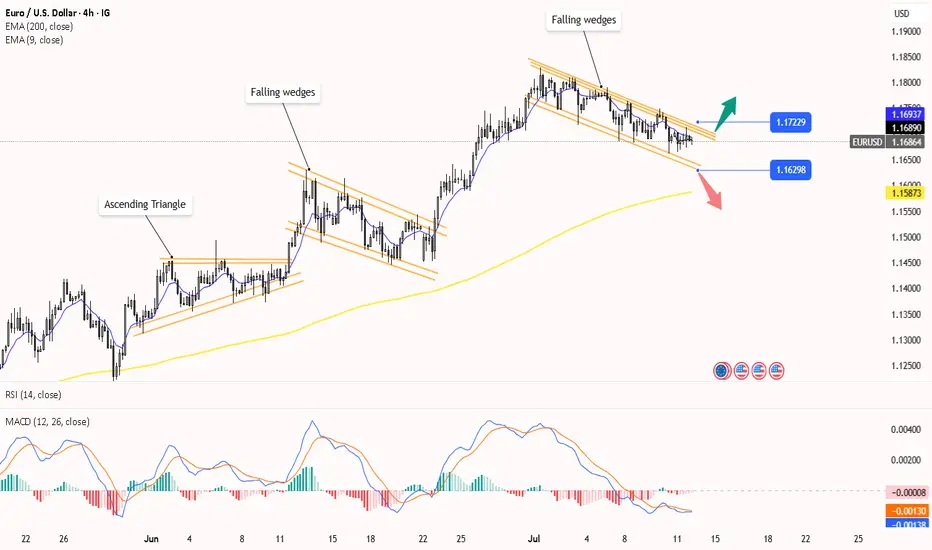
EUR/USD Falling Wedges Forming. Breakout Expected?Hello Traders,
Falling wedges can be seen in Eurusd chart and price is expected to breakout.
Wait for the price to break 1.17229 to go long or if it breaks below 1.1629 consider short.
This analysis is solely based on chart patterns and some indicators like MACD, RSI and Moving Averages.
Euro DollaroThe Euro is close to resistance, represented by the bullish equilibrium orbit in the 1.192 area. A break of the resistance would project prices to the 1.22 area to be realised by 25/08/2025.

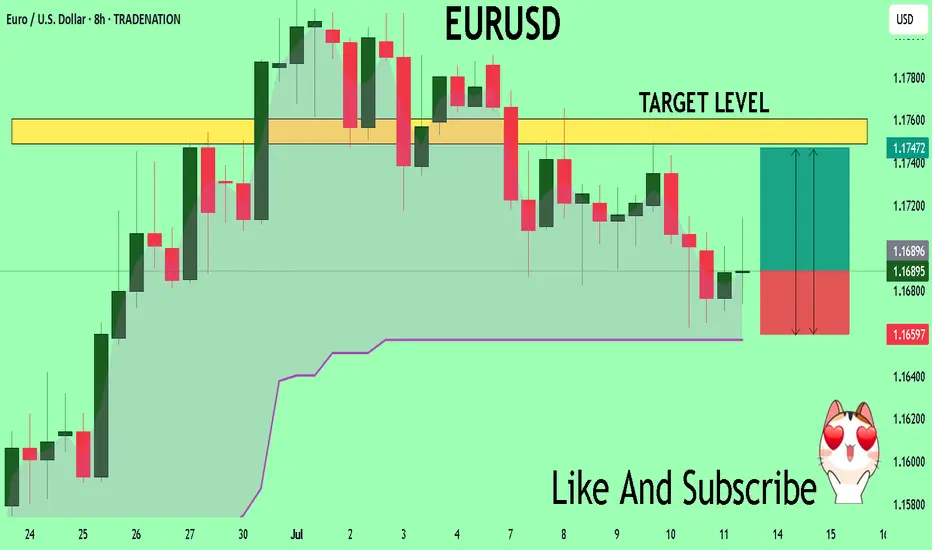
EURUSD Trading Opportunity! BUY!
My dear subscribers,
This is my opinion on the EURUSD next move:
The instrument tests an important psychological level 1.1689
Bias - Bullish
Technical Indicators: Supper Trend gives a precise Bullish signal, while Pivot Point HL predicts price changes and potential reversals in the market.
Target - 1.1748
My Stop Loss - 1.1659
About Used Indicators:
On the subsequent day, trading above the pivot point is thought to indicate ongoing bullish sentiment, while trading below the pivot point indicates bearish sentiment.
Disclosure: I am part of Trade Nation's Influencer program and receive a monthly fee for using their TradingView charts in my analysis.
———————————
WISH YOU ALL LUCK
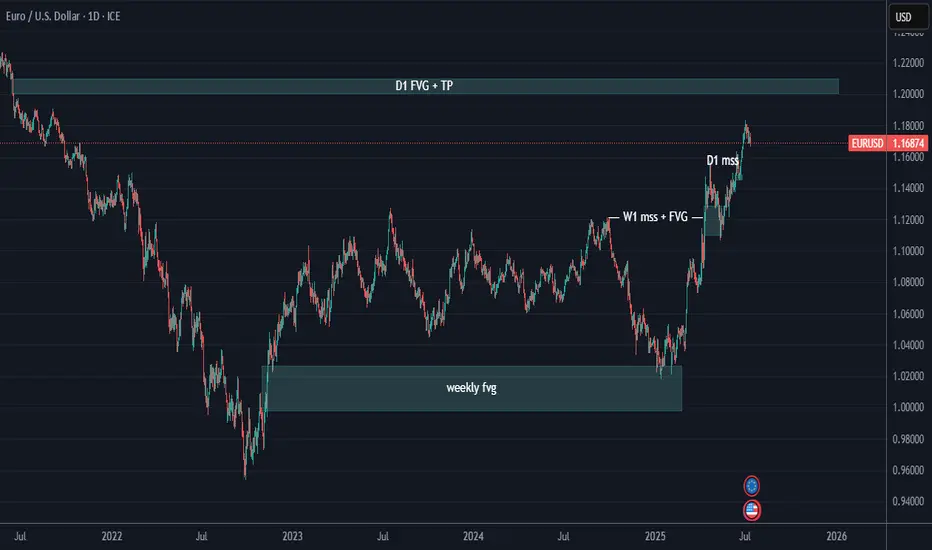
HTF analysis for EurUsdFollowing simple Ict concepts, we can see that EU has respected the higher time frames PD array.
Following the trend as price seems to be "drawn" to premium towards the D1 FVG area.
we can expect to see price fill that PD array around the 1.20800 area