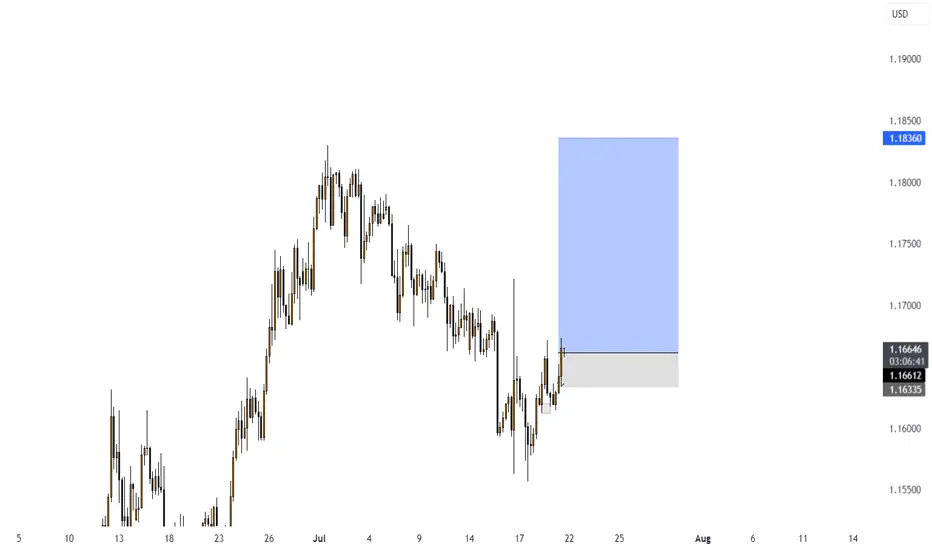
Eurusd changing trendPrepeair Ur selv to see euro against US dollar with a kinda big or minimum huge profit, going 2 cents above, from 1.1620 to 1.1840, ofc this is only in my POV.
Keep Ur investment safe and use lways a stop loss under wht you can lose, and I don't mean this trade, but all I mean, is that it need to be after Ur analista and Ur own Point of View.
Keep Ur trade simple
Abd do your own research, always.
EURUSD trade ideas

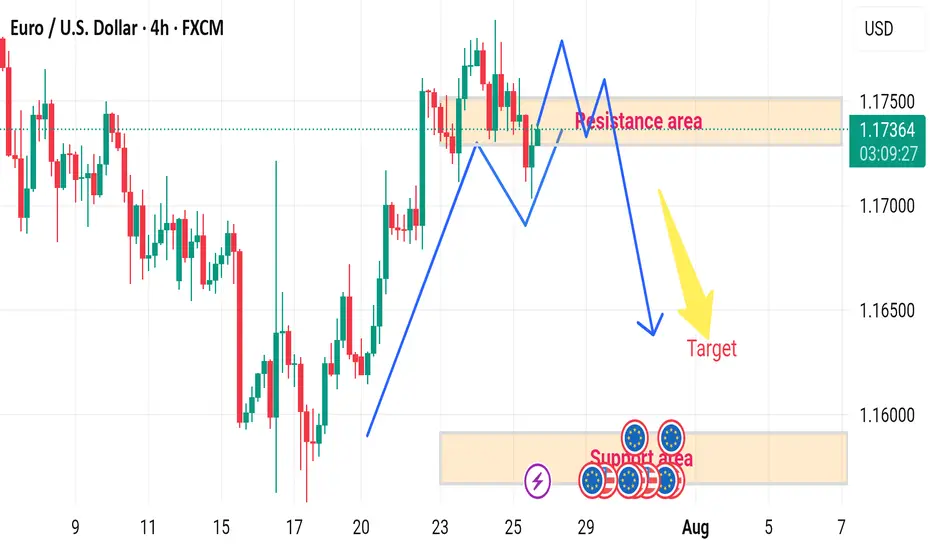
EUR/USD H4 DOWNWARD 🔄 Disrupted EUR/USD 4H Analysis
🟢 Current Context:
Price is currently at 1.17375, slightly below the resistance area (1.17400–1.17500).
Market shows a recent bullish impulse, followed by consolidation within the marked resistance zone.
Projection in the image suggests a double-top pattern forming at resistance, followed by a bearish reversal toward the target demand area (~1.15800–1.16000).
---
⚠️ Disruption Points:
1️⃣ Failed Double Top Scenario
Disruption Hypothesis: Instead of forming a clean double top and reversing, price may break above the resistance zone at 1.17500.
Reasoning: Strong bullish momentum and recent higher highs indicate potential for bullish continuation, invalidating the bearish target.
Disrupted Path: Price could break out → retest the resistance as new support → continue toward 1.18000–1.18300 zone.
2️⃣ Mid-Range Liquidity Trap
The current range may act as a liquidity trap:
Smart money could push the price slightly below support (fake breakdown), attract sellers, then reverse sharply upwards.
This would trap retail sellers targeting the 1.15800 zone.
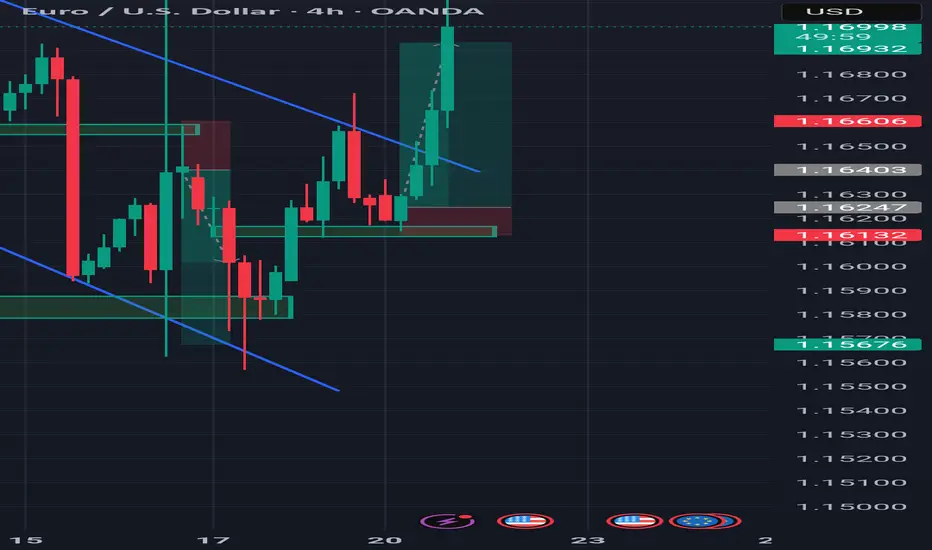
EURUSD - market structure EURUSD - market structure , easy and clean chart, of course this is no analysis, use risk and trade managment
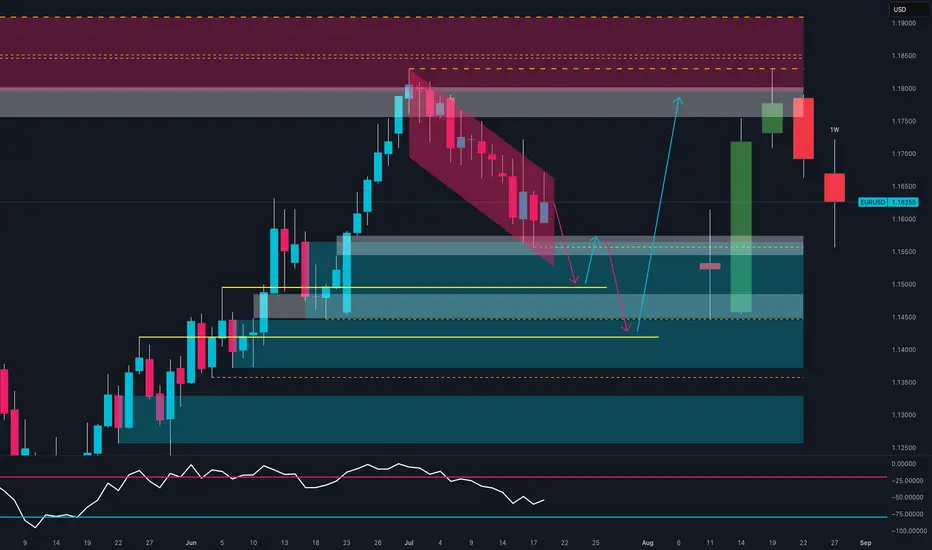
Smart Money Reloading: Will EUR/USD Explode from Demand Zone?📊 Technical Context (Daily)
EUR/USD is currently in a corrective phase following the strong June rebound from the 1.1450 area, which culminated in a high near the 1.1850 supply zone.
The recent bearish move has pushed the pair back into a key demand area between 1.1450 and 1.1550, a zone that has acted as support multiple times in the past.
The latest weekly candle shows a potential bullish exhaustion signal (long lower wick), with the RSI hovering in oversold territory.
📌 Primary scenario: Possible consolidation above 1.1550 followed by a bullish continuation toward 1.1750–1.1800.
📌 Alternative scenario: Break of the recent lows could lead to a deeper retest of the 1.1350 zone.
📈 COT (Commitment of Traders)
Non-commercial positioning shows growing bullish interest in the euro:
EUR: +971 new longs, -6,654 shorts → strong increase in net long exposure.
USD Index: -267 longs, +92 spreads → signs of institutional indecision on the dollar.
This suggests a favorable shift toward the euro by smart money.
💡 Retail Sentiment
Retail traders remain heavily short on EUR/USD (63% short) with an average entry price of 1.1579.
This reinforces the contrarian bullish case, as retail traders are trapped short in a potential reversal zone.
📆 Seasonality
Historically, July has been a bullish month for EUR/USD:
➕ 2Y average return: +0.0287
➕ 5Y average return: +0.0166
This supports a seasonal bullish bias aligning with the current technical setup.
✅ Operational Outlook
EUR/USD is trading at a technically and macroeconomically significant area. The confluence of:
Weekly demand zone being tested
RSI in oversold conditions
COT positioning favoring the euro
Retail sentiment skewed short
Bullish seasonality
…makes a bullish bounce plausible in the coming weeks, with a first target at 1.1750. Invalidation level below 1.1450.
📌 Bias: Moderately Bullish
📍 Technical Activation Zone: Above 1.1550 with confirmed bullish price action
EUR/USD About to Trap the Bears? Final Push Before the Drop! EUR/USD is showing a solid short-term bullish structure, with a move initiated from the demand base around 1.1560, fueling a strong rally toward the current level near 1.1770. Price is now approaching a significant supply zone between 1.1790 and 1.1875, previously responsible for the last major bearish swing. This area also aligns with projected Fibonacci levels (25%-100%), reinforcing its relevance as a possible inflection point.
This movement suggests there’s still room for price to push higher, likely completing the final leg of this bullish cycle before a more convincing short setup develops. At this stage, Fibonacci levels are not acting as firm supports, but rather as hypothetical pullback projections: once price enters the 1.1800–1.1875 area, it will be key to monitor for signs of exhaustion. A rejection here may initiate a bearish retracement toward 1.1670–1.1650, in line with the 62–70.5% fib levels.
Retail sentiment remains highly contrarian: 76% of traders are short, positioning themselves too early against the trend. This imbalance adds fuel for a potential continuation higher, as the market may seek to "squeeze" these premature shorts. Additionally, the COT report confirms growing institutional interest in the euro, with non-commercials increasing their net longs, while USD net long exposure continues to shrink.
Seasonality adds further confluence: late July is historically bullish for EUR/USD, suggesting one final leg up could materialize before a typically weaker August.
✅ Trading Outlook
EUR/USD is technically aligned for a final push toward the 1.1800–1.1875 premium zone, where a potential short opportunity may arise. The rally is currently driven by overextended retail shorts and supportive institutional flows. Only after price interacts with the upper supply zone should reversal signs be evaluated, with correction targets around 1.1670–1.1650. The ideal play: wait for confirmation of bearish intent in August, when seasonal weakness typically kicks in.

Bullish momentum to extend?The Fiber (EUR/USD) is reacting off the pivot and could rise to the 127.2% Fibonacci resistance.
Pivot: 1.1746
1st Support: 1.1659
1st Resistance: 1.1907
Risk Warning:
Trading Forex and CFDs carries a high level of risk to your capital and you should only trade with money you can afford to lose. Trading Forex and CFDs may not be suitable for all investors, so please ensure that you fully understand the risks involved and seek independent advice if necessary.
Disclaimer:
The above opinions given constitute general market commentary, and do not constitute the opinion or advice of IC Markets or any form of personal or investment advice.
Any opinions, news, research, analyses, prices, other information, or links to third-party sites contained on this website are provided on an "as-is" basis, are intended only to be informative, is not an advice nor a recommendation, nor research, or a record of our trading prices, or an offer of, or solicitation for a transaction in any financial instrument and thus should not be treated as such. The information provided does not involve any specific investment objectives, financial situation and needs of any specific person who may receive it. Please be aware, that past performance is not a reliable indicator of future performance and/or results. Past Performance or Forward-looking scenarios based upon the reasonable beliefs of the third-party provider are not a guarantee of future performance. Actual results may differ materially from those anticipated in forward-looking or past performance statements. IC Markets makes no representation or warranty and assumes no liability as to the accuracy or completeness of the information provided, nor any loss arising from any investment based on a recommendation, forecast or any information supplied by any third-party.

It has a good risk-reward ratio.Hello friends..
The transaction shown, if it reaches the specified area, you can enter the transaction in the lower time frame with confirmation.
Follow our page to see more analysis.
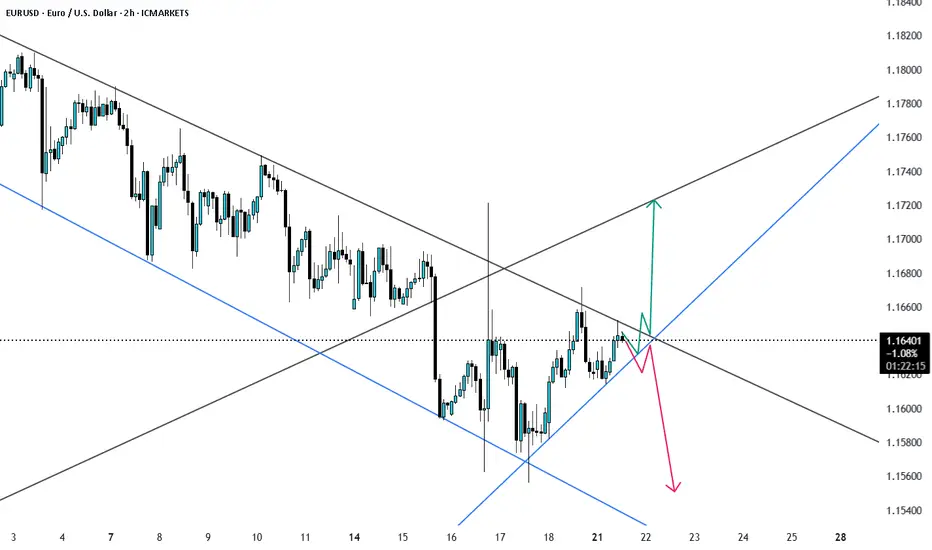
EURUSD at Channel resistance possible scenariosERUUSD is trading in a channel pattern and now the price has reached the Upper Resistance trendline. Will it break the resistance or follows the channel pattern again ? let us see. Buy at breakout or sella at breakdown.
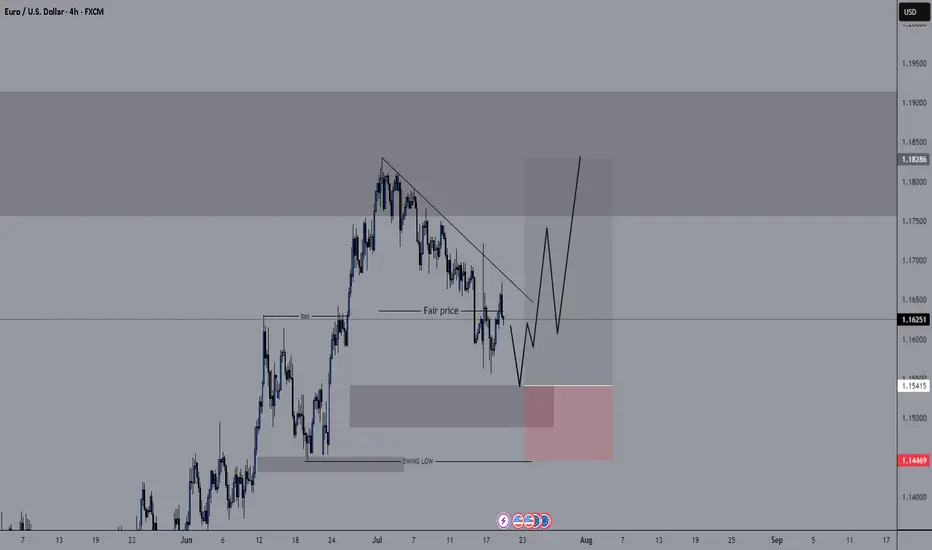
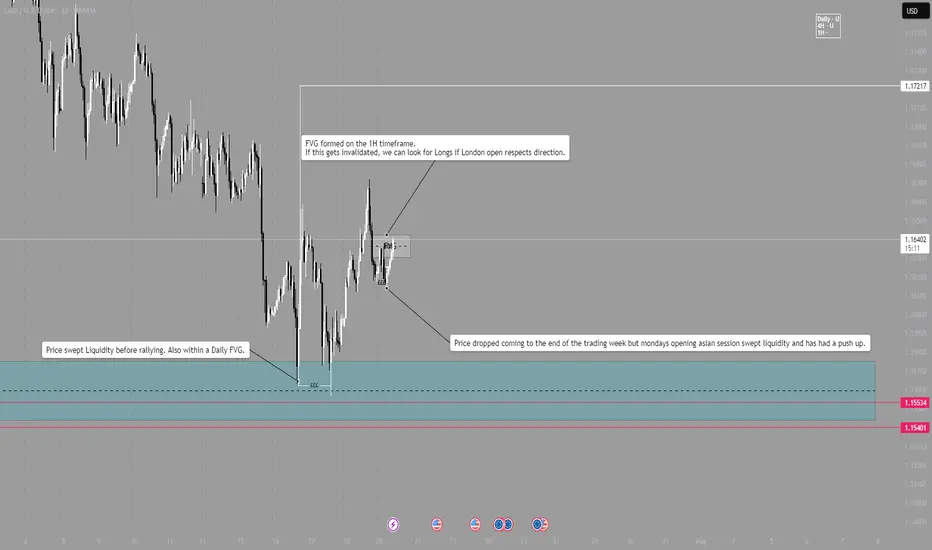
EUR/USD - LONGLondon Session Pre market breakdown.
Daily bias is long.
4H bias is Long.
1H bias is Long.
After last weeks sweep on liquidity within a Daily FVG, market pushed higher, providing several long opportunities.
Now at the beginning of the week, price dropped during Asia session and swept some of Fridays New York liquidity.
Price is pushing higher and is now in a 1H Bearish FVG, if the FVG is broken, we can look for Longs around that range.
NOTE - Wait and see how London open plays out, DO NOT enter within first 15mins and wait for trend continuation to be verified before entering. Always wait for a candle close and a break of structure.
EURUSD | Time For A Pullback?The week kicked off with strong impulsive moves to the upside, leaving no room for deeper correction. Then slowly from Wednesday, we started to see a decline in strength in the bullish run.
Now, with price edging toward the next swing low for a possible bearish change of character, is this a good way to ride the stream to the downside?
Keep your A-game on as we watch price unfold, and trade reactively to price movement.
Do not forget to guard your capitals with risk management.
Good luck traders. 👍
Follow me for more and more of these analyses.
See you on the next one. 🫡

EUR USD longas the trend sugest we would yet trade longs but the pair may have a correction ...
Please note: This is for educational purposes only and not a trading signal. These ideas are shared purely for back testing and to exchange views. The goal is to inspire ideas and encourage discussion. If you notice anything wrong, feel free to share your thoughts. In the end, to learn is to share !

"EUR/USD Bearish Reversal Setup from Key Resistance Zone"This EUR/USD 1-hour chart suggests a potential bearish reversal from the 1.17730 resistance level. The price has reached a key supply zone, with a marked fair value gap (FVG) and previous break of structure (BOS). The chart anticipates a drop toward the 1.16500–1.16788 support zone, supported by a highlighted short setup.

Analysis The market has gotten to the H1 FVG and idn it. Now we need to look for short opportunity. The lq has been taken.

Precision Inc. Eur/Usd has had a brilliant start to the week monday to wednesday reaching my objectives. Thursday is known to initiate a reversal therefore I am done for the week

Euro is pumping up Officially the market is targeting the buy side liquidity on the 1.8 , next week we will see if the market confirm the up trend in lower time frame

Hellena | EUR/USD (4H): LONG to the resistance area 1.18280.The previous idea was aimed at updating the maximum of 1.18280, but the correction turned out to be too deep.
Therefore, I am proposing a new idea. I believe that wave “3” has formed, and now we should see the completion of the correction in wave “4,” after which I expect to see an upward movement in wave “5.” My target is at least the high of wave “3” — the resistance area of 1.18280.
As for the correction, I think it could reach the 1.15459 area, but I recommend working with pending orders.
Manage your capital correctly and competently! Only enter trades based on reliable patterns!

Eurusd is bullishSince there is a clear retest at the daily support which was previously resistance now we will look for buys only on EU up to the next round number level
HTF EURUSD PA REVIEWFeel free to provide any feedback.
It is important to note the dynamics between bearish and bullish range-initiation-mitigation-continuation.
Where one phase might be the initiation leg out of a bearish range, it can also be the point of mitigation of a previous bullish range.

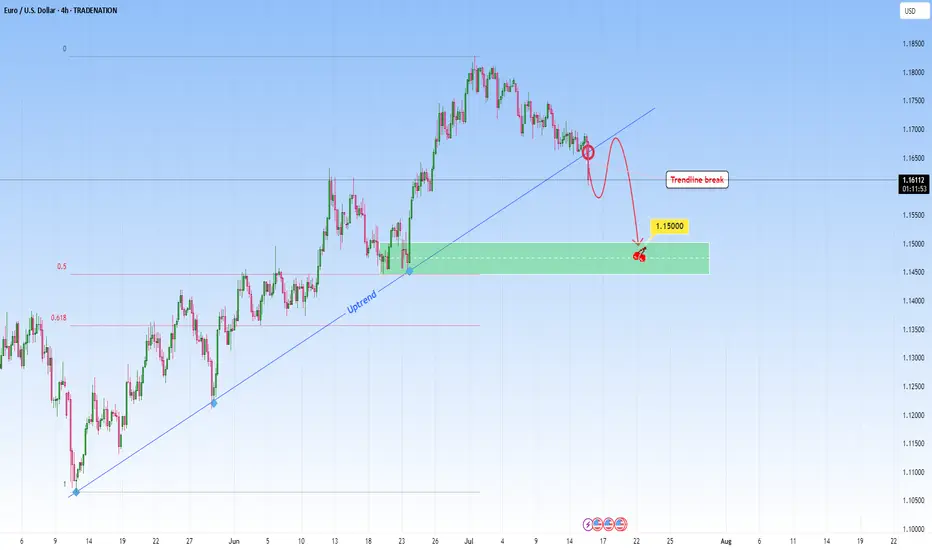
EURUSD: Sell Opportunity after Trendline breakEURUSD was in a steep uptrend but it might stop with this recent break through the uptrend. A break like this one on a strong trendline that had multiple touches, indicates either a potential reversal or major pause in the trend. This candle that broke the trendline signals the first hint of structural change.
I will be waiting for a retest and look to get involved in a short setup.
Ideally, what I look for in retests is to be met with a confirming candle. This would confirm the sellers have taken over and validate the change from uptrend to potential downtrend or consolidation phase.
My target would be around 1.1500.
Just sharing my thoughts for the charts, this isn’t financial advice. Always confirm your setups and manage your risk properly.
Disclosure: I am part of Trade Nation's Influencer program and receive a monthly fee for using their TradingView charts in my analysis .
EURUSD: Can't break the whale line!📉 EUR/USD Whale Wall – 1.1675 Rejection Zone
🐋 Smart Money is guarding 1.1675 like it’s sacred.
Every test into this level has been slapped down—likely a whale-level supply zone where institutional sell orders are stacked. VolanX projection curve suggests a macro fade into late July, aligning with DXY strength and bond volatility signals.
Outlook:
As long as 1.1675 holds, momentum favors downside toward 1.1450–1.1400. Rate divergence + weak Eurozone prints fuel the short bias. Break above 1.1675 invalidates.
📊 VolanX Protocol – Predict. React. Dominate.
#WaverVanir #VolanX #EURUSD #Forex #SmartMoney #FXStrategy #MacroTrading

Buy idea!Hello everyone, as I told you on Last idea on EURUSD, price will go up and will make a new Higher High. it is a good time to go long with 9 R/R ratio.

EUR/USD - Daily Chart (Wedge Breakout) (16.07.2025) The EUR/USD Pair on the D1 timeframe presents a Potential Selling Opportunity due to a recent Formation of a Wedge Pattern. This suggests a shift in momentum towards the downside in the coming Days.
Possible Short Trade:
Entry: Consider Entering A Short Position around Trendline Of The Pattern.
Target Levels:
1st Support – 1.0956
2nd Support – 1.0625
💡 Fundamental & Sentiment Context
Euro under pressure amid renewed concerns over EU‑US trade friction .
The USD is strengthening, supported by safe‑haven flows amid tariff uncertainties.
🎁 Please hit the like button and
🎁 Leave a comment to support for My Post !
Your likes and comments are incredibly motivating and will encourage me to share more analysis with you.
Best Regards, KABHI_TA_TRADING
Thank you.
Disclosure: I am part of Trade Nation's Influencer program and receive a monthly fee for using their TradingView charts in my analysis.

EUR/USD) bearish chochy Trend Read The captionSMC trading point update
Technical analysis of EUR/USD (Euro vs. U.S. Dollar) on the 4-hour timeframe. Here’s the breakdown
---
Technical Breakdown:
1. Market Structure Shift (CHOCH):
The chart highlights a Change of Character (CHOCH), signaling a bearish reversal after a previous uptrend.
This is confirmed by lower highs and lower lows forming after the CHOCH point.
2. New Resistance Zone:
The previous support (yellow box) has now turned into a new resistance level around 1.16400–1.16700.
Price has rejected this area after the breakdown, validating the resistance flip.
3. 200 EMA Breakdown:
Price is now trading below the 200 EMA (1.15928), which reinforces bearish sentiment.
The EMA may act as dynamic resistance on any pullbacks.
4. Target Zone:
The projected target is the key support zone around 1.14582, where price consolidated before the last major bullish move.
This level has historical significance and aligns with a clean support demand zone.
5. RSI Indicator:
RSI is not yet oversold, sitting in a neutral-to-bearish range, indicating further downside potential.
Mr SMC Trading point
---
Trade Idea Summary:
Bias: Bearish
Entry Zone: On breakdown and rejection from the new resistance area (~1.16400–1.16700)
Target Zone: 1.14582 (key support)
Invalidation: A break and close above the resistance zone
Confluence: CHOCH confirmation + support-turned-resistance + 200 EMA breakdown
---
Please support boost 🚀 this analysis)
