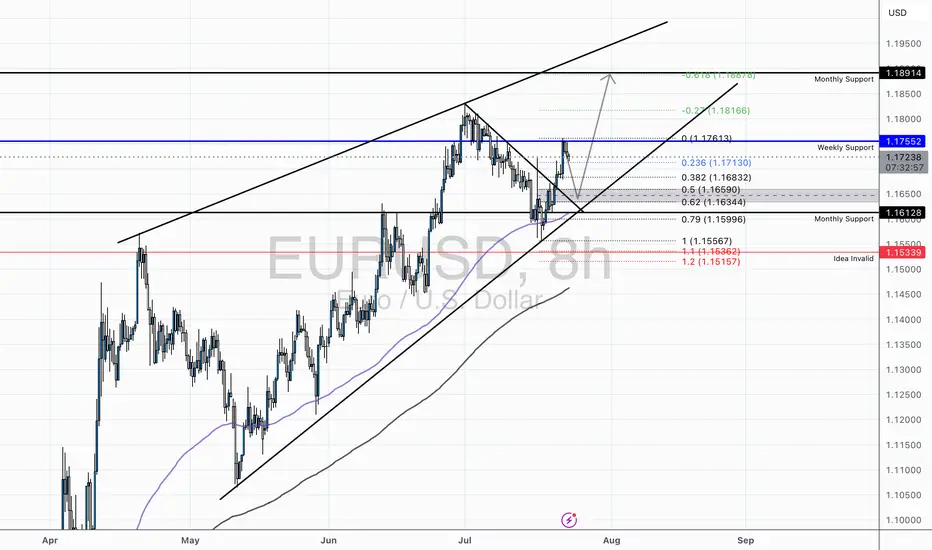
EUR/USD - Holding Bullish Structure Above Key Fibs and TrendlineTechnical Overview:
EUR/USD continues to respect its ascending channel structure, currently rebounding from the lower trendline support while trading above the 50 EMA and 200 EMA. After a healthy retracement to the monthly support (1.16128), the pair has shown strong buying interest, supported by bullish RSI divergence from oversold conditions on the 8H chart.
Key Levels:
Support Zone: 1.1613 – 1.1634 (Fib Cluster + Channel Support + Monthly Support)
Resistance Zone: 1.1755 (Weekly Resistance) followed by 1.1816 (0.27 Fib Extension) and 1.1887 (0.618 Extension)
Invalidation Level: Below 1.1533 (1.272 Fib + Structural Breakdown)
Confluences:
Price broke above a descending correctional trendline, indicating a potential bullish continuation.
Multiple Fibonacci levels (0.382, 0.5, 0.618) have stacked around the previous consolidation area, increasing probability of a sustained move.
RSI bounce from below 40 suggests short-term momentum reversal.
Trade Idea:
We may see a minor pullback into the 1.16344–1.1659 area before a potential continuation higher. Conservative bulls may wait for a retest of this zone with a bullish engulfing or pin bar confirmation before entering long.
Targets:
First target at 1.1755 (prior weekly resistance)
Second target at 1.1816 (Fib extension)
Final target near 1.1887 (major resistance / upper channel boundary)
Risk Management:
A break and close below 1.1533 would invalidate the bullish setup and signal potential bearish pressure returning to the pair.
EURUSD trade ideas
EURUSD bullish trend continuationDaily candle closed with strong bullish.
a healthy pullback observed earlier today during Asian & Europe session.
I'm expecting a bullish movement in US session.
i'm buying at current market price.
calculate your own risk & reward.
Good Luck
EUR/USD | Bullish Momentum Builds – Next Targets Ahead! (READ)By analyzing the EURUSD chart on the 4-hour timeframe, we can see that, as per the previous analysis, the price first made a strong move in two steps, successfully hitting the 1.15580 target. Upon reaching this key level, it reacted positively with increased demand and is now trading around 1.16520. Given the current trend, I expect further bullish movement soon, with the next potential targets at 1.16720, 1.17230, and 1.17500.
Please support me with your likes and comments to motivate me to share more analysis with you and share your opinion about the possible trend of this chart with me !
Best Regards , Arman Shaban

EURUSDI am thinking that a Wycoff pattern during a strong uptrend has formed up. I'll put a buy limit order here on 1H time frame and let it run and see what happens.

EURUSD"As you can see in this analysis, the price is moving within an ascending channel on the 15-minute timeframe. I expect the price to react in the area that I have marked in blue, and if I see appropriate candlestick patterns, I will enter a buy position."

EURUSD DAILY UPDATESAs the main trendline on daily timeframe breaks, with the impulsive push price upside and also it closes below the previous day high.
I personally short the idea, see chart above
this is not a financial advice.
you can have a short positions on monday open with stoploss on previous day of the highest wick candle.
This is only my view, I shared the 3hr timeframe. the idea is on Daily.
Goodluck..

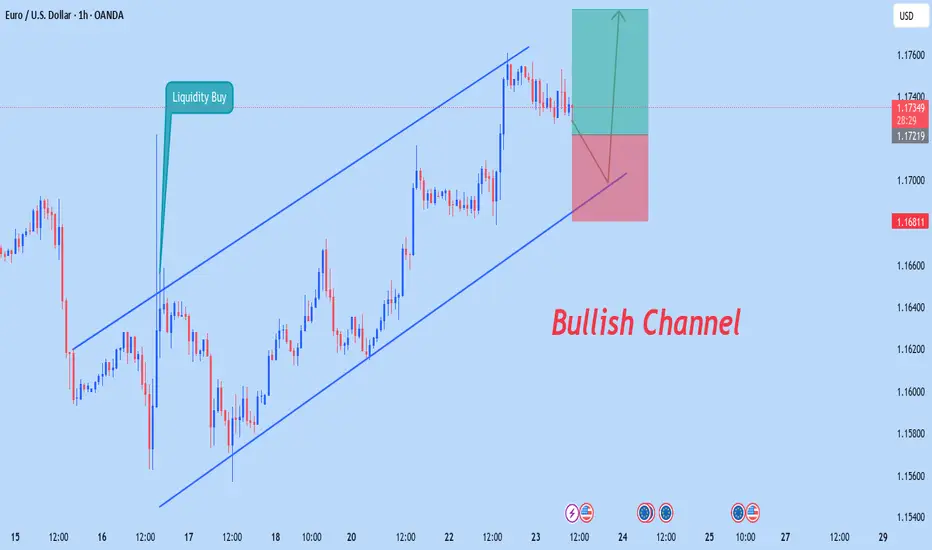
Eurusd Bullish StructureEurusd sjowing bullih channel lets try buy now @ 1.17346 with 200 pips target please follow money management use proper risk management always trade smarter not like a gambler stay grouped stay safe happy trading
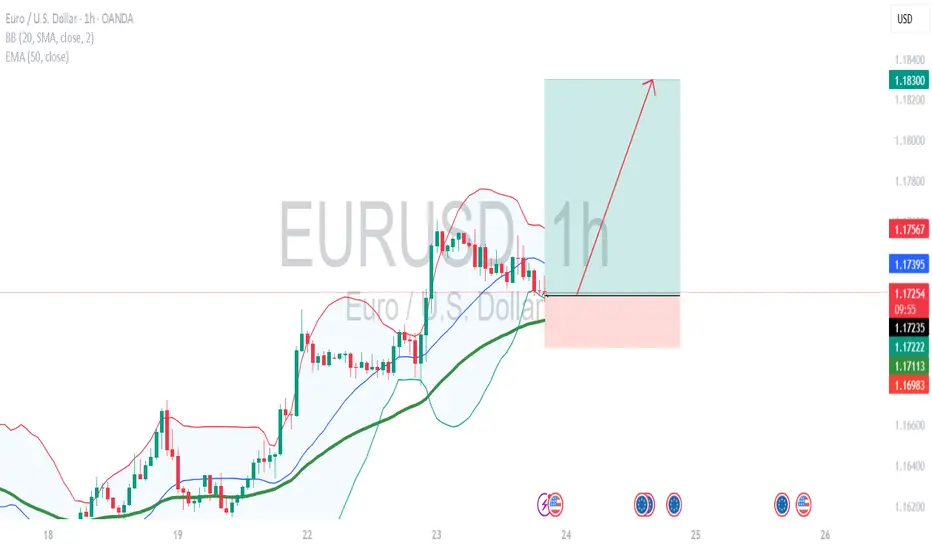
Euro Rallies Past 1.1750—Can the Uptrend Continue? EUR/USD surged above 1.1750 on easing trade tension. It hit an intraday low of 1.17604 and is currently trading around 1.117428. Overall trend remains bullish as long as support 1.1670 holds.
The pair is holding above the 55 EMA,above 200 EMA, and 365 EMA in the 1 -hour chart. Near-term resistance is seen at 1.1765, a break above this may push the pair to targets of 1.1800/1.1835/1.19090/1.1956/1.200. On the downside, support is seen at 1.1700; any violation below will drag the pair to 1.1670/1.1600/1.155.
Market Indicators and Trading Strategy
Commodity Channel Index (CCI)- Bullish
Average Directional Movement Index (ADX) - Neutral
It is good to buy on dips around 1.1720 with a stop-loss at 1.1665 for a target price of 1.1835.
Just looking for a big target, probably we will see big buyersTrends and legs are going to see high prices in most timeframes

EUR/USD || Correction || 1hr
💼 EUR/USD –🔻 Market Move
Timeframe: 30M | Broker: CMC | Brand: GreenFireForex™
Chart Type: Clean. Tactical. Smart Money meets Waves.
---
🔻 Correction Almost Done (Wave 5)
Classic Elliott 5-wave drop inside a bullish falling wedge.
The boys might be setting up a liquidity sweep before lift-off.
📉 Current Range: Grinding between 1.17334 – 1.17153
🕳️ Liquidity Below:
🩷 1.17158 (Mid OB)
🩶 1.17057 (Deep OB)
💜 1.16904 (Max Draw, SL sweep zone)
---
🚀 Upside Projections
🎯 TP1: 1.17253 (Quick scalp)
🧠 TP2: 1.17819 (Institutional Magnet)
---
🔫 Setup Mood:
🎯 Buy the Dip, don’t chase the breakout.
🧊 Let retail short the wedge, we buy into their fear.
🏎️ Risk-managed, sniper mode.
---
👑
"Liquidity funds lifestyle. Waves fund legacy."
---

EURUSD LONG AND EDUCATIONAL EXPLANATION ON SNIPER TRADESEUR/USD climbs to two-week tops around 1.1760
EUR/USD now gathers extra steam and advances to new two-week peaks around 1.1760 on Tuesday. The increasing selling pressure continues to hurt the US Dollar amid steady trade concerns and rising effervescence surrounding the Trump-Powell spat.


EUR/USD Update: Bullish Momentum Builds The euro just popped above $1.17 as optimism grows around a potential US-EU trade deal, following the recent US-Japan agreement. 📊
From a technical perspective:
• The euro found support at the April high of 1.1573, rebounding sharply — a strong sign that the bull trend is still intact. 🚀
• Next resistance levels to watch:
o 1.1830 – July’s high 📅
o 1.1850 – Top of a long-term channel from 2022 📈
o 1.2000 – The 200-month moving average, a major long-term target that often attracts price reaction 🔄
📌 Key takeaway: The path of least resistance remains to the upside, with momentum building toward 1.18+ in the near term.
Disclaimer:
The information posted on Trading View is for informative purposes and is not intended to constitute advice in any form, including but not limited to investment, accounting, tax, legal or regulatory advice. The information therefore has no regard to the specific investment objectives, financial situation or particular needs of any specific recipient. Opinions expressed are our current opinions as of the date appearing on Trading View only. All illustrations, forecasts or hypothetical data are for illustrative purposes only. The Society of Technical Analysts Ltd does not make representation that the information provided is appropriate for use in all jurisdictions or by all Investors or other potential Investors. Parties are therefore responsible for compliance with applicable local laws and regulations. The Society of Technical Analysts will not be held liable for any loss or damage resulting directly or indirectly from the use of any information on this site.

The dollar is still weak against the euroThe EURUSD has risen directly with the market opening without visiting the OB, which was a good area to buy,
but that's okay, we now know where its next target will be, which is to sweep the liquidity that is above the Trend line and then break the Main High.
An expected scenario may occur when this high is broken, which is SMT (divergence), and there will be a good selling entry with GBPUSD, but until now, we have not anticipated events until this break occurs.

EUR USD LONG RESULT Price had broken down the falling channel and held the the 4HTF Trendline Support and rejected twice already, so expect a third rejection from the indicated zone from which I entered the trade and It moved just as expected and TP Done ✅
_THE_KLASSIC_TRADER_.🙏🔥

EURUSD TECHNICAL ANALYSIS📊 EUR/USD Technical Analysis – July 23, 2025
The pair is currently respecting an ascending trendline on the 1H timeframe, showing bullish momentum after breaking previous highs. Price is consolidating just below a key resistance zone, suggesting a potential breakout or rejection scenario in the coming sessions.
🔍 Key Levels:
🔴 Resistance 1: 1.17607
🔴 Resistance 2: 1.18415
🟢 Support 1: 1.16793
🟢 Support 2: 1.15983
✅ Bullish Scenario:
If price holds above the ascending trendline and breaks above the 1.17607 resistance zone with strong volume, we could see a continuation towards the next resistance at 1.18415. A bullish breakout with a retest offers a buy opportunity, targeting the higher resistance level with a stop below the trendline.
Buy Entry Idea:
Entry: After breakout and retest of 1.17607
TP: 1.18415
SL: Below 1.17250
❌ Bearish Scenario:
If price fails to hold above the trendline and breaks below 1.16793, it may signal a shift in momentum. In that case, a sell opportunity could emerge on the retest of broken support, targeting the next support level at 1.15983.
Sell Entry Idea:
Entry: Below 1.16793 after confirmation
TP: 1.15983
SL: Above 1.17000
💡Conclusion:
EUR/USD is currently at a key decision point. Traders should wait for a confirmed breakout in either direction before entering. Monitor volume and price action around the resistance and trendline area for the best setup.
📌 Always manage your risk and stick to your trading plan.
#EURUSD #ForexAnalysis #TradingSetup #PriceAction #SupportResistance #FXSMART

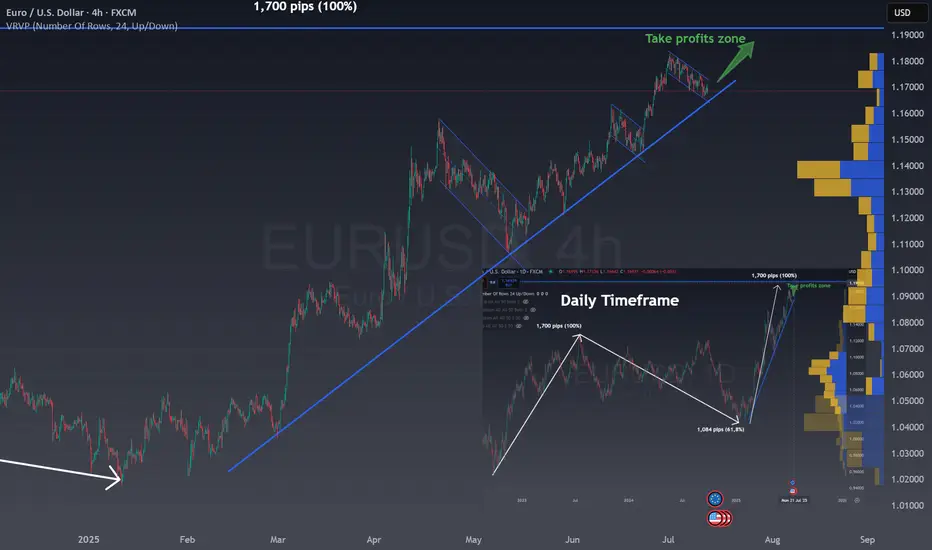
One last rally in EUR/USDIn the right bottom you can see the Daily chart for EUR/USD:
The chart shows the EUR/USD on a daily timeframe.
There was an initial strong rise of 1,700 pips, marked as a 100% move.
After this, the price corrected downward by 1,084 pips, which is 61.8% of the previous rise.
The 61.8% retracement is a common Fibonacci level, often signaling a reversal or pause.
Now, the price is moving up again, following a similar path as the first rise.
The chart suggests a possible new upward move of another 1,700 pips (100%).
A "take profits zone" is marked at the top, indicating a target area for traders.
This pattern reflects how markets often move in waves: trend, correction, and trend continuation.
Fibonacci levels help traders identify potential reversal points.
The chart is used to project future moves based on past price behavior.
The MAIN CHART shows a clear uptrend for EURUSD and the current correction with a flag.
The combination of both patterns give us a clear BUY zone in the channel and using the trend as support or once the channel break upwards.
This is a very good risk reward ratio trade situation where all traders should be!
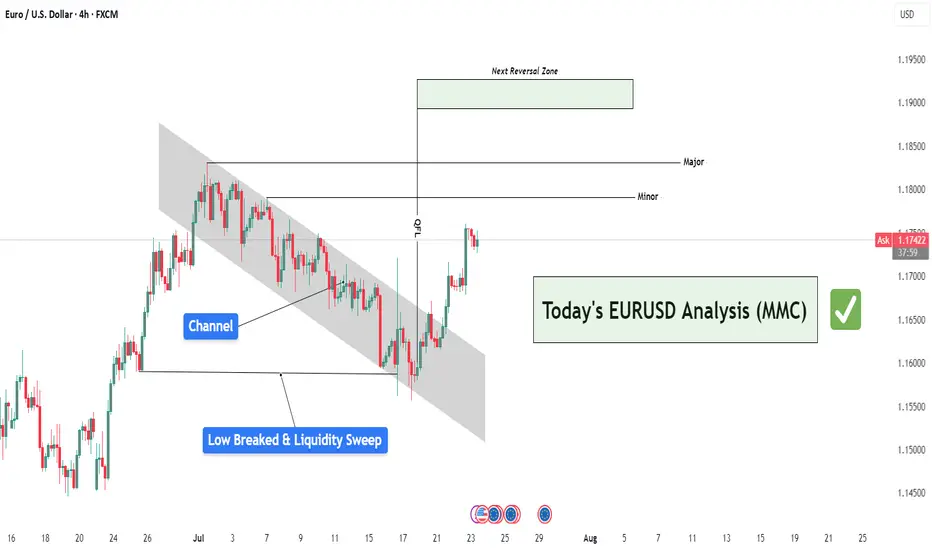
EURUSD Analysis : Liquidity Sweep – EURUSD Targets TO Reversal🧠 Institutional Context & Big Picture
EURUSD has been in a tightly controlled descending channel for several weeks—a classic sign of a market being engineered for liquidity collection. Rather than a naturally trending bearish market, this price action reflects stealth accumulation and market maker manipulation.
The channel structure was used to:
Establish a visible bearish trend (to trap sellers)
Trigger emotional bias for continued shorting
Build up stop orders below swing lows
This phase was about building energy, not continuation.
🔍 Detailed Breakdown of the Chart Elements
📌 1. Descending Channel – Controlled Manipulation
The pair moved within a well-defined bearish channel for multiple weeks.
Each touch respected the top and bottom perfectly—not random, but institutional structure.
It fostered retail confidence in the downtrend while market makers prepared for a reversal.
💥 2. Liquidity Sweep & Trap (Low Breaked & Liquidity Grabbed)
Price spiked below the previous low, clearly sweeping liquidity on July 21.
This is the "engineered breakdown", meant to trigger breakout sellers and stop out early longs.
Immediately after the sweep, the price violently reversed—clear evidence of a liquidity trap.
This is classic MMC logic: induce, trap, reverse.
🟩 3. QFL Base Formed – Bullish Engine Ignited
At the point of reversal, the chart shows the formation of a QFL (Qualified Liquidation Failure) zone.
This QFL base is the core of smart money accumulation—price broke below a base, then quickly reclaimed it.
It's not just support—it’s the true origin of the reversal and an optimal entry point.
📈 4. Breakout from the Channel – Structure Shift Confirmed
Price broke out of the descending channel with strong momentum, confirming:
Structure shift from lower lows → higher highs
Momentum shift in favor of bulls
Entry confirmation for MMC-based long setups
This breakout invalidates the bearish trend and signals a fresh leg up, likely toward unmitigated supply zones.
🟨 5. Current Price Action – Healthy Bullish Consolidation
After the breakout, price is consolidating just above the broken channel, forming a mini-flag or base.
This indicates:
Smart money is accumulating more
No significant selling pressure
Likely continuation toward next supply
🎯 6. Next Targets – Reversal Zones
Minor Resistance: ~1.1800
Major Resistance: ~1.1850 – 1.1880
Next Reversal Zone: 1.1900–1.1950
This zone is highlighted as a potential sell-off area where institutions may offload positions or create new traps.
Watch for signs of exhaustion or redistribution here.
📌 Trade Plan Based on MMC Structure
✅ Bullish Scenario (Currently Active)
Entry Area: Ideally at QFL base or breakout retest (~1.1700–1.1720 zone)
Confirmation: Bullish price action (engulfing, flag break, or liquidity wick)
Targets:
🎯 TP1: 1.1800
🎯 TP2: 1.1850
🎯 TP3: 1.1950 (Reversal Supply Zone)
❌ Invalidation:
A break below the QFL base (~1.1670) with bearish volume would invalidate the bullish MMC structure.
🧠 Smart Money Insight & Logic Recap
This entire move reflects a classic Market Maker Strategy:
Build a trend (descending channel) to shape trader bias
Trigger liquidity events (false breakdown)
Accumulate at the lows via QFL logic
Shift structure (channel breakout)
Target unfilled institutional supply (1.1850–1.1950)
This isn’t random—it’s engineered movement. Your job as a trader is to identify footprints, not follow the crowd.
Euro Steady at $1.17 as ECB Holds FireThe euro hovered near $1.17 as traders awaited Thursday’s European Central Bank decision. With rates expected to remain steady following eight consecutive cuts, policymakers tread cautiously amid strength in the euro and lingering U.S. tariff uncertainty. Meanwhile, EU officials are preparing contingency plans in case trade negotiations with President Trump collapse before the August 1 deadline.
Resistance for the pair is at 1.1830, while support is at 1.1660.
DeGRAM | EURUSD in the consolidation zone📊 Technical Analysis
● Price broke the month-long bearish channel and is now basing inside the 1.165-1.169 consolidation block; repeated intraday retests (blue zone) turn the former cap into fresh support.
● A steep hourly up-sloper is carving successive higher-lows; its width and the prior channel depth project follow-through toward 1.1745 (mid-July pivot) with room to the next swing line at 1.1800.
💡 Fundamental Analysis
● FXStreet highlights softer US PMIs and a pull-back in 2-yr yields, while ECB sources flag “data-dependent patience” rather than imminent cuts—narrowing the short-rate gap and favouring the euro.
✨ Summary
Long 1.1650-1.1680; hold above the blue base targets 1.1745 ➜ 1.1800. Long view void on an H1 close below 1.1615.
-------------------
Share your opinion in the comments and support the idea with a like. Thanks for your support!

EURUSD - Price ActionYesterday’s accumulation phase pushed the market to new highs 📈, with a top forming at 1.17605. After the price pullback during the Asian session, it appears that London used the opportunity to enter short positions, potentially forming a distribution range.
As long as we remain above the vWAP from yesterday’s accumulation, I still see a possibility for a continued move to the upside 🚀
The next key level where I’ll be watching for long entries is the demand zone supported by vWAP around 1.16940 📊
👉 Follow me for more EUR/USD trade ideas, market updates. 💼
I share structured analysis every Monday and Wednesday to help you stay aligned with the market 🗓️📊

EUR/USD PROBABLY!Waiting for confirmation on candles and Real Volume 5min or 15min (power of Real Volume)-without real volume I am like a blind man in a dense forest :)
Tools:
- real volume (proper interpretation)
- Fibonacci expansion ABC (an additional, new goal every day)
- Fibonacci retracement (combined with the real volume, it shows me the real probable movement for the next hours and days)
- volume support and resistance levels (confirmation of the price recovery level)
- oversold/overbought index (focusing on 1H and 4H something is already overvalued or undervalued)
- candlestick patterns (my entry point for 5 minutes or 15 minutes candlestick formations confirmed by particularly increasing volume).

EURUSD Will Move Higher! Long!
Here is our detailed technical review for EURUSD.
Time Frame: 9h
Current Trend: Bullish
Sentiment: Oversold (based on 7-period RSI)
Forecast: Bullish
The market is testing a major horizontal structure 1.174.
Taking into consideration the structure & trend analysis, I believe that the market will reach 1.184 level soon.
P.S
Overbought describes a period of time where there has been a significant and consistent upward move in price over a period of time without much pullback.
Disclosure: I am part of Trade Nation's Influencer program and receive a monthly fee for using their TradingView charts in my analysis.
Like and subscribe and comment my ideas if you enjoy them!
