EURUSD M30 I Bearish Drop Based on the M30 chart analysis, we can see that the price is testing our sell entry at 1.1736, which is an overlap resistance.
Our take profit will be at 1.1712 a pullback support level.
The stop loss will be placed at 1.1768, which is above a swing high resistance level.
High Risk Investment Warning
Trading Forex/CFDs on margin carries a high level of risk and may not be suitable for all investors. Leverage can work against you.
Stratos Markets Limited (tradu.com ):
CFDs are complex instruments and come with a high risk of losing money rapidly due to leverage. 66% of retail investor accounts lose money when trading CFDs with this provider. You should consider whether you understand how CFDs work and whether you can afford to take the high risk of losing your money.
Stratos Europe Ltd (tradu.com ):
CFDs are complex instruments and come with a high risk of losing money rapidly due to leverage. 66% of retail investor accounts lose money when trading CFDs with this provider. You should consider whether you understand how CFDs work and whether you can afford to take the high risk of losing your money.
Stratos Global LLC (tradu.com ):
Losses can exceed deposits.
Please be advised that the information presented on TradingView is provided to Tradu (‘Company’, ‘we’) by a third-party provider (‘TFA Global Pte Ltd’). Please be reminded that you are solely responsible for the trading decisions on your account. There is a very high degree of risk involved in trading. Any information and/or content is intended entirely for research, educational and informational purposes only and does not constitute investment or consultation advice or investment strategy. The information is not tailored to the investment needs of any specific person and therefore does not involve a consideration of any of the investment objectives, financial situation or needs of any viewer that may receive it. Kindly also note that past performance is not a reliable indicator of future results. Actual results may differ materially from those anticipated in forward-looking or past performance statements. We assume no liability as to the accuracy or completeness of any of the information and/or content provided herein and the Company cannot be held responsible for any omission, mistake nor for any loss or damage including without limitation to any loss of profit which may arise from reliance on any information supplied by TFA Global Pte Ltd.
The speaker(s) is neither an employee, agent nor representative of Tradu and is therefore acting independently. The opinions given are their own, constitute general market commentary, and do not constitute the opinion or advice of Tradu or any form of personal or investment advice. Tradu neither endorses nor guarantees offerings of third-party speakers, nor is Tradu responsible for the content, veracity or opinions of third-party speakers, presenters or participants.
EURUSD trade ideas

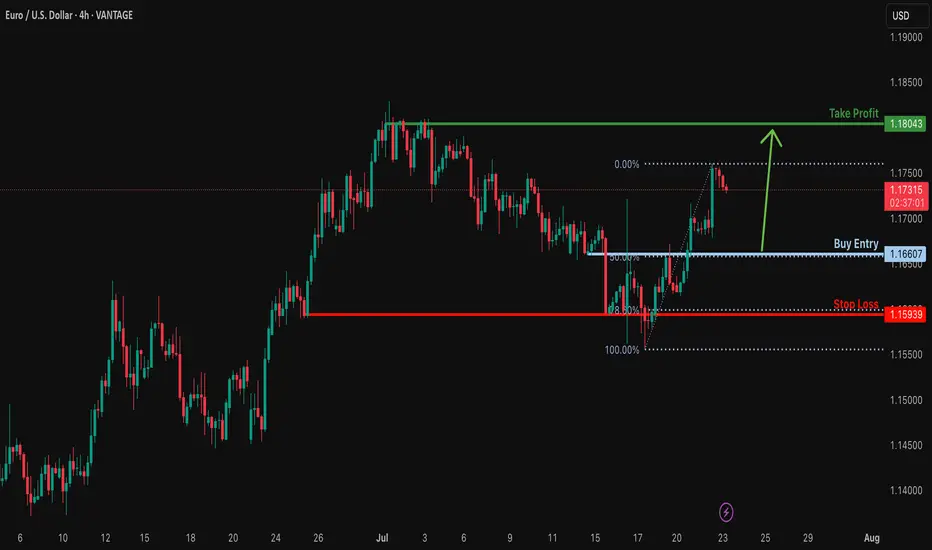
Bullish bounce?EUR/USD is falling towards the support level which is a pullback support that aligns with the 50% Fibonacci retracement and could bounce to from this level to our take profit.
Entry: 1.1660
Why we like it:
There is a pullback support that lines up with the 50% Fibonacci retracement.
Stop loss: 1.1593
Why we like it:
There is a multi swing low support that is slightly below the 78.6% Fibonacci retracement.
Take profit: 1.1813
Why we like it:
There is a swing high resistance.
Enjoying your TradingView experience? Review us!
Please be advised that the information presented on TradingView is provided to Vantage (‘Vantage Global Limited’, ‘we’) by a third-party provider (‘Everest Fortune Group’). Please be reminded that you are solely responsible for the trading decisions on your account. There is a very high degree of risk involved in trading. Any information and/or content is intended entirely for research, educational and informational purposes only and does not constitute investment or consultation advice or investment strategy. The information is not tailored to the investment needs of any specific person and therefore does not involve a consideration of any of the investment objectives, financial situation or needs of any viewer that may receive it. Kindly also note that past performance is not a reliable indicator of future results. Actual results may differ materially from those anticipated in forward-looking or past performance statements. We assume no liability as to the accuracy or completeness of any of the information and/or content provided herein and the Company cannot be held responsible for any omission, mistake nor for any loss or damage including without limitation to any loss of profit which may arise from reliance on any information supplied by Everest Fortune Group.
EUR/USD Elliott Wave Update –Classic Wave 5 Breakout OpportunityThis chart of the EUR/USD pair shows a well-structured Elliott Wave impulse pattern unfolding on the 4-hour timeframe. The price action is currently progressing in the final Wave (5) of the impulse cycle, which typically represents the last bullish leg before a larger correction begins.
Wave (1): The initial move up from the bottom (early May), showing a clean 5-wave internal structure.
Wave (2): A healthy retracement after Wave 1, forming a base for further upside.
Wave (3): The strongest and steepest rally, as expected in Elliott theory. It broke past previous highs and extended sharply.
Wave (4): A corrective phase that formed a falling wedge pattern — typically a bullish continuation pattern.
Wave (5): Currently in progress. The wedge has broken to the upside, confirming the potential start of Wave 5.
Target 1 (T1): 1.18306
Target 2 (T2): 1.19012
Stop Loss (SL): 1.16600
After a strong uptrend, the market went sideways in a wedge pattern (a typical wave 4 behavior). It has now broken out, signaling the start of the final wave 5 move. This is often a strong and sharp push. Since the breakout is clean and the Elliott wave count aligns well, this creates a favorable long opportunity

Short-Term Pullback Within a Bullish Higher Timeframe StructureHey Traders, hope you're all doing well! 👋
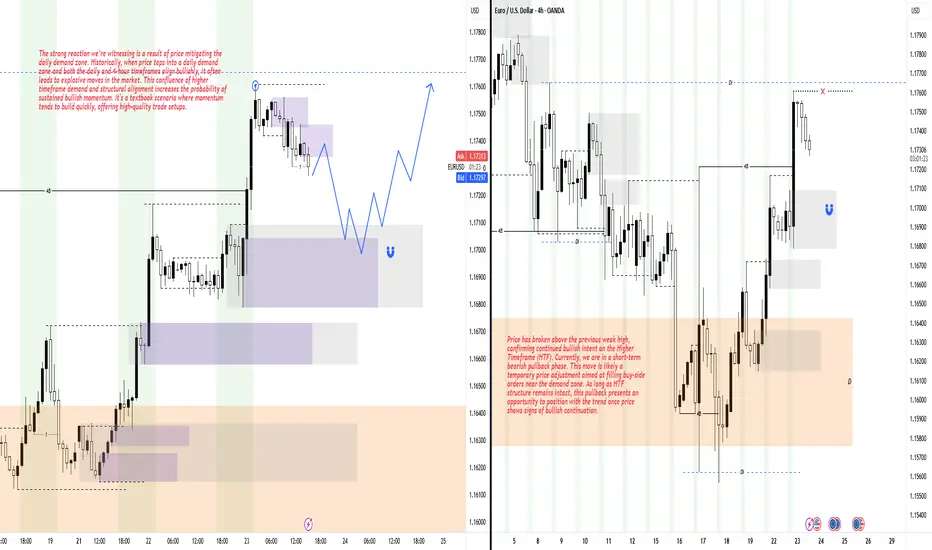
Price has recently broken above the previous weak high, showing strong bullish momentum. At the moment, we're seeing a short-term bearish pullback — a common market behavior aimed at filling buy orders near the demand zone.
Despite this minor retracement, the Higher Timeframe (HTF) remains firmly bullish. As long as that structure holds, this pullback could present a solid opportunity to rejoin the trend. Wait for bullish confirmation before executing any entries to stay aligned with the prevailing market direction.
EUR/USD – The Cleanest Buy Setup This Quarter
Channel respecting every pivot.
Liquidity beneath – Smart Money needs fuel.
This is not an entry.
This is a precision blueprint.
🔹 Tap into the demand zones at 1.15824 or 1.13862, and ride the next impulse to 1.19614+
Wave D correction underway.
Wave E coming to steal the spotlight.
🧠 Elliott wave structure. Liquidity mapping. Channel geometry.
You’re either chasing price... or anticipating it. I prefer the second.
📍Forex | Where Price Meets Purpose
—
#EURUSDSetup | #WaveEIncoming | #SmartMoneyMoves | #ForexBlueprint | Forex | Trading | #InstitutionalFlow | #LiquidityHunt
---

Take profit on EURUSD buy now and sell once from here Take profit on our EURUSD trade now and sell from this position

EURUSD on the riseYesterday, EURUSD broke through the 1,1720 resistance level with strong momentum.
This confirms the uptrend and opens up opportunities for buying.
The ECB is set to announce interest rates tomorrow, which could trigger increased market volatility.
Keep an eye out for higher lows and signs of the uptrend continuing.

EUR/USD neutral: Proceed with cautionHello traders
My short was short lived and not too damaging.
This powerful EUR/USD bounce is not unusual but perhaps a little bit of a head scratcher.
No economic data of note.
Maybe some positioning before the ECB rate decision?
I don't know what time this morning Senator Mike Lee(R) of Utah decided it was a good idea to repost a clearly fake resignation letter from Chairman Jerome Powell on X, so perhaps that was a factor.
Once again, Scott Bessent calmed the markets by stating that he does not see any reason for Chair Powell to resign.
The technical picture is clear. The pair has broken and closed above a long term downtrend line/channel but is at the upper boundary of the short term channel.
I have noticed several ideas and minds looking for a decline to 1.1450. The intersection of the up and downtrend lines identifies that as a possible level to go long.
However, I take it one day at a time and I am generally hesitant to make long term predictions, so use your own best judgment.
The current economic environment is rife with uncertainty, so keep the risk small. To diversify,
I have been looking for potential growth stocks to dip my toes back into the stock market.
JOBY or ACHR anyone?
Best of luck

EU London Protocol, Bread & ButterOn this quick video I share my past trade I took using the London protocol. And the anticipation of the next day and how I will look to take my setup, if it will form.

Already LONG EURUSD, come join the party !Come join the party and bring the USD down, haha.
This is the 4H chart and the day is still showing a bullish trend.
Please DYODD

2025.07.22 LONG EURUSDThis is a long trade on EURUSD utilizing smart money concepts.
There are multiple areas of liquidity pooling above, and now that trendline liquidity has been broken, trade management parameters are in place.
Orders have been transmitted, and this is a swing trade potentially lasting 4-8 weeks.
happy trading all
-kevin

Dollar dips as politics cloud Fed picture | FX ResearchThe dollar extended its slide on Tuesday, weighed down by soft US regional data and renewed political pressure on the Fed, reinforcing the market's dovish bias. The Richmond Fed manufacturing index plunged to -20, far below expectations, while business conditions and the Philly Fed survey showed slight improvements but remained in contractionary territory.
Treasury Secretary Bessant added to the day's drama with mixed messaging, praising Fed Chair Powell's capabilities while simultaneously calling for an internal review and pressing for rate cuts, aligning with President Trump's stance that rates should be 300 basis points lower.
Trade headlines added to the noise with Bessant signaling a hard August 1 deadline for trade talks and Trump announcing a new deal with Indonesia, albeit one that still includes steep tariffs.
With the Fed in blackout mode ahead of its next meeting, markets are left to navigate a fog of political theatrics and economic uncertainty. The euro climbed to near one-month highs as the dollar softened. And traders now turn to upcoming US data and a heavy Treasury supply schedule for further direction.
Exclusive FX research from LMAX Group Market Strategist, Joel Kruger

Could the Fiber reverse from here?The price is rising towards the pivot which is a pullback resistance and could reverse to the 1st support.
Pivot: 1.1812
1st Support: 1.1608
1st Resistance: 1.1903
Risk Warning:
Trading Forex and CFDs carries a high level of risk to your capital and you should only trade with money you can afford to lose. Trading Forex and CFDs may not be suitable for all investors, so please ensure that you fully understand the risks involved and seek independent advice if necessary.
Disclaimer:
The above opinions given constitute general market commentary, and do not constitute the opinion or advice of IC Markets or any form of personal or investment advice.
Any opinions, news, research, analyses, prices, other information, or links to third-party sites contained on this website are provided on an "as-is" basis, are intended only to be informative, is not an advice nor a recommendation, nor research, or a record of our trading prices, or an offer of, or solicitation for a transaction in any financial instrument and thus should not be treated as such. The information provided does not involve any specific investment objectives, financial situation and needs of any specific person who may receive it. Please be aware, that past performance is not a reliable indicator of future performance and/or results. Past Performance or Forward-looking scenarios based upon the reasonable beliefs of the third-party provider are not a guarantee of future performance. Actual results may differ materially from those anticipated in forward-looking or past performance statements. IC Markets makes no representation or warranty and assumes no liability as to the accuracy or completeness of the information provided, nor any loss arising from any investment based on a recommendation, forecast or any information supplied by any third-party.

EUR/USD 6E Futures Risk Management: Navigating Macro Divergence As Risk Manager at WaverVanir International, I’m constantly evaluating asymmetrical setups where macroeconomic divergence aligns with technical structure. The current EUR/USD trade is one such instance—an evolving case of volatility compression within a descending triangle, positioned beneath key resistance at 1.1730.
🔻 Bias: Bearish
🧮 Structure: Daily lower highs + descending triangle
📉 Key Break Level: 1.1612 (horizontal support)
⚠️ Invalidation: Daily close above 1.1730
📊 Probability: 65% likelihood of downside continuation into August, driven by USD real yield strength and ECB rate path lag
We’re managing this trade with dynamic risk protocols:
🔐 Option hedge overlay for tail protection
🎛️ Exposure throttle post-FOMC volatility
💡 VolanX protocol flags 1.1530 and 1.1360 as likely liquidity pools if 1.1612 gives out
🧠 Remember: It's not about being right—it's about being protected when wrong.
—
This post is part of our ongoing commitment to transparency, system-level discipline, and volatility-aware macro execution.
#WaverVanir #VolanXProtocol #MacroTrading #RiskManagement #6EFutures #EURUSD #OptionsFlow #InstitutionalTrading #ForexStrategy


EURUSD: Mid-Term Analysis💶 EURUSD Analysis
The blue boxes under liquidity look good.
📍 The Plan
If price moves into these blue boxes:
✅ Watch for footprint absorption (buyers stepping in)
✅ Look for CDV support or bullish divergence
✅ Wait for a structure reclaim to confirm entry
⚡ Why This Matters
No chasing. No guessing.
These zones are where I’m interested if the market wants to give an opportunity.
🎯 Action Point
If signals align, I will consider a risk-managed long.
If not, I am fine waiting.
Patience and clarity. The right price, or no trade.

Why EUR/USD Dropped: A Step-by-Step Breakdown for Learners📉 Overview:
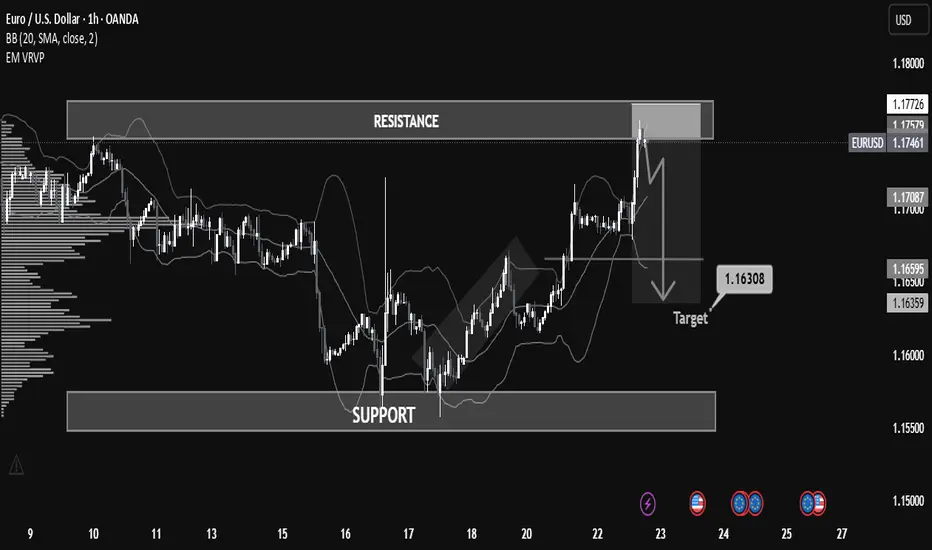
The EUR/USD has recently approached a key resistance zone near 1.17726, showing signs of a potential rejection after a bullish rally. The price is currently hovering around 1.17468, forming a short-term bearish setup that could lead to a retracement or reversal.
⸻
⚙ Key Technical Zones:
• 🔼 Resistance: 1.17500 – 1.17726
Price was strongly rejected after testing this area. This level has historically acted as a supply zone.
• 🔽 Support: 1.15500 – 1.16000
This is a historically significant demand zone, where price previously consolidated and reversed.
• 🎯 Target Zone: 1.16308
Marked as a potential take-profit level based on prior price structure and volume profile imbalance.
⸻
🧠 Indicators & Tools:
• Bollinger Bands: Price touched the upper band in overbought conditions, suggesting a possible mean reversion.
• Volume Profile (VRVP): Indicates declining volume near resistance, pointing to weak buyer momentum.
• Price Action: Bearish engulfing candle and strong rejection wick at resistance, confirming selling pressure.
⸻
🧭 Market Bias:
📌 Short-Term Bearish
A short opportunity is forming based on the rejection from resistance and overextension of price.
⸻
🧩 Possible Scenario:
1. Breakdown below 1.17061 (mid-level support) could trigger acceleration to the downside.
2. 1.16500 and 1.16308 are ideal short targets before reevaluation for continuation or bounce.
⸻
🛑 Risk Management Tips:
• Consider SL above 1.17800 (previous high).
• Monitor for confirmation before entry (e.g., bearish candle close below 1.17000).
• Adjust size and risk-reward ratio appropriately.
"EUR/USD Technical Blueprint: Bullish Continuation EUR/USD Technical Blueprint: Bullish Continuation Patterns and Strategic Price Zones Explained
🔹 Market Structure & Trend
The chart shows a clear shift from a ranging phase into a bullish breakout:
Price previously consolidated in a broad horizontal channel, with a strong demand zone (support) established between 1.16000 – 1.16600.
Following a deep liquidity grab on July 17-18, the price bounced sharply from support, creating higher highs and higher lows – a classic bullish structure.
Current momentum shows bullish continuation, as the price broke above local resistance around 1.16645 and is now forming a potential bull flag or bullish pennant pattern.
🟢 Bullish Momentum Confirmation
Price is currently retesting the broken resistance (now acting as support at 1.16645).
If the support holds and bullish momentum continues, the measured move target projects a price move toward 1.17331, the next significant resistance level.
This is also supported by increased volume activity in the breakout zone, as seen on the VPVR.
📊 Key Technical Levels
Level Type Description
1.16000 Major Support Historical demand zone + liquidity grab
1.16645 Support Zone Previous resistance, now retest area
1.16926 Current Price Bullish consolidation forming
1.17331 Resistance Bullish target based on breakout projection
1.17700+ Extension Potential continuation level if momentum persists
🧠 Volume & Volatility Insight
Bollinger Bands are expanding post-breakout, indicating increasing volatility and a potential trend continuation.
VPVR shows a high-volume node around 1.166, confirming it as a strong demand zone.
🔎 Outlook & Strategy
✅ Bullish Bias
As long as the price remains above 1.16645, buying dips could be a favorable strategy.
A break above 1.17000 with strong volume could open a path toward 1.1733 and higher.
❌ Invalidation Level
A strong close below 1.16600 would invalidate the bullish setup and could return price to the lower support around 1.16000.
📌 Conclusion
EUR/USD is displaying strong bullish momentum after breaking a key resistance level and forming a solid support base. A breakout above 1.17000 may lead to a continuation toward 1.17331 and potentially higher. This setup favors bullish positioning with tight risk management.

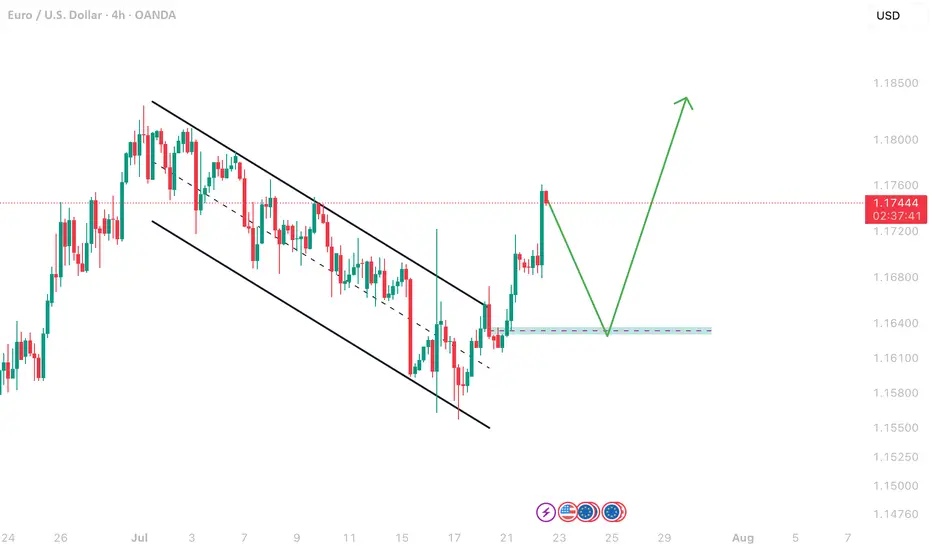
EURUSD Channel TradeAs you can see EU trading inside a channel and next predicted move can be possible retest and go again upside.
EURUSD Long Swing FX:EURUSD price had stopped falling and I was waiting for bullish volume to kick inn, initial bullish volume started jumping inn, so taking long now.
With my back testing of this strategy, it hits multiple possible take profits, manage your position accordingly.
I manage trade on daily basis.
Use proper risk management
Looks like good trade.
Lets monitor.
Use proper risk management.
Disclaimer: only idea, not advice

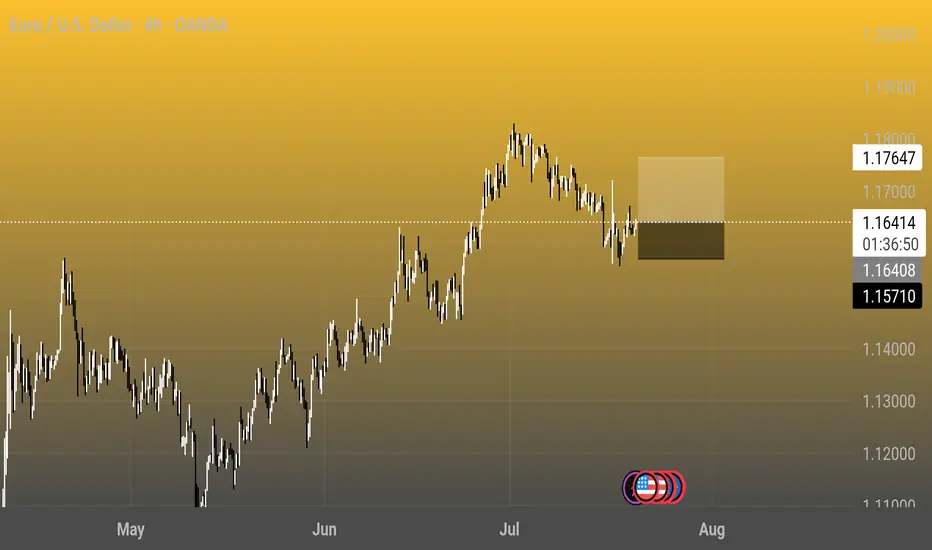
Euro / U.S. Dollar 4h Chart - OANDA4-hour candlestick chart showing the exchange rate between the Euro (EUR) and the U.S. Dollar (USD) from May to August 2025. The current rate is 1.16416, with a 0.14% increase (+0.00161). The chart highlights a peak around late June to early July, followed by a decline, with notable support and resistance levels marked at 1.17647 and 1.16416, respectively.
EURUSD| Back Aligned Bullish - Still in Analysis ModePair: EURUSD
Bias: Bullish
Following price closely and adapting to the market’s rhythm.
Recent structure showed that price is still respecting last week’s key zones — so I’ve realigned with the bullish bias accordingly.
No entries yet — still in analysis mode, which honestly is the best part 😉
Watching for clean LTF confirmations before engaging. No guessing. No forcing.
Price always tells the truth — you just gotta stay patient enough to listen.
#EURUSD #SMC #bullishbias #marketstructure #inducementking #smartmoneyflow
Bless Trading!

EURUSD Bearish Sentiments Below LowEURUSD looks bearish at H1 for a bias of 1.15377. It's an unusual price action; the overall trend in a higher time frame is bullish, but the 1.1700 had strong bearish pressure.
The current momentum is bearish below 1.16625, making that level a key area zone.
Happy Trading,
K.
