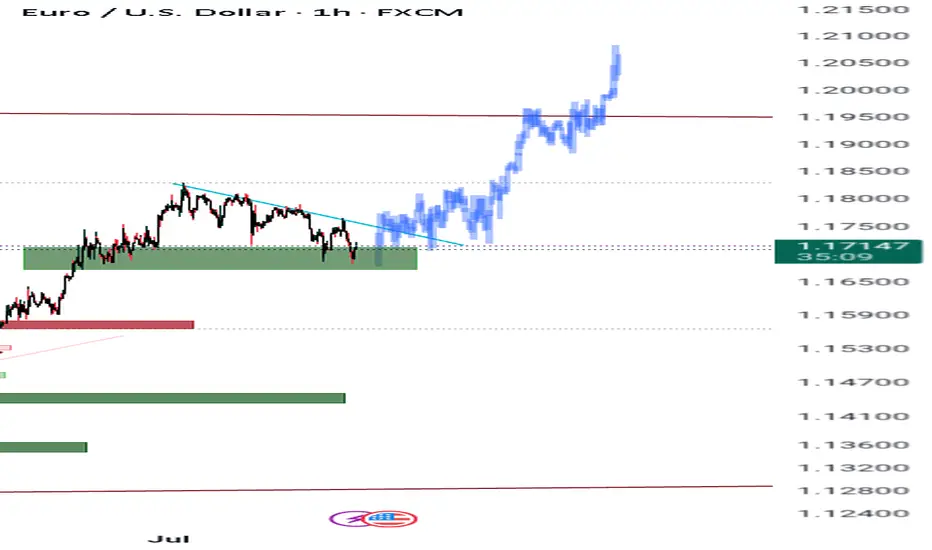
EURUSD about to fully my prophetic analysis hey guys ..hope y'all remember what i told y'all about this pair and where its heading to ...how its going for the monthly trend line when it breaks -61.8...so hopefully its going to play out soon ...what you see on the chart is what it is ...clear as day ... once it breaks that trendline to the upside,wait for a retest and we gonna ride to the moon ...but trust me on this 90% .... Trading is a game of probabilities
EURUSD trade ideas
30M Insight: EURUSD Buy Limit ReadyGood Mornıng Traders;☀️
Based on a 30-minute analysis, I’ve identified a shift in EURUSD market structure. I’ll be waiting for price to reach my level with a buy limit order.
📥 BUY LIMIT ORDER: 1.17180
🛑 STOP LOSS: 1.16946
🎯 TP1: 1.17275
🎯 TP2: 1.17412
🎯 TP3: 1.17649
📊 Risk / Reward Ratio: 2.00
Patience meets precision. Let the market come to you.
🧠 Master your mindset with iron discipline.
Never fear the trade—let the trade fear you.
Keep your motivation high and your focus sharper than ever.
-----
Your likes and support are what keep me motivated to share these analyses consistently.
Huge thanks to everyone who shows love and appreciation! 🙏

EURUSD: Absolute Price Collapse Ahead! Short!
My dear friends,
Today we will analyse EURUSD together☺️
The recent price action suggests a shift in mid-term momentum. A break below the current local range around 1.17083 will confirm the new direction downwards with the target being the next key level of 1.16863.and a reconvened placement of a stop-loss beyond the range.
❤️Sending you lots of Love and Hugs❤️

EURO to see a MAJOR DECLINE as US$ RALLIES The chart posted is that of the Euro as you can see the targets based on fib relationship was just seen ! I have moved LONG DXY 96.70 and will remain Long dxy until I see an ALT otherwise the DXY should rally into OCT 10th best of trades WAVETIMER

Lingrid | EURUSD Bullish Trend ContinuesFX:EURUSD is holding a bullish structure inside an upward channel after bouncing from the 1.1670 demand zone. The current retracement appears corrective, and buyers may step in again near the confluence of the trendline and horizontal support. If confirmed, the price is expected to push toward the 1.1885 resistance and the upper channel target at 1.1900.
📈 Key Levels
Buy zone: 1.1650–1.1680 (trendline + key support)
Sell trigger: break below 1.1600
Target: 1.1885 – 1.1900 zone
Buy trigger: bullish reversal candle near 1.1700
💡 Risks
Failure to hold trendline support could lead to deeper retracement
1.1885 may cap upside if momentum fades
Bearish divergence could emerge if price surges too fast
If this idea resonates with you or you have your own opinion, traders, hit the comments. I’m excited to read your thoughts!


EURUSD Will Go Down!
HI,Traders !
#EURUSD is making a
Bullish rebound after a
Bearish breakout but the
Pair will soon hit a new
Horizontal resistance
Of 1.17489 from where
We will be expecting a
Further move down !
Comment and subscribe to help us grow !

EUR/USD 2-Hour Chart - OANDA2-hour performance of the Euro/U.S. Dollar (EUR/USD) currency pair on the OANDA platform as of July 08, 2025. The current exchange rate is 1.17365, reflecting a 0.24% increase (+0.00279). The chart includes a recent sharp decline highlighted in a shaded area, with buy and sell signals at 1.17375 and 1.17357 respectively. Key price levels are marked, ranging from 1.1500 to 1.1850, with a focus on the recent market movement.

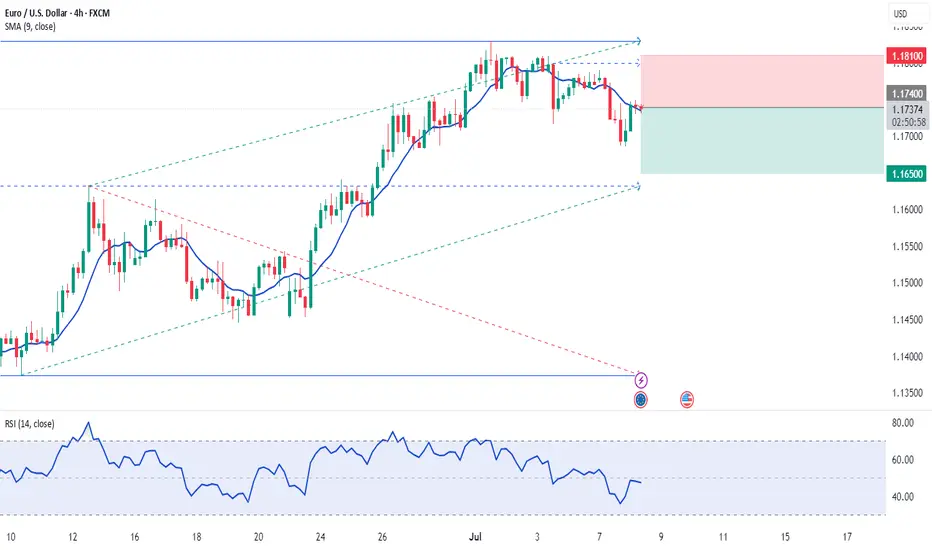
EURUSD is moving within the 1.16850 -1.18310 range👀 Possible scenario:
The euro (EUR) dropped 0.6% on July 7 amid rising trade tensions and fading hopes for near-term rate cuts by the Federal Reserve. Market sentiment turned cautious after U.S. President Donald Trump announced new tariffs targeting 14 countries without trade deals, raising concerns over global trade disruption.
Major exporters like Japan and South Korea could face 25% tariffs if deals aren’t reached, while nations aligning with BRICS risk an extra 10% duty. With a quiet economic calendar on July 8, market volatility may ease, though investors remain alert to any trade policy shifts that could spark renewed market reaction.
✅Support and Resistance Levels
Now, the support level is located at 1.16850
Resistance level is located at 1.18310

EUR/USD💰Symbol: { EUR/USD }
🟩Price: { 1.17141 }
🟥Stop: { 1.17642 }
1️⃣profit: { 1.17175 }
2️⃣profit: { 1.16865 }
3️⃣profit: { 1.16338 }
📊Check your chart before entering.
🚨Check before use to make sure there is no important news.🚨

EUR/USD Slides Below 1.1720 - Dovish Euro Data and Hawkish FedThe euro continued to retreat against the U.S. dollar in Tuesday’s European session, with FOREXCOM:EURUSD falling to 1.17163, pressured by weakening Eurozone fundamentals and renewed U.S. dollar strength.
Technically, the pair has broken below a short-term support zone around 1.1745, marking a clear shift toward bearish momentum. Price action on the 4-hour chart shows a rejection from the 1.1773 resistance zone last week, forming a descending pattern as sellers gained control. Multiple indicators confirm the downward bias.
The MACD (19,39,29) and MACD (12,26,9) are both printing bearish crossovers, with declining histograms indicating increasing downside momentum. Meanwhile, the JoeChalhoub_FXForecaster V1, a custom indicator, shows fading bullish pressure with histogram bars turning pink and gradually weakening. The non-repainting version supports the same trend, reflecting reduced bullish participation.
Adding to the technical signals, the OsMA oscillator remains negative and is steadily declining, underscoring the persistent bearish sentiment.
On the fundamental side, pressure on the euro increased after this morning’s German Industrial Production data missed expectations, further reinforcing concerns about stagnation in Germany. This comes amid ongoing dovish signals from the European Central Bank (ECB), which is widely expected to maintain a cautious stance through Q3.
In contrast, the U.S. dollar is gaining ground as investors respond to Friday’s robust Non-Farm Payrolls (NFP) report and increasingly hawkish rhetoric from Federal Reserve officials. The central bank has hinted at the possibility of additional rate hikes should inflation remain sticky, widening the policy divergence between the Fed and the ECB.
Key support levels for EUR/USD are now seen at 1.16890, followed by a critical zone at 1.16184. A break below these areas could open the door toward the 1.15230 region in the coming sessions. On the upside, resistance lies at 1.17498 and 1.17730.
Outlook:
The path of least resistance for EUR/USD remains lower in the short term. Unless upcoming data reverses the current macro narrative, the euro may remain on the defensive.
Current Trade Status
Opened - 7/7 @ 7:51 PM - 1.17043
Target - 1.16184
SL - 1.18289
Current Trading Account Status - (-0.007%)
This is not trading advice. You should always perform your own research and technical analysis before opening a position.

EURUSD Sell analysis/ideaThis trade is based on the daily and 4-hour timeframes and executed based on reversal trading and trend formation. Complete explanation in the video!

EUR/USD at 1.1750 as EU Pushes Trade DealEUR/USD trades around 1.1745 in Tuesday’s Asian session, supported by strong Eurozone retail sales for May. The Euro benefits as the EU aims to finalize a preliminary trade deal with the US this week, seeking to maintain a 10% tariff beyond the August 1 deadline while negotiations continue. The proposed agreement would keep the 10% base tariff but exempt sensitive sectors like aviation and alcohol, which helps lift market sentiment toward the Euro.
Eurostat data showed retail sales rose 1.8% year-on-year in May, beating expectations of 1.2% but slowing from April’s 2.7%. Monthly sales fell 0.7%, matching forecasts.
Resistance for the pair is at 1.1830, while support is at 1.1730.

EURUSD 15/3 Pullback LongThis is the follow up idea. The 1-hr chart already show bullish. Will be waiting for the pullback probably liquidation and long.

EUR/USD Could Take Off From Here! Strategic SetupHi traders! , Analyzing EUR/USD on the 30 minute timeframe, price is currently reacting from a strong support zone near 1.1696, showing potential for a bullish rebound after a sharp drop.
🔹 Entry: 1.1696
🔹 Take Profit (TP): 1.1770
🔹 Stop Loss (SL): 1.1621
After a strong downside move, EUR/USD is attempting a recovery from a key intraday support area. The RSI is bouncing from oversold conditions (around 34), indicating a possible short-term shift in momentum.
Price is also approaching the 200 EMA from below, and a break above could confirm bullish continuation toward the 1.1770 resistance zone. The setup offers a solid risk-reward ratio and aligns with mean reversion expectations.
⚠️ DISCLAIMER: This is not financial advice. Every trader is responsible for their own decisions and risk management.

Eurousd techinical analysis.Eurousd techinical analysis next move posibale at h1 time frame.not finchinal advice.

EURUSDPreferably suitable for scalping and accurate as long as you watch carefully the price action with the drawn areas.
With your likes and comments, you give me enough energy to provide the best analysis on an ongoing basis.
And if you needed any analysis that was not on the page, you can ask me with a comment or a personal message.
Enjoy Trading ;)

Eurusd sellwe have retested daily where we broke previous candle open and currently changed structure currently waiting for retracement to the 50% and premium zone to short
Bearish Bias on EURUSD Down trend line respected
D= pullback 4H= Bearish - low high form
1H = Bearish at LH
- short term down trend is over
- Bearish engulfing candle
- both 14 and 50 ema above price at a LH
= short entry

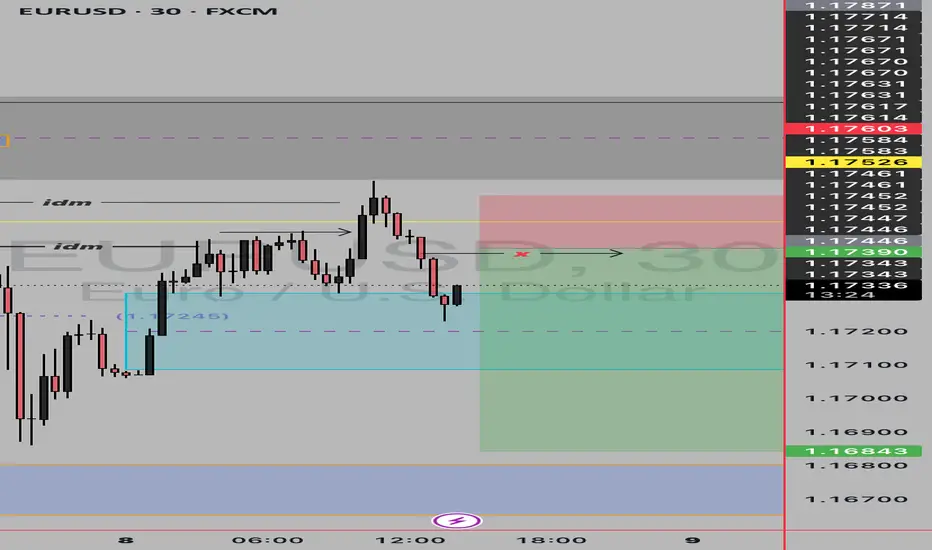
EURUSDWe have an Ob on that 15 m TF but we also have the Liquidity on bottom side and on top so possibly it will Grab the lower Liquidity and then go up But we need to be causious for that OB on 15m that zone

EURUSD Short, 08 JulyHTF Bearish Continuation & Intraday Confirmation
HTF bias remains bearish, reacting from W/D OB and completing the daily imbalance left from yesterday. Now looking for continuation lower, supported by a clean 4H OB.
📉 Confluence:
15m Decisional OB in play
5m OB entry zone with a clean 1m BOS
DXY gap + imbalance still open in our favor + Correlation between EU and DXY
Asia session structure aligned
🎯 Entry: Retest of 5m OB after 1m BOS
🛡️ SL: Above recent high, ~10 pips
📌 TP: Asia low – 1:3 RR
⚠️ Risk: OB is mid-Asia (less ideal), and DXY Daily imbalance not filled yet
Still a solid setup with structure + HTF narrative backing it.

EURUSD sideways consolidation support at 1.1640The EURUSD currency pair continues to exhibit a bullish price action bias, supported by a sustained rising trend. Recent intraday movement reflects a sideways consolidation breakout, suggesting potential continuation of the broader uptrend.
Key Technical Level: 1.1640
This level marks the prior consolidation range and now acts as pivotal support. A corrective pullback toward 1.1640 followed by a bullish rejection would reinforce the bullish trend, targeting the next resistance levels at:
1.1830 – Near-term resistance
1.1900 – Minor swing high
1.1940 – Longer-term bullish objective
On the other hand, a decisive daily close below 1.1640 would invalidate the bullish setup, shifting the outlook to bearish in the short term. This could trigger a deeper retracement toward:
1.1590 – Initial support
1.1530 – Key downside target
Conclusion:
As long as 1.1640 holds as support, the technical outlook remains bullish, favoring long positions on dips. A confirmed break below this level would signal a shift in sentiment and open the door to a corrective pullback phase.
This communication is for informational purposes only and should not be viewed as any form of recommendation as to a particular course of action or as investment advice. It is not intended as an offer or solicitation for the purchase or sale of any financial instrument or as an official confirmation of any transaction. Opinions, estimates and assumptions expressed herein are made as of the date of this communication and are subject to change without notice. This communication has been prepared based upon information, including market prices, data and other information, believed to be reliable; however, Trade Nation does not warrant its completeness or accuracy. All market prices and market data contained in or attached to this communication are indicative and subject to change without notice.
