EUR/USD Slides Below 1.1720 - Dovish Euro Data and Hawkish FedThe euro continued to retreat against the U.S. dollar in Tuesday’s European session, with FOREXCOM:EURUSD falling to 1.17163, pressured by weakening Eurozone fundamentals and renewed U.S. dollar strength.
Technically, the pair has broken below a short-term support zone around 1.1745, marking a clear shift toward bearish momentum. Price action on the 4-hour chart shows a rejection from the 1.1773 resistance zone last week, forming a descending pattern as sellers gained control. Multiple indicators confirm the downward bias.
The MACD (19,39,29) and MACD (12,26,9) are both printing bearish crossovers, with declining histograms indicating increasing downside momentum. Meanwhile, the JoeChalhoub_FXForecaster V1, a custom indicator, shows fading bullish pressure with histogram bars turning pink and gradually weakening. The non-repainting version supports the same trend, reflecting reduced bullish participation.
Adding to the technical signals, the OsMA oscillator remains negative and is steadily declining, underscoring the persistent bearish sentiment.
On the fundamental side, pressure on the euro increased after this morning’s German Industrial Production data missed expectations, further reinforcing concerns about stagnation in Germany. This comes amid ongoing dovish signals from the European Central Bank (ECB), which is widely expected to maintain a cautious stance through Q3.
In contrast, the U.S. dollar is gaining ground as investors respond to Friday’s robust Non-Farm Payrolls (NFP) report and increasingly hawkish rhetoric from Federal Reserve officials. The central bank has hinted at the possibility of additional rate hikes should inflation remain sticky, widening the policy divergence between the Fed and the ECB.
Key support levels for EUR/USD are now seen at 1.16890, followed by a critical zone at 1.16184. A break below these areas could open the door toward the 1.15230 region in the coming sessions. On the upside, resistance lies at 1.17498 and 1.17730.
Outlook:
The path of least resistance for EUR/USD remains lower in the short term. Unless upcoming data reverses the current macro narrative, the euro may remain on the defensive.
Current Trade Status
Opened - 7/7 @ 7:51 PM - 1.17043
Target - 1.16184
SL - 1.18289
Current Trading Account Status - (-0.007%)
This is not trading advice. You should always perform your own research and technical analysis before opening a position.
EURUSD trade ideas

EURUSD Sell analysis/ideaThis trade is based on the daily and 4-hour timeframes and executed based on reversal trading and trend formation. Complete explanation in the video!

EUR/USD at 1.1750 as EU Pushes Trade DealEUR/USD trades around 1.1745 in Tuesday’s Asian session, supported by strong Eurozone retail sales for May. The Euro benefits as the EU aims to finalize a preliminary trade deal with the US this week, seeking to maintain a 10% tariff beyond the August 1 deadline while negotiations continue. The proposed agreement would keep the 10% base tariff but exempt sensitive sectors like aviation and alcohol, which helps lift market sentiment toward the Euro.
Eurostat data showed retail sales rose 1.8% year-on-year in May, beating expectations of 1.2% but slowing from April’s 2.7%. Monthly sales fell 0.7%, matching forecasts.
Resistance for the pair is at 1.1830, while support is at 1.1730.

EURUSD 15/3 Pullback LongThis is the follow up idea. The 1-hr chart already show bullish. Will be waiting for the pullback probably liquidation and long.

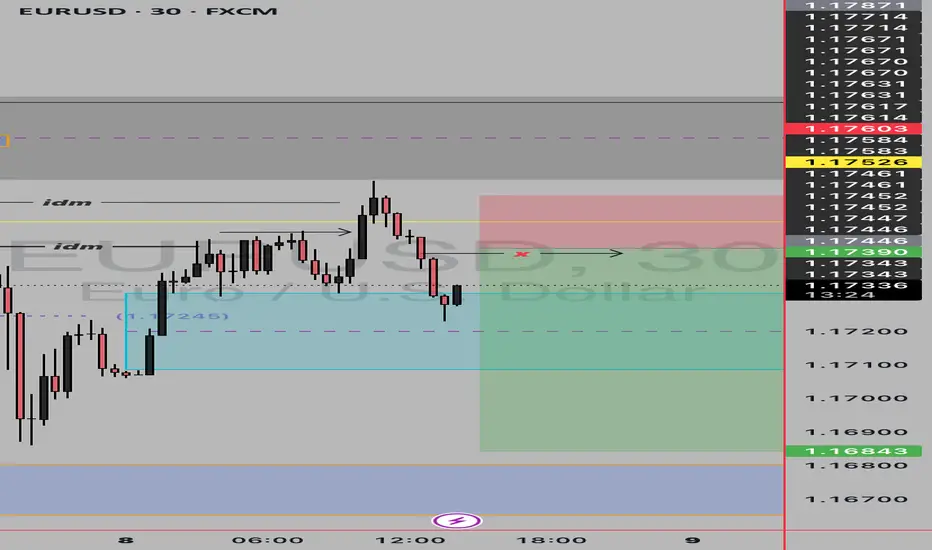
EUR/USD Could Take Off From Here! Strategic SetupHi traders! , Analyzing EUR/USD on the 30 minute timeframe, price is currently reacting from a strong support zone near 1.1696, showing potential for a bullish rebound after a sharp drop.
🔹 Entry: 1.1696
🔹 Take Profit (TP): 1.1770
🔹 Stop Loss (SL): 1.1621
After a strong downside move, EUR/USD is attempting a recovery from a key intraday support area. The RSI is bouncing from oversold conditions (around 34), indicating a possible short-term shift in momentum.
Price is also approaching the 200 EMA from below, and a break above could confirm bullish continuation toward the 1.1770 resistance zone. The setup offers a solid risk-reward ratio and aligns with mean reversion expectations.
⚠️ DISCLAIMER: This is not financial advice. Every trader is responsible for their own decisions and risk management.

Eurousd techinical analysis.Eurousd techinical analysis next move posibale at h1 time frame.not finchinal advice.

EURUSDPreferably suitable for scalping and accurate as long as you watch carefully the price action with the drawn areas.
With your likes and comments, you give me enough energy to provide the best analysis on an ongoing basis.
And if you needed any analysis that was not on the page, you can ask me with a comment or a personal message.
Enjoy Trading ;)

Eurusd sellwe have retested daily where we broke previous candle open and currently changed structure currently waiting for retracement to the 50% and premium zone to short
Bearish Bias on EURUSD Down trend line respected
D= pullback 4H= Bearish - low high form
1H = Bearish at LH
- short term down trend is over
- Bearish engulfing candle
- both 14 and 50 ema above price at a LH
= short entry

EURUSDWe have an Ob on that 15 m TF but we also have the Liquidity on bottom side and on top so possibly it will Grab the lower Liquidity and then go up But we need to be causious for that OB on 15m that zone

EURUSD Short, 08 JulyHTF Bearish Continuation & Intraday Confirmation
HTF bias remains bearish, reacting from W/D OB and completing the daily imbalance left from yesterday. Now looking for continuation lower, supported by a clean 4H OB.
📉 Confluence:
15m Decisional OB in play
5m OB entry zone with a clean 1m BOS
DXY gap + imbalance still open in our favor + Correlation between EU and DXY
Asia session structure aligned
🎯 Entry: Retest of 5m OB after 1m BOS
🛡️ SL: Above recent high, ~10 pips
📌 TP: Asia low – 1:3 RR
⚠️ Risk: OB is mid-Asia (less ideal), and DXY Daily imbalance not filled yet
Still a solid setup with structure + HTF narrative backing it.

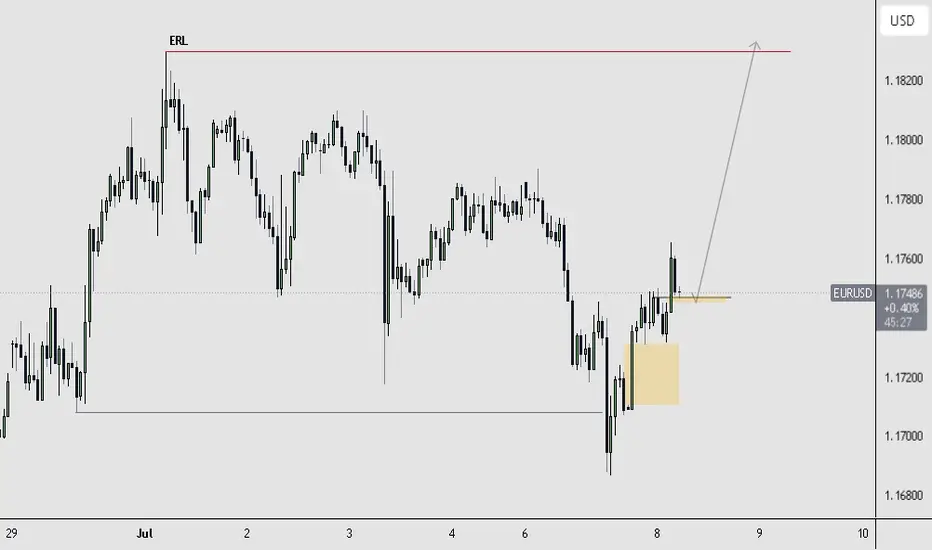
EURUSD sideways consolidation support at 1.1640The EURUSD currency pair continues to exhibit a bullish price action bias, supported by a sustained rising trend. Recent intraday movement reflects a sideways consolidation breakout, suggesting potential continuation of the broader uptrend.
Key Technical Level: 1.1640
This level marks the prior consolidation range and now acts as pivotal support. A corrective pullback toward 1.1640 followed by a bullish rejection would reinforce the bullish trend, targeting the next resistance levels at:
1.1830 – Near-term resistance
1.1900 – Minor swing high
1.1940 – Longer-term bullish objective
On the other hand, a decisive daily close below 1.1640 would invalidate the bullish setup, shifting the outlook to bearish in the short term. This could trigger a deeper retracement toward:
1.1590 – Initial support
1.1530 – Key downside target
Conclusion:
As long as 1.1640 holds as support, the technical outlook remains bullish, favoring long positions on dips. A confirmed break below this level would signal a shift in sentiment and open the door to a corrective pullback phase.
This communication is for informational purposes only and should not be viewed as any form of recommendation as to a particular course of action or as investment advice. It is not intended as an offer or solicitation for the purchase or sale of any financial instrument or as an official confirmation of any transaction. Opinions, estimates and assumptions expressed herein are made as of the date of this communication and are subject to change without notice. This communication has been prepared based upon information, including market prices, data and other information, believed to be reliable; however, Trade Nation does not warrant its completeness or accuracy. All market prices and market data contained in or attached to this communication are indicative and subject to change without notice.

EURUSD 15/3 Pullback ShortThe overall trend is short for the past 2 day. Waiting for pullback into sell zone and short. Expecting London session would bring it down. Alert at 1.17505

The Day AheadData Releases:
United States:
NFIB Small Business Optimism (June): Offers insights into the health of the US small business sector. A lower-than-expected reading may point to rising concern over economic conditions and future earnings amid persistent inflation and tight credit.
NY Fed 1-Year Inflation Expectations: Closely watched for signs of shifting consumer sentiment. Any uptick could reinforce expectations of policy caution from the Fed.
Consumer Credit (May): Indicates household borrowing trends. A sharp slowdown may reflect waning consumer confidence or the impact of high interest rates.
Japan:
Economy Watchers Survey (June): A forward-looking gauge of economic sentiment among service sector workers. Deterioration would suggest weakening domestic demand.
Bank Lending (June): Reflects the availability and uptake of credit; slowing lending growth would hint at weakening economic momentum.
May BoP Current Account & Trade Balance: Current account surplus strength often reflects export health and foreign income. A narrowing surplus may indicate external demand headwinds.
Germany & France:
May Trade and Current Account Balances: Provide signals on Eurozone’s external sector strength. Germany’s export engine will be in focus given recent signs of industrial weakness. France’s figures will also be monitored for imbalances amid sluggish domestic demand.
Central Bank Developments:
Reserve Bank of Australia (RBA) Policy Decision:
The RBA held rates steady, as expected, amid persistent inflation in services. While the bank acknowledged progress on headline inflation, it retained a tightening bias, citing risks from strong wage growth and sticky price pressures. Markets are increasingly sensitive to signs of future hikes, particularly with global central banks pivoting toward a more dovish stance.
European Central Bank (ECB):
ECB’s Joachim Nagel reiterated a cautious tone, emphasizing the need for data-dependency in future policy moves. He signaled concern about upside risks to inflation, especially from services, reinforcing the ECB’s slow path to easing despite recent rate cuts. His comments support market pricing of only gradual rate reductions through the remainder of 2025.
This communication is for informational purposes only and should not be viewed as any form of recommendation as to a particular course of action or as investment advice. It is not intended as an offer or solicitation for the purchase or sale of any financial instrument or as an official confirmation of any transaction. Opinions, estimates and assumptions expressed herein are made as of the date of this communication and are subject to change without notice. This communication has been prepared based upon information, including market prices, data and other information, believed to be reliable; however, Trade Nation does not warrant its completeness or accuracy. All market prices and market data contained in or attached to this communication are indicative and subject to change without notice.

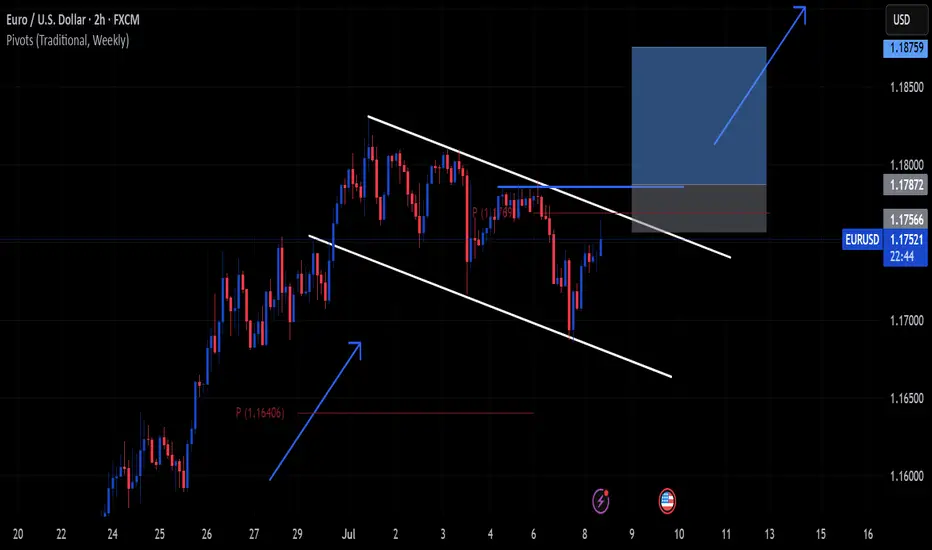
The euro can no longer afford to ignore the support levels aheadI believe the move has already begun, and from this point on especially during the first two days of the week we could see such a formation supported by volume. After climbing for so long, if there’s any intention to break out, I think it should first re enter its original upward channel and at least say hello there. If it’s going to rise further, it should do so from that point. We’ll see together. These are just my personal thoughts and do not constitute financial advice.

EURUSD Setup Scenario A – Bearish Continuation:
🔻 Sell near 1.17300–1.17340 (Resistance Zone)
🎯 Target: 1.17200 or lower
📉 Stop Loss: Above 1.17350
Scenario B – Bullish Breakout:
🔼 Buy if price breaks above 1.17350 with volume
🎯 Target: Next resistance zone (e.g., 1.17450 or more)
📉 Stop Loss: Below 1.17280
🧠 Summary:
Market is consolidating after a drop.
Watching for breakout above resistance or breakdown below support for next move.
Currently, the bias is slightly bearish, but breakout scenarios must be monitored.

SellsWe currently experiencing a short sell as a pullback. We in a buy channel on 1day but on 4 hr we on a flug cautios sells as we await buys on OB

EURUSD 1H ProfilePrice tapped into the weekly BISI yesterday and began showing signs of rejection. During the New York AM/PM into the Asian session, we saw a pullback, providing a solid confirmation for the current Bullish narrative.
At the moment, I’m anticipating a rejection from the hourly order block around 1.10747. My validation point for this idea is the recent low at 1.17316—a break below this would invalidate the setup.
Sell EURUSD"On the 15-minute timeframe, the market is currently in a downtrend. I anticipate a pullback toward the trendline, and if a clear bearish reaction occurs around the 80% Fibonacci retracement zone, I will consider entering a short position."

Navigating the Complexities of Forex Swap RatesNavigating the Complexities of Forex Swap Rates
Forex swap rates, pivotal in currency trading, reflect the cost of holding a position overnight. This article unpacks swaps, offering clarity on their calculation and impact. Even seasoned traders may be confused with the complexity of swaps. It’s vital to learn about how these costs relate to effective strategy and fee management. Dive into the complexities of forex swaps and learn how they can influence decisions and overall performance in the ever-evolving trading world.
Understanding Forex Swap Rates
For traders, understanding forex market swap rates is crucial. A swap is essentially the interest differential paid or charged to a trader when they hold a position overnight. The concept hinges on the idea that when you trade currencies, you are effectively borrowing one currency to buy another. Hence, these rates come into play, reflecting the cost of the process.
The swap rate definition boils down to the interest rate difference between the two currencies involved in a trade. For instance, if you are going long in a pair like EUR/USD, the swap rate would be determined by the difference in interest rates set by the European Central Bank and the Federal Reserve. If the borrowing cost of the euro is lower than that of the dollar, holding the EUR/USD pair overnight would typically result in a charge. Conversely, if the euro has a higher borrowing cost, you might see your balance credited.
Calculating swaps involves a straightforward formula:
Swap rate = (Contract size × Interest differential) ÷ 365
This calculation takes into account the size of your position and the interest rate difference, providing a daily cost or gain for holding the position. Understanding these costs is vital when it comes to managing trading expenses and strategy in the forex market.
Key Elements Influencing Swap Rates
Several factors play pivotal roles in determining overnight swap rates in the forex market.
1. Interest Rate Differentials: The primary driver of overnight rates, interest differentials stem from the varying monetary policies of central banks. For example, if the Bank of England has a higher lending rate than the Federal Reserve, a buy trade in GBP/USD could mean earning for maintaining the position overnight.
2. Market Conditions: Economic stability, political events, and financial market volatility can significantly impact overnight charges. During periods of high volatility or geopolitical uncertainty, rates may fluctuate more dramatically, reflecting the increased market risk.
3. Liquidity: The level of liquidity in the market often influences overnight costs. In less liquid markets and less commonly traded pairs, higher swaps might be charged due to the increased cost of facilitating these trades.
4. Broker Policies: Different forex brokers might have varying policies and calculations for their own swaps. These differences usually arise from the brokers' own pricing structures, risk management strategies, and competitive positioning in the market. As such, traders should be aware that overnight charges vary from broker to broker.
Types of Forex Swaps
There are primarily two types of swaps that traders may encounter, each serving distinct purposes and offering unique implications for trading strategies.
1. Interest Swaps: These involve the exchange of interest payments between parties. In forex, it typically manifests as the fee a trader pays or receives for holding a position overnight. They directly impact the cost of maintaining open positions in different pairs.
2. Currency Swaps (Cross-Currency Swaps): Also known as a currency rate swap, this involves exchanging principal and interest payments in two different currencies. While less common in everyday retail forex activities, they are important in managing currency exposure and risk, particularly in hedging strategies. Currency swaps are used to secure a predetermined exchange rate for a specified currency amount while incorporating a benchmarked or fixed interest rate. This type is usually used by corporations or brokers.
Regarding fixed swap rates, they are less common in the forex market compared to the more prevalent floating swap rates. They’re often used in less volatile financial environments and typically find their application in long-term financial instruments or corporate finance rather than in the day-to-day trading of currencies.
Strategies for Managing Swap Rates
Management of swaps in forex involves several key strategies:
- Short-term Trading: By closing positions before the end of the trading day, traders can avoid incurring overnight fees altogether. It’s a so-called day trading since positions are typically closed by the end of the day.
- Hedging: Implementing hedging strategies may mitigate overnight fees. This involves opening opposite positions in correlated pairs, thus potentially balancing the amounts paid and received.
- Economic Calendar Awareness: Staying informed about major economic announcements and central bank decisions often helps traders anticipate changes in borrowing costs.
- Broker Selection: Choosing the right broker is critical. Selecting a broker with favourable rates might significantly reduce trading fees, especially for those holding long-term positions.
Practical Implications for Traders
Understanding and managing these charges has direct implications for traders' strategies and overall performance. Key considerations include:
- Carry Trading: A carry trade strategy entails borrowing in a currency with a lower interest rate and investing in another with a higher yield. Traders take advantage of the interest differential but must be mindful of potential fees.
- Rollover Costs: Traders holding positions overnight need to account for rollover costs, which can either erode or enhance returns, depending on the direction of the trade and the prevailing swap rates.
- Currency Exposure Management: Swap rates affect the overall cost of maintaining a position. Traders need to balance the potential advantages of holding a position against the charges incurred.
The Bottom Line
Mastering swap rates is a cornerstone of trade management. A thorough understanding may empower traders to navigate these costs and potentially improve their strategies. By carefully considering factors like interest differentials and broker policies, traders may manage their trades and overall performance more effectively.
This article represents the opinion of the Companies operating under the FXOpen brand only. It is not to be construed as an offer, solicitation, or recommendation with respect to products and services provided by the Companies operating under the FXOpen brand, nor is it to be considered financial advice.

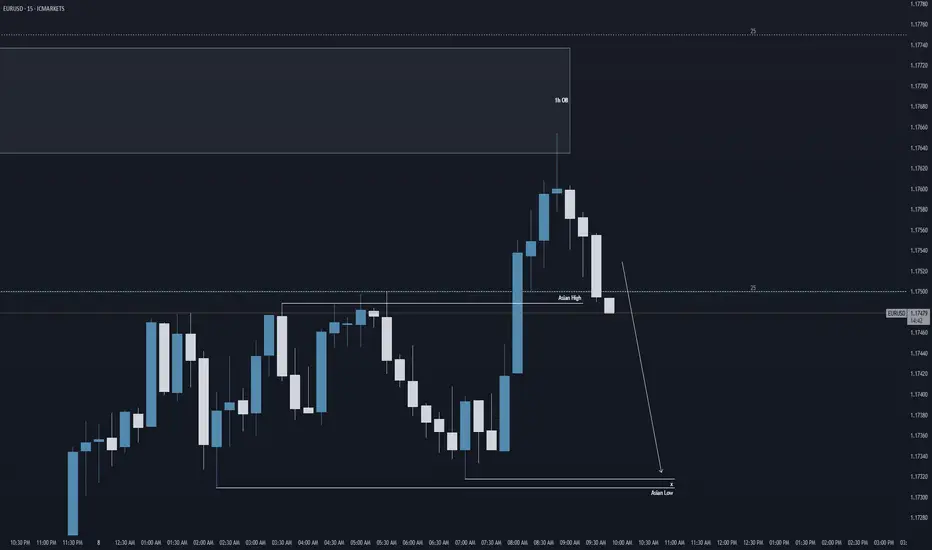
EU: Take out Asian Low Liquidity?Hi everyone,
Looking at EU at this potential pivot point of 1.175.
We've taken out the Asian highs, bouncing of a 1h order block. We could potentially have the opportunity of price creating a bearish leg towards the Asian lows.
Regards,
Aman