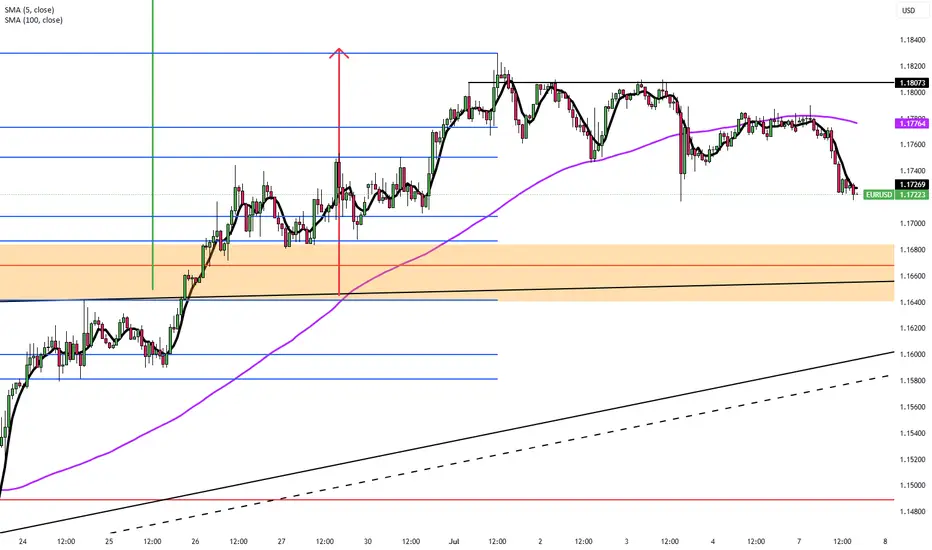
Bearish drop for the Fiber?The price is rising towards the pivot which acts as an overlap resistance and could drop to the 1st support.
Entry: 1.1743
1st Support: 1.1631
1st Resistance: 1.1833
Risk Warning:
Trading Forex and CFDs carries a high level of risk to your capital and you should only trade with money you can afford to lose. Trading Forex and CFDs may not be suitable for all investors, so please ensure that you fully understand the risks involved and seek independent advice if necessary.
Disclaimer:
The above opinions given constitute general market commentary, and do not constitute the opinion or advice of IC Markets or any form of personal or investment advice.
Any opinions, news, research, analyses, prices, other information, or links to third-party sites contained on this website are provided on an "as-is" basis, are intended only to be informative, is not an advice nor a recommendation, nor research, or a record of our trading prices, or an offer of, or solicitation for a transaction in any financial instrument and thus should not be treated as such. The information provided does not involve any specific investment objectives, financial situation and needs of any specific person who may receive it. Please be aware, that past performance is not a reliable indicator of future performance and/or results. Past Performance or Forward-looking scenarios based upon the reasonable beliefs of the third-party provider are not a guarantee of future performance. Actual results may differ materially from those anticipated in forward-looking or past performance statements. IC Markets makes no representation or warranty and assumes no liability as to the accuracy or completeness of the information provided, nor any loss arising from any investment based on a recommendation, forecast or any information supplied by any third-party.
EURUSD trade ideas


EURUSD Bounce on the 4H MA100 eyes 1.2000.The EURUSD pair has been trading within a Channel Up pattern since the May 12 Low. Right now it is expanding its 3rd Bearish Leg of this structure, with the previous two reaching at least either the 4H MA100 (green trend-line) or the 0.5 Fibonacci retracement level before rebounding.
As a result, we expect a rebound soon around the 1.16500 level to start the new Bullish Leg. The last two peaked on the 1.5 Fibonacci extension, which gives us a clear Target at 1.2000.
Notice also that every time the 4H MACD formed a Bullish Cross below the 0.0 mark, it was a confirmed buy signal. Use that to your advantage.
-------------------------------------------------------------------------------
** Please LIKE 👍, FOLLOW ✅, SHARE 🙌 and COMMENT ✍ if you enjoy this idea! Also share your ideas and charts in the comments section below! This is best way to keep it relevant, support us, keep the content here free and allow the idea to reach as many people as possible. **
-------------------------------------------------------------------------------
Disclosure: I am part of Trade Nation's Influencer program and receive a monthly fee for using their TradingView charts in my analysis.
💸💸💸💸💸💸
👇 👇 👇 👇 👇 👇

EURUSD I Technical & Fundamental Forecast Welcome back! Let me know your thoughts in the comments!
** EURUSD Analysis - Listen to video!
We recommend that you keep this pair on your watchlist and enter when the entry criteria of your strategy is met.
Please support this idea with a LIKE and COMMENT if you find it useful and Click "Follow" on our profile if you'd like these trade ideas delivered straight to your email in the future.
Thanks for your continued support!Welcome back! Let me know your thoughts in the comments!


EURUSD: The Market Is Looking Up! Long!
My dear friends,
Today we will analyse EURUSD together☺️
The market is at an inflection zone and price has now reached an area around 1.17341 where previous reversals or breakouts have occurred.And a price reaction that we are seeing on multiple timeframes here could signal the next move up so we can enter on confirmation, and target the next key level of 1.17512.Stop-loss is recommended beyond the inflection zone.
❤️Sending you lots of Love and Hugs❤️

EURUSD Buyers In Panic! SELL!
My dear friends,
My technical analysis for EURUSD is below:
The market is trading on 1.1775 pivot level.
Bias - Bearish
Technical Indicators: Both Super Trend & Pivot HL indicate a highly probable Bearish continuation.
Target - 1.1648
Recommended Stop Loss - 1.1840
About Used Indicators:
A pivot point is a technical analysis indicator, or calculations, used to determine the overall trend of the market over different time frames.
Disclosure: I am part of Trade Nation's Influencer program and receive a monthly fee for using their TradingView charts in my analysis.
———————————
WISH YOU ALL LUCK

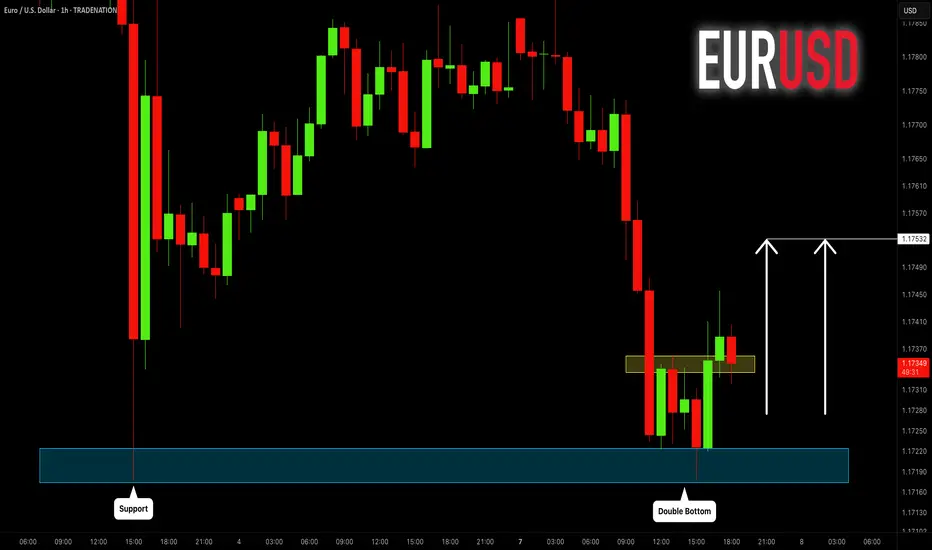
EURUSD: Another Pullback Trade for Today 🇪🇺🇺🇸
EURUSD formed a double bottom pattern on a key daily horizontal support.
Its neckline violation signifies a local strength of the buyers.
I think that the pair may move up and reach 1.1753 level.
❤️Please, support my work with like, thank you!❤️
I am part of Trade Nation's Influencer program and receive a monthly fee for using their TradingView charts in my analysis.
EURUSD: Growth & Bullish Forecast
Balance of buyers and sellers on the EURUSD pair, that is best felt when all the timeframes are analyzed properly is shifting in favor of the buyers, therefore is it only natural that we go long on the pair.
Disclosure: I am part of Trade Nation's Influencer program and receive a monthly fee for using their TradingView charts in my analysis.
❤️ Please, support our work with like & comment! ❤️
Buy on EURUSDPrice liquidates an internal range liquidity. Entering from the Breaker block and targeting a premium swing high

Eurusdearlier trade when wrong at wrong entry but the analysis were correct so i placed the trade again at 2 positions and targeting the Liquidity down side getting 20-30 pips

#AN016: Markets Brace for Tariffs, Forex Reaction
Markets have taken a cautious tone this week, as investors digest new developments on global trade and central bank prospects. A mix of US tariff threats, higher OPEC+ oil production and surprisingly strong eurozone investor sentiment is shaping currency flows.
I'm Forex Trader Andrea Russo, and I want to thank our Official Broker Partner PEPPERSTONE in advance for helping me put this article together.
Investor confidence in the eurozone surged to a three-year high in July. This positive sentiment is reducing the European Central Bank's room to cut rates further, even as inflation remains subdued.
Meanwhile, US President Trump has ordered letters threatening tariffs of up to 70% for nations that fail to conclude trade deals by August 1, creating fresh uncertainty in diplomatic and trade circles.
Asian markets and BRICS currencies have already shown signs of weakness, while US futures have weakened on the threat.
Oil markets have also reacted sharply to OPEC+’s announcement of a higher-than-expected production increase of around 550,000 barrels per day from August, which has pushed Brent below $68 and US crude below $66.
On the European inflation front, the ECB is opting to postpone further rate cuts. Estonian Minister Madis Müller confirmed that the ECB can afford to put monetary easing on hold, given stable inflation and solid growth.
reuters.com
Forex Impact – What Traders Should Watch
The combination of strong eurozone sentiment and looming trade tensions is driving significant currency dynamics this week:
EUR/USD: The euro has room to strengthen further. Optimistic sentiment and a pause from the ECB reinforce the bullish bias, but tariff uncertainty could trigger safe-haven demand for USD.
USD/JPY and CHF: The dollar could find support amid global risk aversion, pushing JPY and CHF higher.
Commodity currencies (CAD, AUD, NOK): Under double pressure: higher oil supply and rising trade risks could weigh on crude-related currencies.
Emerging market currencies: BRICS currencies could remain under pressure due to threats of additional US tariffs; Indian rupee and other currencies could depreciate further.
US Jobs Data Supports Fed Dovish SignalsThe EUR/USD stayed in a narrow range around 1.1760 during Friday’s Asian session, with limited movement as US markets were closed for Independence Day.
The US dollar gained modestly after Thursday’s NFP data showed 147,000 new jobs in June, beating the expected 110,000.
However, private sector job growth slowed, adding only 74,000 jobs in June versus a three-month average of 115,000. This trend supports Fed officials like Vice Chair Bowman, who recently called for rate cuts due to labor market risks.
Resistance for the pair is at 1.1830, while support is at 1.1730.
bullish flag emergingthis just an experimental idea help me with your knowledge feel free to comment and hope your portfolio to be green today

#EURUSD: Nothing to expect from DXY| View Changed Swing Trading|Hey there! So, we were previously thinking EURUSD was going to be bearish, but things have turned around and it’s looking bullish for now.
The extreme bearish pressure on USD has caused all the major USD pairs to be in a range. As the week goes on and we get the NFP data, the market will probably focus more on these economic indicators. So, it’s not surprising to see some market ranges during this time.
We’ll keep a close eye on the market, as there might be some manipulation going on this week.
We recommend waiting until Monday’s daily candle closes to see if the bullish trend is strong enough. Then, based on the price momentum, you can make your decisions.
We hope you have a great week and safe trading! If you like our work and analysis, please consider liking, commenting, and sharing our content.
Cheers,
Team Setupsfx
❤️🚀

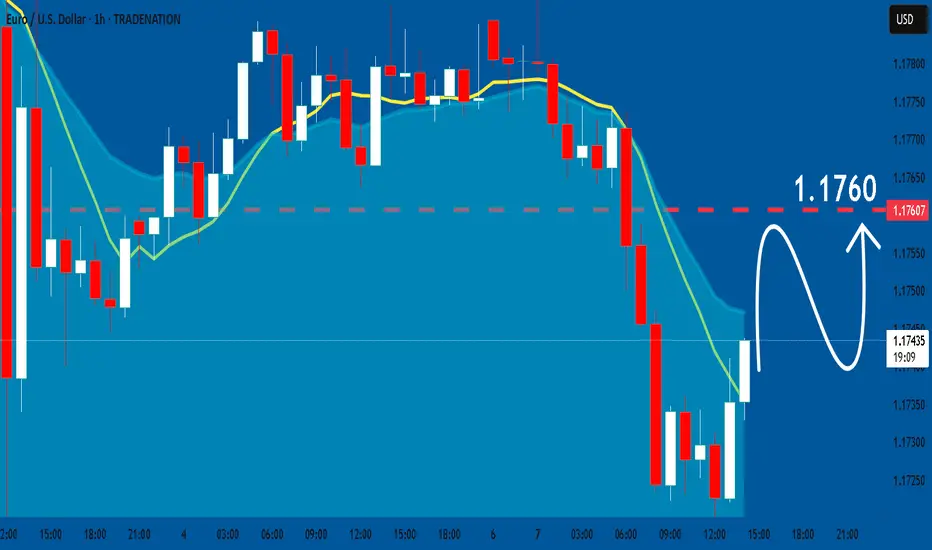
What’s EURUSD Telling Us on the 30-Minute Chart?🌅 Good morning, my friends,
EURUSD just made a pullback within the last 30 minutes, so I entered a sell position based on that move.
🎯 Targets:
- TP1: 1.17607
- TP2: 1.17475
- TP3: 1.17174
🛑 Stop Loss: 1.17938
📊 Risk/Reward Ratio: 2.00
Your likes and support are what keep me motivated to share these analyses consistently.
Huge thanks to everyone who shows love and appreciation! 🙏

EURUSD BUY OPPORTUNITY Am seeing a buy Opportunities on EURUSD
Entry: 1.17100
Stoploss: 1.1700
Takeprofit: 1.17500
Comment your opinion
For Fund Management Contact me on X @shajudeakinoba1

Eurousd techinical analysis.Eurousd techinical analysis next move posibale at h1 time frame.not finchinal advice.


EUEu short based on the simple analysis and targeting the liquidity and the FVG price is tring to return back

EURusd Short position 07/07/2025English : According to our analysis, we anticipate a bearish scenario.
Morocan Darija : kanchofo d'apres l'analyse dyalna antsanaw hboot
ATENTION : I only share my ideas, not signal

EURUSD - Looking for the RTLooking for the RT on the upper supply zone, long term target for EURUSD is 1.200-1.2200. However, on RT we can potentially expect a larger pull back but will analyse PA.

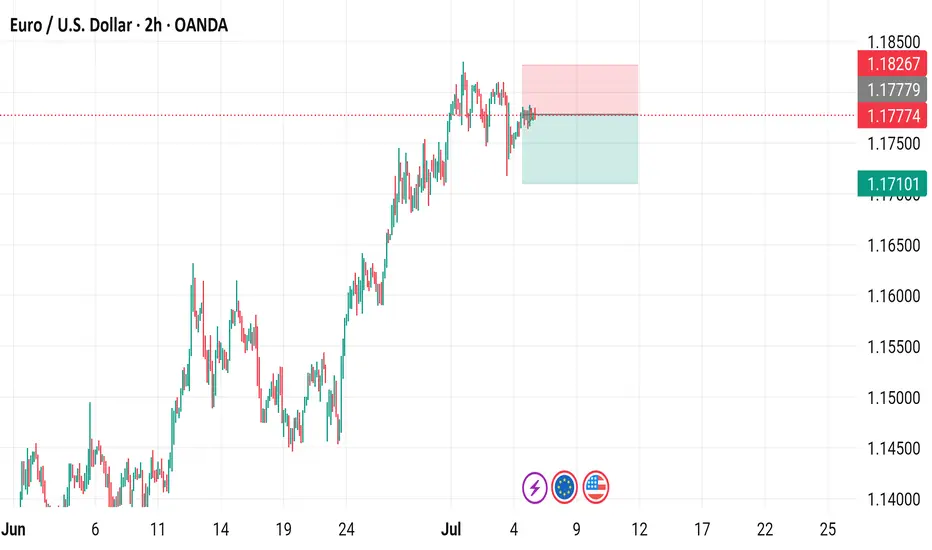
Euro / U.S. Dollar - 2h Chart (OANDA)2-hour candlestick chart of the EUR/USD currency pair from OANDA, showing the exchange rate trend from late June to July 07, 2025. The current rate is 1.17774, with a 0.00200 (0.17%) increase. The chart highlights a recent trading range between 1.17774 (sell) and 1.17824 (buy), with a notable upward movement in the past few hours.