3-Year Euro Uptrend — An Absurdity Amid a Weak EconomyCMCMARKETS:EURUSD
The euro is climbing, hitting its highest levels since late 2021 near $1.18. This surge is driven by diverging central bank policies—with the ECB holding rates steady while the Fed leans dovish—amid global tensions that push gold higher and rattle markets, weakening the dollar even though the eurozone economy remains fragile.
📉 1️⃣ Dollar Weakness Takes Center Stage
Since its January 2025 peak, the U.S. Dollar Index (DXY) has fallen by over 11% 📉—one of its worst starts in decades, comparable to the slumps of 1986 and 1989. As inflation cools, markets are betting on Fed rate cuts, pulling U.S. Treasury yields lower. Coupled with monetary policy divergence and tariff drama, the dollar’s usual safe-haven appeal is fading, even amid ongoing geopolitical tensions.
📊 2️⃣ Fed–ECB Policy Divergence
While the ECB has signaled the possibility of one or two cuts this year, markets are pricing in a milder path. By contrast, the Fed is tilting dovish, with swaps markets expecting a rate cut in September and another by December 🗓️. This widening yield differential supports EUR/USD, even though eurozone growth remains soft.
⚖️ 3️⃣ Trump Tariff Risks and Sentiment Shift
Uncertainty around U.S. trade policy—especially the threat of renewed tariffs—has weighed more heavily on USD sentiment than on eurozone currencies. Markets view these tariffs as inflationary and damaging to U.S. growth prospects. Speculative positioning data confirms record bearish sentiment on the dollar, with funds underweight USD for the first time in 20 years 💼.
💶 4️⃣ Eurozone’s Fiscal Shift
Germany has begun spending and borrowing, marking a dramatic pivot from years of fiscal restraint. This has raised hopes for an investment-driven recovery across the eurozone. Meanwhile, ECB President Christine Lagarde is avoiding signaling aggressive cuts, stabilizing market expectations and maintaining a sense of monetary calm—for now 🛡️.
🛡️ 5️⃣ Safe-Haven Flows Shifting
Traditionally, geopolitical stress boosts the USD as a safe haven. This cycle is different: investors are increasingly turning to gold, the Swiss franc, and the yen as defensive assets, indirectly supporting the euro. In April, when Trump delayed tariff plans, safe-haven USD flows unwound further, fueling euro gains 💰.
⚠️ Risks Ahead for EUR/USD:
💔 Weak Eurozone Fundamentals:
The eurozone economy is not booming. The IMF projects just 0.9% growth for 2025, with Germany, France, and Italy struggling to regain momentum. The ECB’s Financial Stability Review flags worsening credit conditions, weak private investment, and deteriorating balance sheets, none of which support sustained euro appreciation 📉.
🚢 A Strong Euro Hurts Exports:
Eurozone exporters in machinery, chemicals, and autos are already facing squeezed margins from rising input costs and global protectionism. A stronger euro makes exports less competitive, shrinking the eurozone’s current account surplus, which dropped sharply from €50.9 billion in March to €19.8 billion in April, according to the ECB 📊.
⚡ Political Risks Looming:
Fragile coalitions in Germany, budget battles in France, and rising anti-EU sentiment in Italy and the Netherlands could swiftly unwind euro gains if tensions escalate. Should the ECB turn dovish to support a weakening labor market, the euro’s rally could reverse quickly 🗳️.
📈 7️⃣ Technical Picture: Overextension Warning
In addition to the macro drivers, EUR/USD is now technically overextended. The pair has already retraced exactly 78.6% of its major bearish trend that started in January 2021 and ended in September of that year. Ahead lies a strong resistance zone at 1.18000–1.20000, which will be difficult to break without a significant catalyst.
Notably, the daily chart shows bearish RSI divergence, indicating fading momentum beneath the surface of this rally. A pullback toward the 1.13000 level would not be surprising, even as near-term momentum remains strong. This technical setup calls for caution while the pair tests these critical levels.
📈 Technical Outlook: EUR/USD Showing Signs of Overextension
Beyond macroeconomic factors, EUR/USD is currently technically overextended. The pair has retraced exactly 78.6% of its major bearish trend that began in January 2021 and concluded in September the same year. It is now approaching the upper boundary of a 3-year ascending channel, facing a significant resistance zone between 1.18000 and 1.20000—a hurdle unlikely to be crossed without a strong catalyst.
Additionally, the weekly chart reveals a bearish RSI divergence, signaling that underlying momentum is weakening despite the recent rally. Given this, a pullback toward the 1.13000 level is plausible, even as short-term momentum remains robust. This technical setup advises caution as the pair navigates these critical resistance levels.
EURUSD trade ideas

EURUSD has broken channal.EURUSD has broken channal. Now consolidating waiting for Global cues to strenthen dollar before EURUSD start fallimg.

Eurousd techinical analysis.Eurousd techinical analysis next move posibale at h1 time frame.not finchinal advice.

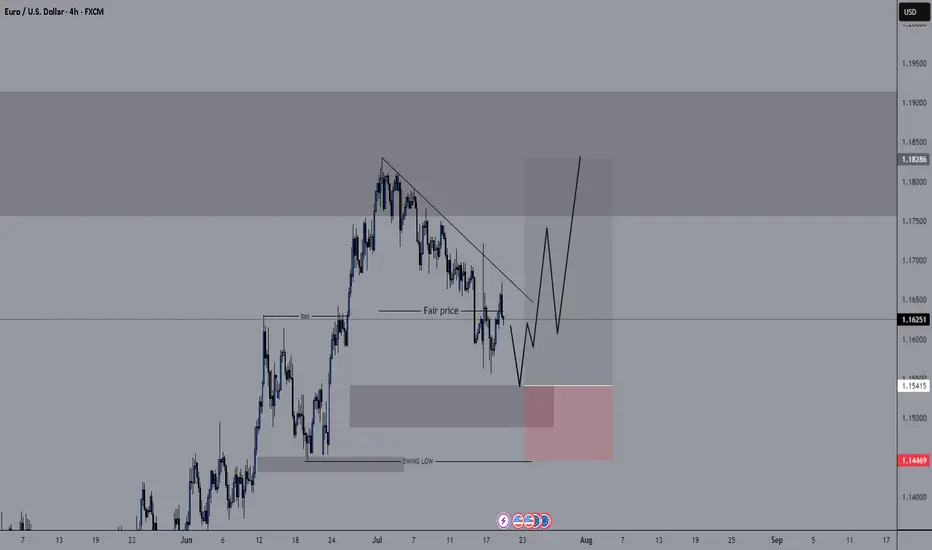
EURUSD Q3 | D21 | W30 | Y25 📊EURUSD Q3 | D21 | W30 | Y25
Daily Forecast 🔍📅
Here’s a short diagnosis of the current chart setup 🧠📈
Higher time frame order blocks have been identified — these are our patient points of interest 🎯🧭.
It’s crucial to wait for a confirmed break of structure 🧱✅ before forming a directional bias.
This keeps us disciplined and aligned with what price action is truly telling us.
📈 Risk Management Protocols
🔑 Core principles:
Max 1% risk per trade
Only execute at pre-identified levels
Use alerts, not emotion
Stick to your RR plan — minimum 1:2
🧠 You’re not paid for how many trades you take, you’re paid for how well you manage risk.
🧠 Weekly FRGNT Insight
"Trade what the market gives, not what your ego wants."
Stay mechanical. Stay focused. Let the probabilities work.
FRGNT 📊

Bullish momentum to extend?The Fiber (EUR/USD) is reacting off the pivot which is a pullback support that aligns with the 61.8% Fibonacci retracement and could bounce to the 1st resistance.
Pivot: 1.1584
1st Support: 1.1448
1st Resistance: 1.1809
Risk Warning:
Trading Forex and CFDs carries a high level of risk to your capital and you should only trade with money you can afford to lose. Trading Forex and CFDs may not be suitable for all investors, so please ensure that you fully understand the risks involved and seek independent advice if necessary.
Disclaimer:
The above opinions given constitute general market commentary, and do not constitute the opinion or advice of IC Markets or any form of personal or investment advice.
Any opinions, news, research, analyses, prices, other information, or links to third-party sites contained on this website are provided on an "as-is" basis, are intended only to be informative, is not an advice nor a recommendation, nor research, or a record of our trading prices, or an offer of, or solicitation for a transaction in any financial instrument and thus should not be treated as such. The information provided does not involve any specific investment objectives, financial situation and needs of any specific person who may receive it. Please be aware, that past performance is not a reliable indicator of future performance and/or results. Past Performance or Forward-looking scenarios based upon the reasonable beliefs of the third-party provider are not a guarantee of future performance. Actual results may differ materially from those anticipated in forward-looking or past performance statements. IC Markets makes no representation or warranty and assumes no liability as to the accuracy or completeness of the information provided, nor any loss arising from any investment based on a recommendation, forecast or any information supplied by any third-party.

EUR USD SHORTLets go for the first idea for this week, I will be watching other currency pairs, if we have a clear opportunity, we can get in.

Watch out for EURUSDEURUSD continues to move sideways above the support zone.
This week, the key event is the ECB’s interest rate decision.
Keep an eye on whether there's enough momentum for a breakout above 1,1720.
If it gets rejected again, we might see a deeper correction.

EURUSD - M15 Supply Zone RetestThe current price action shows that the market is expected to first fill the Fair Value Gap (FVG) area, which acts as a price inefficiency zone demanding liquidity clearance. After the FVG is filled, the price is anticipated to retest the Higher Time Frame (HTF) Supply Zone, which serves as a strong resistance area.
Following the retest of the supply zone, the prevailing downtrend is likely to resume, pushing the price downwards towards the HTF Demand Zone. This demand zone is identified as a key support level where buying interest is expected to emerge, potentially halting the decline temporarily or initiating a reversal.
This trading plan emphasizes waiting patiently for the FVG fill as a prerequisite step before looking for a supply zone retest confirmation to enter short positions targeting the demand zone below, aligning with the overall bearish trend continuation.

EURUSD InsightWelcome to all our subscribers.
Please feel free to share your personal opinions in the comments. Don’t forget to like and subscribe.
Key Points
- Christopher Waller, a member of the Federal Reserve Board, commented on interest rate cuts, saying, “Why wait until September? It's only six weeks away and not that significant.”
- With the August 1st negotiation deadline approaching, Trump reportedly wants to impose tariffs on most EU goods at a level higher than the minimum 10%. Negotiations with the EU are said to be facing difficulties due to the U.S.’s hardline stance. The EU is expected to take retaliatory measures if the talks fail.
- Japan’s NHK reported that the ruling coalition of the Liberal Democratic Party (LDP) and Komeito is certain to fail to secure the 50 seats needed for a majority. As a result, Prime Minister Ishiba is likely to face difficulties in implementing his policies following a victory by the opposition.
This Week’s Key Economic Events
+ July 22: Speech by Fed Chair Jerome Powell
+ July 24: ECB Interest Rate Decision
EURUSD Chart Analysis
The downtrend continues, with the pair having dropped to the 1.16000 level. A further decline toward the 1.15000 area is possible if this level is breached, though a rebound from this zone is also a possibility. If a bounce occurs, attention should be paid to how the price behaves around the 1.18000 level. Conversely, if the pair drops to 1.15000 and then successfully rebounds, an upward move toward 1.19500 could be expected.

EURUSD M15 I Bearish Reversal Based on the M15 chart, the price could rise toward our sell entry level at 1.1641, a pullback resistance.
Our take profit is set at 1.1604, a pullback support that aligns closely with the 62.8% Fib retracement.
The stop loss is set at 1.1670, an overlap resistance.
High Risk Investment Warning
Trading Forex/CFDs on margin carries a high level of risk and may not be suitable for all investors. Leverage can work against you.
Stratos Markets Limited (tradu.com ):
CFDs are complex instruments and come with a high risk of losing money rapidly due to leverage. 66% of retail investor accounts lose money when trading CFDs with this provider. You should consider whether you understand how CFDs work and whether you can afford to take the high risk of losing your money.
Stratos Europe Ltd (tradu.com ):
CFDs are complex instruments and come with a high risk of losing money rapidly due to leverage. 66% of retail investor accounts lose money when trading CFDs with this provider. You should consider whether you understand how CFDs work and whether you can afford to take the high risk of losing your money.
Stratos Global LLC (tradu.com ):
Losses can exceed deposits.
Please be advised that the information presented on TradingView is provided to Tradu (‘Company’, ‘we’) by a third-party provider (‘TFA Global Pte Ltd’). Please be reminded that you are solely responsible for the trading decisions on your account. There is a very high degree of risk involved in trading. Any information and/or content is intended entirely for research, educational and informational purposes only and does not constitute investment or consultation advice or investment strategy. The information is not tailored to the investment needs of any specific person and therefore does not involve a consideration of any of the investment objectives, financial situation or needs of any viewer that may receive it. Kindly also note that past performance is not a reliable indicator of future results. Actual results may differ materially from those anticipated in forward-looking or past performance statements. We assume no liability as to the accuracy or completeness of any of the information and/or content provided herein and the Company cannot be held responsible for any omission, mistake nor for any loss or damage including without limitation to any loss of profit which may arise from reliance on any information supplied by TFA Global Pte Ltd.
The speaker(s) is neither an employee, agent nor representative of Tradu and is therefore acting independently. The opinions given are their own, constitute general market commentary, and do not constitute the opinion or advice of Tradu or any form of personal or investment advice. Tradu neither endorses nor guarantees offerings of third-party speakers, nor is Tradu responsible for the content, veracity or opinions of third-party speakers, presenters or participants.

EURUSDThis is the EURUSD 1H chart showing a potential bullish setup. Here’s a breakdown of your market structure and what you can do:
Observations:
1. Trendline Support: Price is respecting a daily trendline, which shows potential for upward continuation.
2. Order Block: Price has tapped into a clear order block zone, indicating institutional interest and potential for a reversal.
3. BOS (Break of Structure) & CHoCH (Change of Character): Previous BOS confirms downward movement, but recent CHoCH suggests a possible shift to bullish momentum.
4. Bullish Projection: Your markup shows a forecasted bullish leg with a minor pullback before continuation.
What to do:
- Entry: Wait for a confirmation candle (bullish engulfing or strong rejection wick) within or just above the order block to go long.
- Stop Loss: Place it just below the order block or trendline for safety.
- Take Profit: You can scale out at recent highs or follow price using trailing stops. Consider targeting previous supply zones for partial exits.

eurusddrops, high posibilitys that it falls in yellow area, this idea is form from old paterns which indicates the same type of bears structure market, it should make a balance between the wars and the trump assumptions, its finishing the bull runs, be prepare for the sells. good luck.

Eurusd changing trendPrepeair Ur selv to see euro against US dollar with a kinda big or minimum huge profit, going 2 cents above, from 1.1620 to 1.1840, ofc this is only in my POV.
Keep Ur investment safe and use lways a stop loss under wht you can lose, and I don't mean this trade, but all I mean, is that it need to be after Ur analista and Ur own Point of View.
Keep Ur trade simple
Abd do your own research, always.

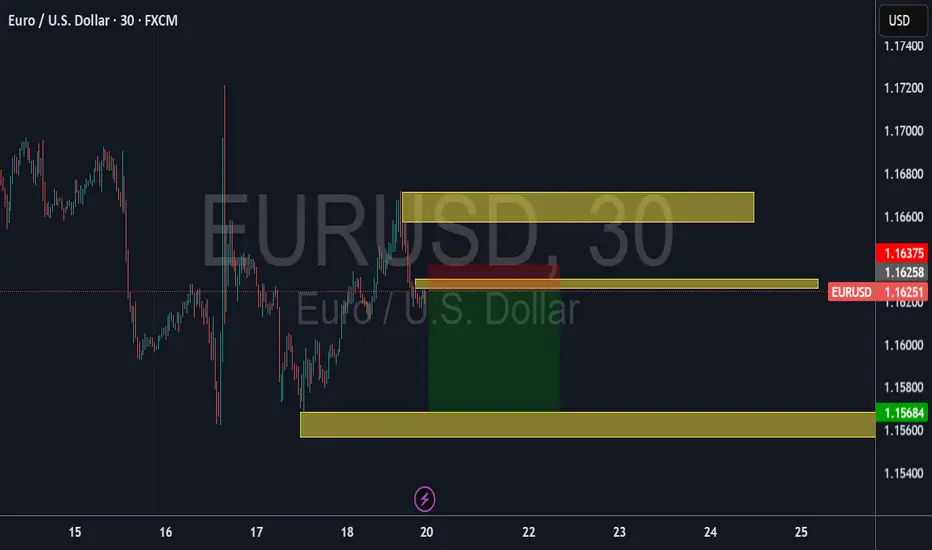
Am selling........Currency Pair: Euro / U.S. Dollar (EUR/USD)
Timeframe: 30-minute intervals (H1)
Data Source: FXCM
Price Data:
Open: 1.16265
High: 1.16275
Low: 1.16189
Close: 1.16251
Change: -0.00014 (-0.01%)
Price Levels:
The chart displays price levels ranging from 1.17400 (highest) to 1.15400 (lowest), with the current price near 1.16251.
Notable levels include 1.16258 (near the close) and 1.15684 (support level).
Time Axis:
The horizontal axis shows time intervals, likely for July 20, 2025, with labels at 15, 16, 17, 18, 20, 22, 23, 24, and 25 (possibly representing hours in UTC).
Chart Type:
The chart appears to be a candlestick or line chart, though the specific type isn't visible in the provided data.
Observations:
The EUR/USD pair showed minimal movement during this period, with a slight decline of -0.01%.
The price traded in a tight range between 1.16189 (low) and 1.16275 (high).
The close (1.16251) was slightly below the open (1.16265), indicating minor bearish pressure.
EURUSD BUY SETUPEURUSD has touched our sloping support trendline and support zone , ITS still in an uptrend it just came for retest . so our expectations is that we might see it going up since it has tested the major zone but we stay watch on what's going to follow next .

EURUSD 4H - BUYOver all it's an uptrend, I believe price finish the correction by reach 61.8 Fib and price is showering Divergency in the daily Time farm, I expect price to continue with the uptrend.

EURUSD SHORTS IDEA
Key take away poins : FX:EURUSD
Fundamental :
The Euro has been weaker because of USA's tariff on the EU. Which caused an increased demand for USD, as the tariffs supports US economical growth, which boost the short term currency strength.
Technical :
EURUSD has made a break and retest of a previous SnR area.
We printed a H4 engulfing after we swept liquidity.
We have a strong LQ grab
Price retested a really POWERFUL trendline.
I will look to enter directly at the engulfing for some sell opportunities.
TMAS20X, entertainement purpose only. Not financial advice.
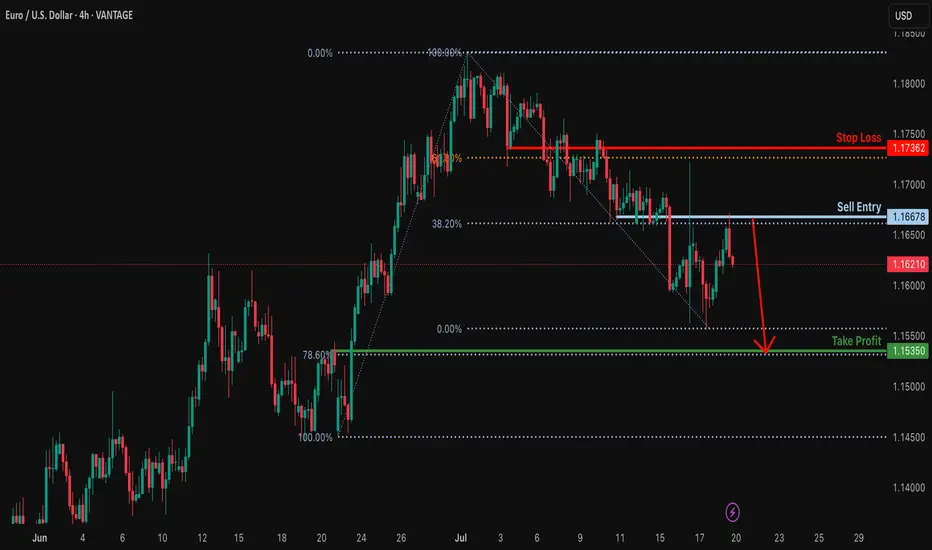
Bearish drop?EUR/USD has rejected off the resistance level which is a pullback resistance that lines up with the 38.2% Fibonacci retracement and could drop from this level to our tale profit.
Entry: 1.1667
Why we like it:
There is a pullback resistance that aligns with the 38.2% Fibonacci retracement.
Stop loss: 1.1736
Why we like it:
There is an overlap resistance that aligns with the 61.8% Fibonacci retracement.
Take profit: 1.1535
Why we like it:
There is a pullback support that lines up with the 78.6% Fibonacci retracement.
Enjoying your TradingView experience? Review us!
Please be advised that the information presented on TradingView is provided to Vantage (‘Vantage Global Limited’, ‘we’) by a third-party provider (‘Everest Fortune Group’). Please be reminded that you are solely responsible for the trading decisions on your account. There is a very high degree of risk involved in trading. Any information and/or content is intended entirely for research, educational and informational purposes only and does not constitute investment or consultation advice or investment strategy. The information is not tailored to the investment needs of any specific person and therefore does not involve a consideration of any of the investment objectives, financial situation or needs of any viewer that may receive it. Kindly also note that past performance is not a reliable indicator of future results. Actual results may differ materially from those anticipated in forward-looking or past performance statements. We assume no liability as to the accuracy or completeness of any of the information and/or content provided herein and the Company cannot be held responsible for any omission, mistake nor for any loss or damage including without limitation to any loss of profit which may arise from reliance on any information supplied by Everest Fortune Group.
BULLISH RUN ON EURUSD…When placing a parallel channel on the Daily timeframe on EU, it failed to breach through halfway of the channel. This means there’s not enough bullish momentum and therefore expecting a bearish signals at 1.18630

Week of 7/20/25: EURUSD AnalysisLast week's price action was bearish and has finally reached the extreme daily demand level and provided some reaction. Price has swept bulls and bears, so now we follow internal structure and wait to see where price actually wants to go. If internal 1h structure breaks bearish, we have confirmation to trade bearish until price goes deeper into the daily extreme zone.

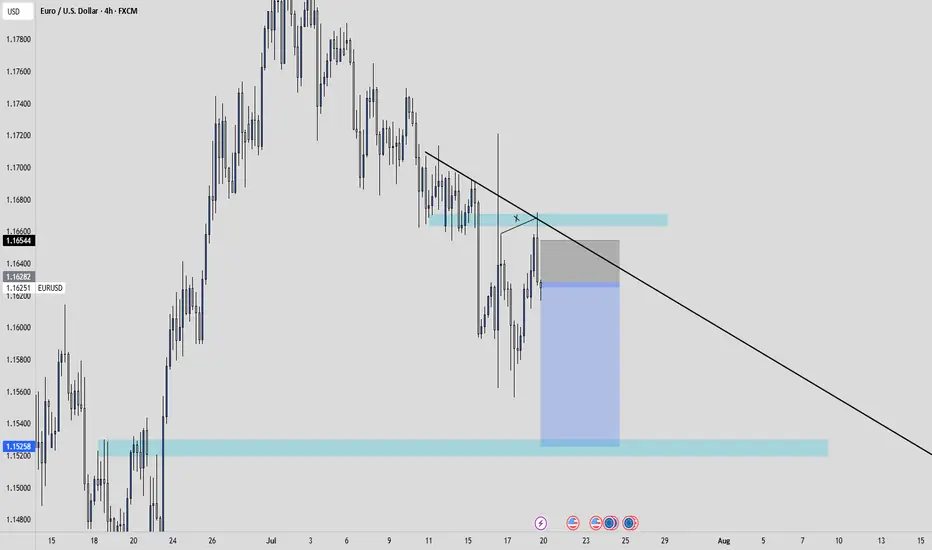
EURUSD - Bullish Bias with Tactical Short Setup• Pair: EURUSD
• Bias: Bullish overall | Tactical short into demand
• HTF Overview (4H):
• Bullish structure confirmed.
• Price took out SSL liquidity — likely draw is internal structure OB below.
• Expecting deeper pullback before continuation.
• MTF Refinement (30M):
• Looking for price to sell off into 4H OB.
• Price already mitigated 30M OB and rejected — watching for follow-through.
• LTF Confirmation (5M):
• Still in analysis mode — waiting on a CHoCH from 5M OB.
• Green lines on chart reflect 5M internal structure.
• Entry Zone:
• Enter short only after 5M shift confirms.
• Ride short into 4H OB demand zone.
• Targets:
• Short-term: 30M lows.
• Major: 4H OB for bullish reaction.
• Mindset Note:
• No rush to enter — analysis leads, execution follows.
• Let price deliver confirmation before switching to trader mode.
Bless Trading!

It has a good risk-reward ratio.Hello friends..
The transaction shown, if it reaches the specified area, you can enter the transaction in the lower time frame with confirmation.
Follow our page to see more analysis.
Eurusd sellStrong sell expected
Monthly and weekly overbought pair
Daily time frame buy trend break confirmation
Ready for the bearish correction
