EURUSD: overboughtFriday was a non-working day in the US, as the country was celebrating Independence Day. The most important weekly macro data was related to US jobs data. At the start of the week JOLTs job openings in May were posted with a figure of 7.769M, significantly higher from market estimate of 7,3M. The next day the NFPs and Unemployment rate was published. As per data, the unemployment rate dropped by 0,1pp to the level of 4,1%, which missed market expectations of 4,2%. The Non-farm payrolls in June added 147K new jobs, again better from forecasted 110K. The average hourly earnings were higher by 0,2% in June, or 3,7% on a yearly basis, modestly below the forecasted 3,9%. Other weekly macro data including ISM Manufacturing PMI in June reached 49,0 a bit higher from estimated 48,8. The ISM Services PMI in June was standing at 50,8 in line with market estimates.
Retail Sales in Germany dropped by an additional -1,6% in May, bringing the indicator to the level of +1,6% on a yearly basis. Both figures were lower from the market estimate of +0,5% for May and +3,3% for the year. Inflation rate in Germany preliminary in June was 2% a bit lower from forecasted 2,2%. Inflation for the month was standing at 0%. Preliminary inflation data for the Euro Zone in June was 0,3% for the month and 2% for the year. EuroZone core inflation was standing at 2,3% in June, exactly in line with market estimates. The unemployment rate in the Euro Zone in May was modestly increased by 0,1pp to the level of 6,3%, while the market was expecting to remain flat at 6,2%.
The US Dollar continued its decline against the euro during the previous week. The highest weekly level was at 1,1825, but the currency pair closed the week at 1,1776. The RSI reached the level of 73, signalling a clear overbought market side, increasing the probability of a short term reversal in the coming period. The MA50 continues to diverge from MA200, indicating low probability of a potential cross in the future period.
The eurusd daily chart is showing that the currency pair had formed a sort of channel with an uptrend during the past period. If lows from end of February, mid March and end of March are connected, the indication for a next potential level of eurusd might be somewhere above the 1,16 level. The 1,1620 was the highest level achieved in mid July this year, which aligns well with the previous indication. Indicators are currently showing higher probability of a short term reversal. The week ahead is not bringing any currently significant news with respect to the US economy, in which sense, it could be expected that the market will slow down a bit during the week. Short reversal is quite possible, where the level of 1,1620 might be shortly tested. Just in case that the market decides to continue movement toward the higher grounds, then 1,18 resistance will be tested, before the market continues its road toward the 1,19 level.
Important news to watch during the week ahead are:
EUR: Industrial Production in May in Germany, Retail Sales in the Euro Zone for May, Balance of Trade in Germany in May, Inflation rate final for May in Germany,
USD: FOMC Meeting minutes.
EURUSD trade ideas

EURUSD: Support & Resistance Analysis For Next Week 🇪🇺🇺🇸
Here is my recent structure analysis and important
supports and resistances for EURUSD for next week.
Consider these structures for pullback/breakout trading.
❤️Please, support my work with like, thank you!❤️
I am part of Trade Nation's Influencer program and receive a monthly fee for using their TradingView charts in my analysis.

EURUSD: New-Week Technical Bias (Market Open)Multi-Timeframe Structural Outlook:
Higher Timeframes (Monthly, Weekly, Daily):
Market structure remains in a clear Ascend Sequence, reflecting an intact Buy-Side Bias Environment (BBE). Price action continues to build bullish structure, supporting an overall upward lean.
Lower Timeframe Technical Snapshot:
4H & 1H:
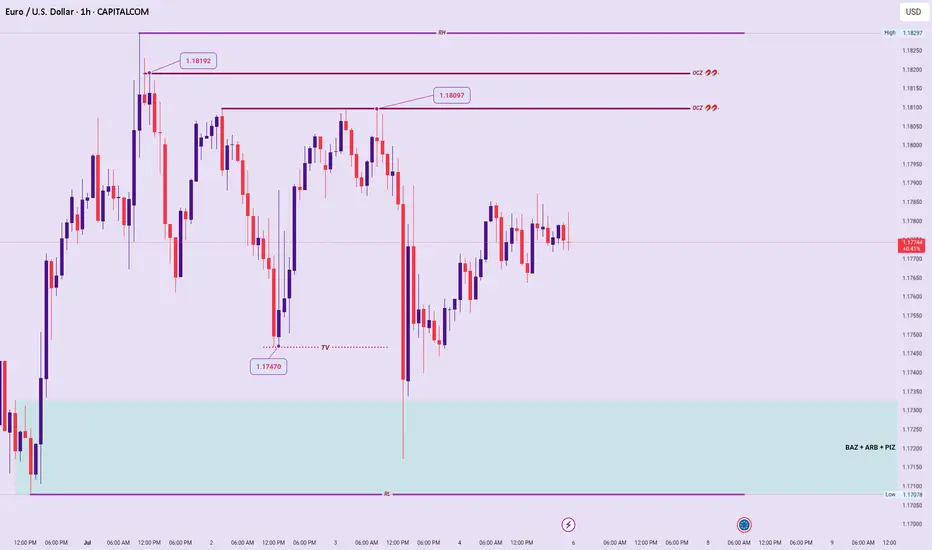
Current price consolidates within a well-defined Value Compression Phase (VCP) between 1.8297 – 1.7078, signaling temporary indecision and mixed short-term directional clarity.
Liquidity Mechanics & Trap Dynamics:
Recent Sweep Event targeting 1.7470 exploited a Trap Vector (TV), drawing price below perceived support to tap into underlying liquidity pockets within both a Price Inefficiency Zone (PIZ) and Bid Accumulation Zone (BAZ). Following this engineered sweep, price reversed, validating hidden bullish intent beneath the range.
Order Clustering Targets:
Expect clustered liquidity and potential price magnet zones at 1.8097 and 1.8192, representing logical upside attractions aligned with orderflow objectives.
Reaction Points:
VCP High (1.8297):
Break and sustained acceptance above signals potential Ascend Sequence continuation and broader bullish resumption.
VCP Low (1.7078):
Breakdown with intent below increases probability of a Trend Signature Shift (TSS), signaling bearish structure vulnerability and potential trend deterioration.
Summary:
Bullish on HT structures remains valid, but short-term bias is mixed pending confirmed resolution of the VCP range boundaries. Price behavior at the highs/lows of the compression zone will dictate next directional conviction.
Short EU next weekAs can see from chart EU is currently in a small down channel and now price rejected the upper channel with good pin bar formation. Sell this projected to the lower channel

EURUSDEUR/USD Exchange Rate
EUR/USD: 1.17735
The euro has strengthened against the US dollar, trading near its highest level since early 2024, supported by a softer DXY and stable Eurozone outlook.
10-Year Government Bond Yields
Region 10-Year Yield Date
Eurozone 2.560% July 5, 2025
United States 4.348% July 5, 2025
The US 10-year Treasury yield remains above the Eurozone’s, but the gap has narrowed in recent months.
Central Bank Policy Rates
Central Bank Policy Rate Last Change/Status
ECB 2.00% (Deposit Rate) Cut by 25 bps in June 2025
Federal Reserve 4.25%–4.50% Unchanged since Dec 2024
The ECB recently cut its deposit rate to 2.00% RFR 2.15% MLF 2.4%, its lowest in over two years, as inflation nears target and growth remains subdued.
The Fed has held its target range steady at 4.25%–4.50% since December 2024, with markets expecting possible cuts later in 2025 on cautious wait and see approach by feds
Rate and Yield Differentials
Metric US Eurozone Differential (US - Eurozone)
Policy Rate 4.25–4.50% 2.00% 2.25–2.50%
10-Year Bond Yield 4.35% 2.560% 1.79%
Yield Differential: The US 10-year yield exceeds the Eurozone’s by 1.79 percentage points, a key driver for capital flows and EUR/USD direction ,but strong euro zone economic outlook offset the yield and bond advantage giving the euro buy advantage .
Policy Rate Differential: The Fed’s policy rate is 2.25–2.50 percentage points higher than the ECB’s, though the gap is expected to narrow if the Fed cuts rates later this year.
Market Implications
EUR/USD: The narrowing yield and rate differentials have supported euro strength in recent weeks.
Bond Markets: US yields remain higher, but the Eurozone’s 10-year yield is at a multi-year high, reflecting persistent inflation and reduced ECB accommodation.
Central Bank Outlook: Both the Fed and ECB are expected to remain data-dependent, with further easing possible if economic conditions warrant.
The euro is currently strong against the dollar, with narrowing rate and yield differentials reflecting shifting monetary policy expectations and global economic condition.
#eurusd

EUR/USD technical and fundamental analysis for next 2 days.Hello Traders,
This whole analysis is based on 1 hour time frame.
Indicators used for technical analysis:
EMA
RSI
VWAP anchor
Volume Profile
Fibonacci retracement and extension
In 1 hour time frame price is forming an ascending triangle which is likely to break out as EMA, and vwap are signalling bullish momentum.
If price breaks resistance at $1.17832 its likely to go up till $1.18100.
RSI is in the middle so it has ample room to move in both directions, So if trend line support breaks the price might move downwards to the support level at &1.17628 but the probability of this is very low.
Volume profile is highlighting the current price with the most volume so it makes it a critical point for movement in any direction.
Fundamental Analysis:
The Fed (US Central Bank) is getting soft: On July 9th, we'll see notes from their last meeting. They're expected to sound pretty dovish, which just means they're worried about the US economy and might cut interest rates soon.
Trump's Tariffs are back (July 9th deadline): If he puts new taxes on imported goods, it makes global trade messy and creates a lot of worry about the US economy. When people worry about the US, they tend to sell US Dollars.
The Dollar is already weak & It's already been losing strength.
Because the US Dollar is set to get a lot weaker from those big events on July 9th, and the Euro is holding steady, the EUR/USD is very likely to tilt UP.
Remember trading is a game of probability and this analysis could go wrong but technical and fundamental analysis are suggesting strong bullish movement.

EURUSDEUR/USD Exchange Rate
EUR/USD: 1.17735
The euro has strengthened against the US dollar, trading near its highest level since early 2024, supported by a softer DXY and stable Eurozone outlook.
10-Year Government Bond Yields
Region 10-Year Yield Date
Eurozone 2.560% July 5, 2025
United States 4.348% July 5, 2025
The US 10-year Treasury yield remains above the Eurozone’s, but the gap has narrowed in recent months.
Central Bank Policy Rates
Central Bank Policy Rate Last Change/Status
ECB 2.00% (Deposit Rate) Cut by 25 bps in June 2025
Federal Reserve 4.25%–4.50% Unchanged since Dec 2024
The ECB recently cut its deposit rate to 2.00% RFR 2.15% MLF 2.4%, its lowest in over two years, as inflation nears target and growth remains subdued.
The Fed has held its target range steady at 4.25%–4.50% since December 2024, with markets expecting possible cuts later in 2025 on cautious wait and see approach by feds
Rate and Yield Differentials
Metric US Eurozone Differential (US - Eurozone)
Policy Rate 4.25–4.50% 2.00% 2.25–2.50%
10-Year Bond Yield 4.35% 2.560% 1.79%
Yield Differential: The US 10-year yield exceeds the Eurozone’s by 1.79 percentage points, a key driver for capital flows and EUR/USD direction ,but strong euro zone economic outlook offset the yield and bond advantage giving the euro buy advantage .
Policy Rate Differential: The Fed’s policy rate is 2.25–2.50 percentage points higher than the ECB’s, though the gap is expected to narrow if the Fed cuts rates later this year.
Market Implications
EUR/USD: The narrowing yield and rate differentials have supported euro strength in recent weeks.
Bond Markets: US yields remain higher, but the Eurozone’s 10-year yield is at a multi-year high, reflecting persistent inflation and reduced ECB accommodation.
Central Bank Outlook: Both the Fed and ECB are expected to remain data-dependent, with further easing possible if economic conditions warrant.
The euro is currently strong against the dollar, with narrowing rate and yield differentials reflecting shifting monetary policy expectations and global economic condition.
#eurusd

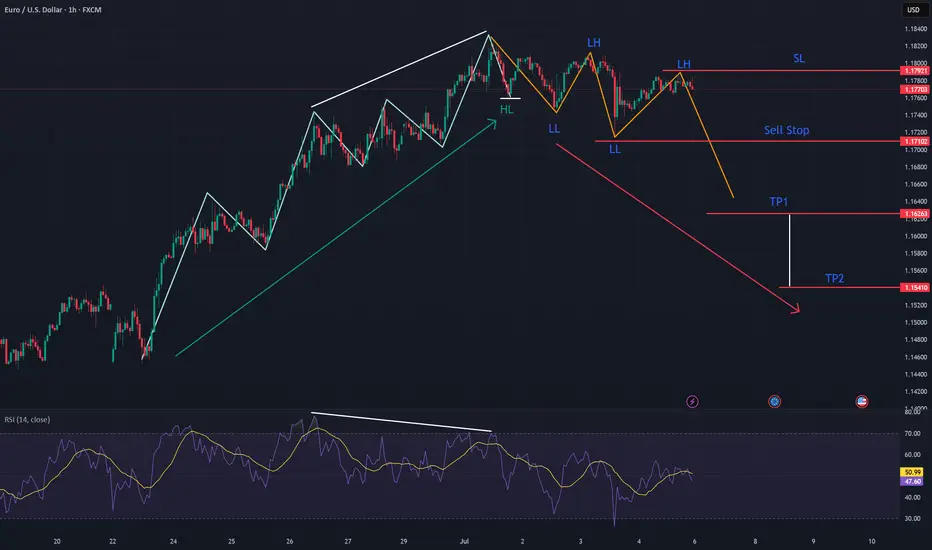
EURUSD: Potential Trend Reversal BrewingEURUSD is exhibiting clear signs of a potential trend reversal, having recently broken its previous Higher Low and subsequently establishing a sequence of Lower Highs and Lower Lows. This shift in market structure from bullish to bearish is a strong indicator of weakening upside momentum. Further confirming this outlook, the RSI is displaying a notable bearish divergence, where price registers higher highs while the RSI prints lower highs, signaling diminishing bullish strength at these elevated price levels. Considering this confluence of technical factors, a potential short setup is present.
EURUSD: Short Signal Explained
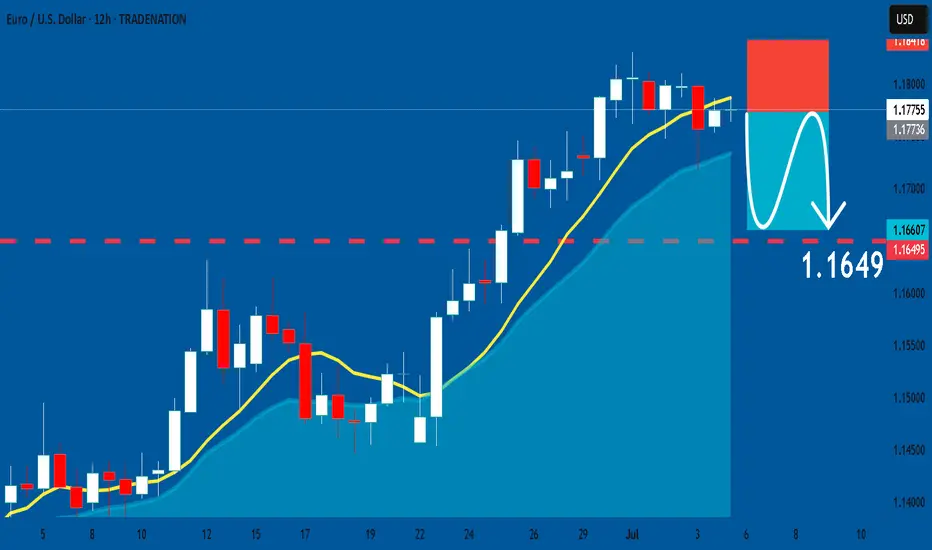
EURUSD
- Classic bearish formation
- Our team expects fall
SUGGESTED TRADE:
Swing Trade
Sell EURUSD
Entry Level - 1.1775
Sl - 1.1841
Tp - 1.1649
Our Risk - 1%
Start protection of your profits from lower levels
Disclosure: I am part of Trade Nation's Influencer program and receive a monthly fee for using their TradingView charts in my analysis.
❤️ Please, support our work with like & comment! ❤️
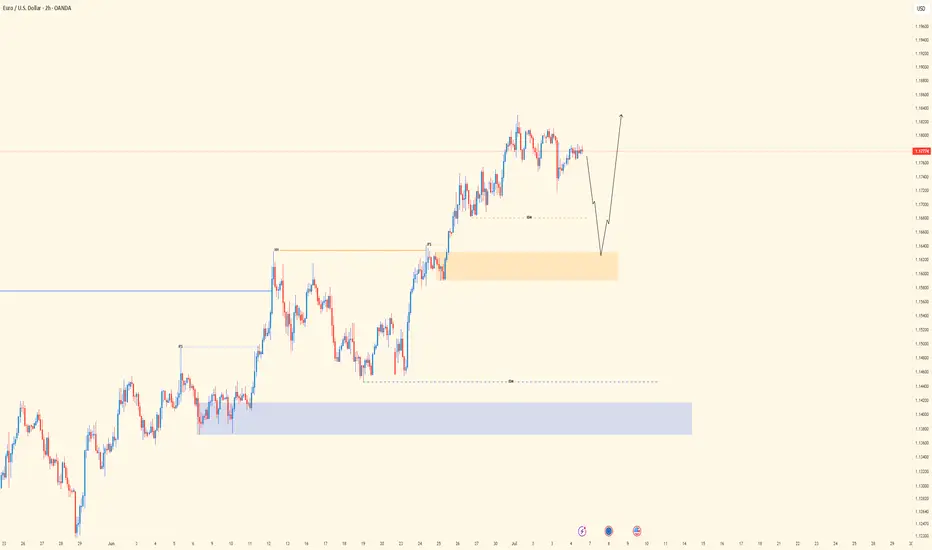
Euro can rebound up from support area to 1.1860 pointsHello traders, I want share with you my opinion about Euro. In this chart, we can see how the price has been moving confidently inside an upward channel after breaking out of a wedge formation. Previously, price consolidated within a narrowing wedge pattern above the buyer zone and broke upward, showing strong bullish momentum. That breakout initiated the current uptrend and led to the formation of a new support area. Now, price is pulling back from the resistance line of the channel and approaching this support area, which also coincides with the support line of the channel. This confluence increases the probability of a bullish reaction in this region. The structure suggests that buyers may step in around this level, preventing a deeper retracement. If the pair bounces off the support zone, I expect a continuation of the uptrend toward the upper boundary of the channel. For that reason, I set my TP at 1.1860 points, almost aligning with the resistance line of the channel. Given the current price action, the bullish structure, and strong reaction levels, I remain bullish and anticipate a rebound followed by further growth toward my target. Please share this idea with your friends and click Boost 🚀
Disclaimer: As part of ThinkMarkets’ Influencer Program, I am sponsored to share and publish their charts in my analysis.

EUR/USD breakout awaiting EUR/USD has not provided a clear structure over the past week or two. The pair appears to be in consolidation, building liquidity on both sides of the current range. At the moment, I’m waiting for a decisive breakout, ideally followed by distribution within the monthly supply zone, although that zone is still some distance away.
This week, my focus will be on whether a new supply zone forms, closer to current price. If price sweeps the nearby equal highs and then shows signs of reversal, this could give us a fresh supply area to work from. Alternatively, if price moves lower, I’ll be looking at the 8-hour demand zone around 1.16000 for a possible long setup.
Confluences for EUR/USD:
- Although price has been slightly bullish, the current consolidation phase suggests a potential reversal could be on the horizon.
- Liquidity is building on both sides of the range, making a reaction from the monthly supply zone increasingly probable.
- There’s significant downside liquidity still untapped, such as Asia session lows, which could serve as short-term targets.
- For clearer confirmation, we still need a decisive break in market structure to the downside.
P.S. If price sweeps the lower liquidity and moves into the 8-hour demand zone near 1.16000, I will be watching for accumulation to form and signs of bullish intent from there.

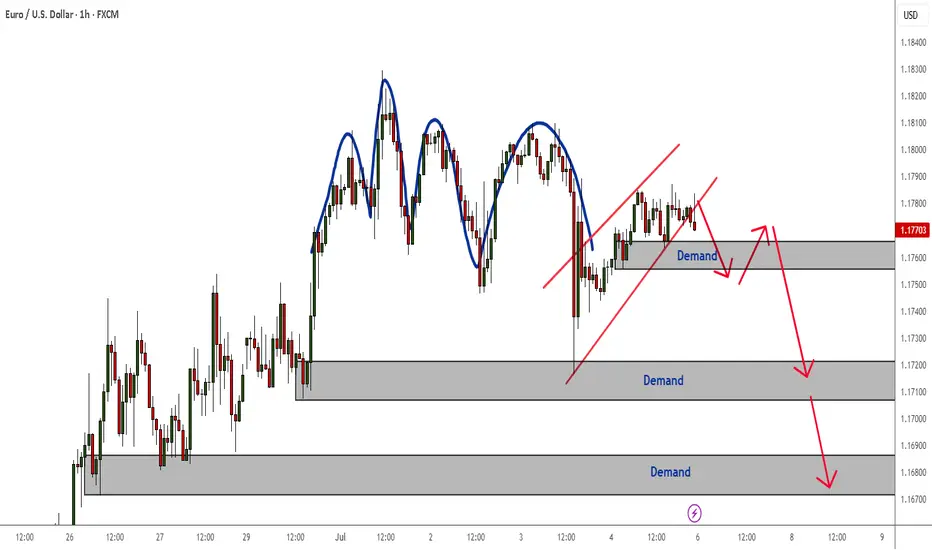
EURUSD Quadruple Top Rejection Pattern - Bearish Correction This quadruple top rejection pattern on the H1 timeframe is currently in play and it is a strong indication or confirmation that the bearish correction will likely resume next week.
If you are unsure when to enter short positions for this trade setup, wait for a demand zone to break, followed by a pullback and continue to ride the bearish momentum and target the next demand zone, and the next and so on and so forth until a time when this correction ends and the uptrend continues.
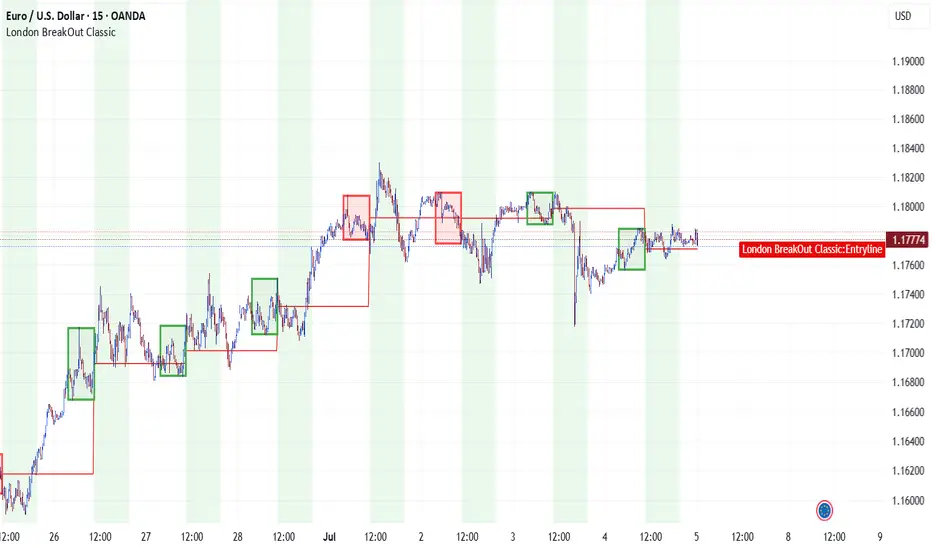
bull eurusdKey elements:
Trade signal: BUY entry at 1.17721 with target 1.17824
Strategy: "London BreakOut Classic"
Price levels: 15 key USD levels from 1.26000 (highest) to 1.00400 (lowest)
Current price: 1.17721 (highlighted in the list)
Need analysis or explanations? Let me know! 💹
EUR/USD Daily Chart Analysis For Week of July 4, 2025Technical Analysis and Outlook:
During the trading session this week, we witnessed the successful completion of the Outer Currency Rally at a level of 1.177. Recent analyses suggest that the Euro is likely to encounter a downward trend, with an initial target set at the Mean Support level of 1.168 and a potential extension to an additional Mean Support of 1.160. Nevertheless, it is crucial to acknowledge the possibility of a subsequent increase toward the next Outer Currency Rally level of 1.187 before any definitive downward movement transpires.

EurusdThe market is currently on a trending market on daily timeframe so we trade from one swing point to another swing point. On the four hours timeframe the market condition is yet to validate on sell signal so we wait for that maybe it will happen

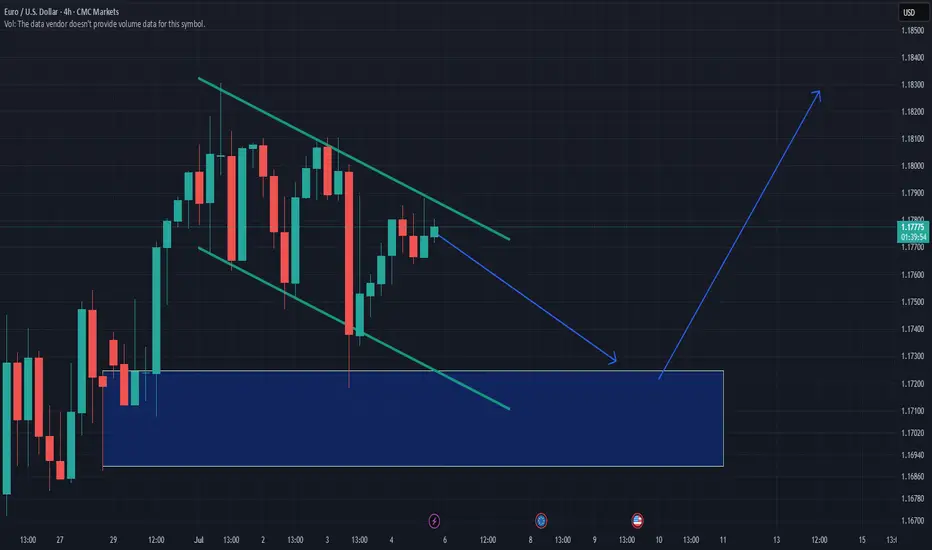
EURUSD - Where next?Looking at EURUSD
I still feel like we are due some sort of deeper retracement to the downside considering how bullish the 4H and Daily time frame have been in recent times.
Although the market does not care how I feel in all honesty haha. I will play the short term short until the 15min orderflow switches bullish once again.
The expansion that is currently happing right now is very interesting and makes a good watch to see what we will do come market open as we are engineering liquidity for both a buy and sell with both POI's looking primed for entries.
Will be keeping a close and keen eye on EURUSD when the market opens
Any questions feel free to give me a message

EURUSD ObservationCurrent status of EURUSD:
From the daily chart, it has diverged twice
It is no longer suitable to continue buying
Switch to a smaller period, like 4 hours, or 1 hour.
In fact, the hour head structure has appeared.
If it meets your entry criteria, you can try shorting
EURUSD facing resistance at upper channel line-consolidatingEURUSD facing resistance at upper channel line-consolidating at narrow zone

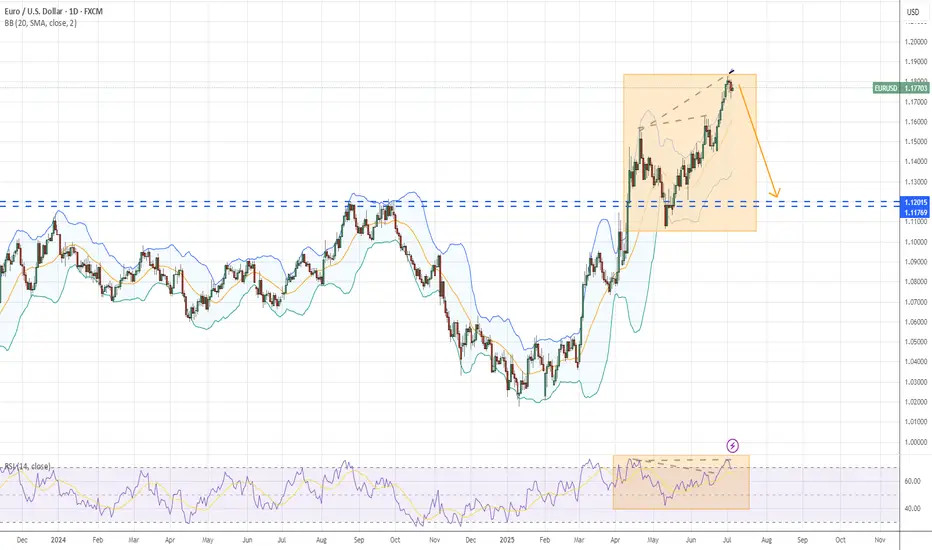
EURUSD - End of the bull trend? Entering in a Range or a Bear?EURUSD is reaching a channel line on the weekly chart and it already showed us that traders are watching it.
Last week we had a very strong and climatic bull move, indicating bears were off, possibly waiting for the market to reach this level. Now that we reached it, we have a weekly candle with a long upper tail, indicating bulls taking profit and bears coming in.
The market is also overextended from the 20 EMA and a longer pullback looks reasonable and healthy at this point.
Let's see what happens in the next few weeks. But anyway, whoever made money on this bull trend is now shifting to a more cautious perspective. A pullback to the EMA is likely this year, since we didn't touch it since March 2025.

EU| - Bullish Structure Intact | Watching for SSL Sweep and RunPair: EURUSD
Bias: Bullish
Timeframes: 4H, 2H, LTFs
• 4H structure is clean and bullish — momentum’s been steady, and the market looks ready to ride higher going into next week.
• 2H gives clarity — I’m watching for a sweep of SSL into OB to set the stage for LTF confirmation.
• Entry process remains the same: wait for CHoCH, followed by sweep inside the OB zone.
🔹 Entry: After CHoCH + sweep inside OB (LTF process repeated)
🔹 Entry Zone: After confirmation within OB
🔹 Target: Structure highs — letting price unfold with the trend
Mindset: Patience pays the most. Wait for the market to come to you, not the other way around.
Bless Trading!
EURUSD 30Min Engaged ( Bullish Entry Detected )➕ Objective: Precision Volume Execution
Time Frame: 30-Minute Warfare
Entry Protocol: Only after volume-verified breakout
🩸 Bullish Wave Coming From : 1.17400
➗ Hanzo Protocol: Volume-Tiered Entry Authority
➕ Zone Activated: Dynamic market pressure detected.
The level isn’t just price — it’s a memory of where they moved size.
Volume is rising beneath the surface — not noise, but preparation.
🔥 Tactical Note:
We wait for the energy signature — when volume betrays intention.
The trap gets set. The weak follow. We execute.
EURUSD 30Min Engaged ( Bullish Entry Detected )

EURUSD Return to Order Block, AscendWould not be surprised to see early next week a small return to this order block before next rally.
Impulse completed?EUR/USD maintains its bullish trend intact after a sharp rally last week. The pair keeps consolidating gains as the 4-hour Relative Strength Index pulls back from overbought levels and price action is constrained within a 70-pip range, right below a nearly four-year high at 1.1750.
Today, price hit upside target at the 161.8% Fibonacci extension level of the June 10-12 rally at 1.1795. I Think we might see a correction for the eurusd as the impulse seems to be completed.
