EUR/USD - Final Push Before Collapse?This EUR/USD daily chart highlights a bearish setup within a weakening rising wedge.
A Change of Character (CHoCH) confirms a potential shift in structure as price pushes toward buy-side liquidity above previous highs—where retail stops are likely resting.
Once this liquidity is swept, smart money is expected to reverse price sharply, breaking wedge support. The projected move targets the 1.03 zone, representing a 7% drop, aligning with internal liquidity and a return to the discount zone.
This setup illustrates classic SMC behavior: liquidity grabs, structural shifts, and institutional unloading before a major move.
EUR/USD – Final Push Before Collapse?
EURUSD trade ideas

Trading Divergences With Wedges in ForexTrading Divergences With Wedges in Forex
Divergence trading in forex is a powerful technique for analysing market movements, as is observing rising and falling wedges. This article explores the synergy between divergence trading and wedges in forex, offering insights into how traders can leverage these signals. From the basics to advanced strategies, learn how you could utilise this approach effectively, potentially enhancing your trading skills in the dynamic forex market.
Understanding Divergences
In forex trading, the concept of divergence plays a pivotal role in identifying potential market shifts. A divergence in forex, meaning a situation where price action and a technical indicator like the Relative Strength Index (RSI) or Moving Average Convergence Divergence (MACD) move in opposite directions, often signals a weakening trend. This discrepancy is a valuable tool in divergence chart trading, as it may indicate a possible reversal or continuation of the current trend.
There are two primary types of divergence in forex—regular and hidden. Regular divergence occurs when the price makes higher highs or lower lows while the indicator does the opposite, often signalling a reversal. Hidden divergence, on the other hand, happens when the price makes lower highs or higher lows while the indicator shows higher highs or lower lows, typically suggesting a continuation of the current trend.
Trading Rising and Falling Wedges
Rising and falling wedges are significant patterns in forex trading, often signalling potential trend reversals. A rising wedge, formed by converging upward trendlines, often indicates a bearish reversal if it appears in an uptrend. Conversely, a falling wedge, characterised by converging downward trendlines, typically reflects a bullish reversal if it occurs in a downtrend.
Traders often look for a breakout from these patterns as a signal to enter trades. For rising wedges, a downward breakout can be seen as a sell signal, while an upward breakout from a falling wedge is often interpreted as a buy signal. When combined with divergences, this chart pattern can add confirmation and precede strong movements.
Best Practices for Trading Divergences
Trading divergence patterns in forex requires a keen eye for detail and a disciplined, holistic approach. Here are key practices for effective trading:
- Comprehensive Analysis: Before trading on divergence and wedges, be sure to analyse overall market conditions.
- Selecting the Right Indicator: Choose a forex divergence indicator that suits your trading style. Common choices include RSI, MACD, and Stochastic.
- Confirmation Is Key: It’s best to watch for additional confirmation from price action or other technical tools before entering a trade.
- Risk Management: Traders always set stop-loss orders to manage risk effectively. Divergence trading isn't foolproof; protecting your capital is crucial.
- Patience in Entry and Exit: Be patient as the divergence develops and confirm with your chosen indicators before entering or exiting a trade.
Strategy 1: RSI and Wedge Divergence
Traders focus on regular divergence patterns when the RSI is above 70 (overbought) or below 30 (oversold), combined with a rising or falling wedge pattern. The strategy hinges on identifying highs or lows within these RSI extremes. It's not crucial if the RSI remains consistently overbought or oversold, or if it fluctuates in and out of these zones.
Entry
- Traders may observe a regular divergence where both the price highs/lows and RSI readings are above 70 or below 30.
- After the formation of a lower high (in an overbought zone) or a higher low (in an oversold zone) in the RSI, traders typically watch as the RSI crosses back below 70 or above 30. This is accompanied by a breakout from a rising or falling wedge, acting as a potential signal to enter.
Stop Loss
- Stop losses might be set just beyond the high or low of the wedge.
Take Profit
- Profit targets may be established at suitable support/resistance levels.
- Another potential approach is to exit when the RSI crosses back into the opposite overbought/oversold territory.
Strategy 2: MACD and Wedge Divergence
Regarded as one of the best divergence trading strategies, MACD divergence focuses on the discrepancy between price action and the MACD histogram. The strategy is particularly potent when combined with a rising or falling wedge pattern in price.
Entry
- Traders typically observe for the MACD histogram to diverge from the price. This divergence manifests as the price reaching new highs or lows while the MACD histogram fails to do the same.
- The strategy involves waiting for the MACD signal line to cross over the MACD line in the direction of the anticipated reversal. This crossover should coincide with a breakout from the rising or falling wedge.
- After these conditions are met, traders may consider entering a trade in anticipation of a trend reversal.
Stop Loss
- Stop losses may be set beyond the high or low of the wedge, which may help traders manage risk by identifying a clear exit point if the anticipated reversal does not materialise.
Take Profit
- Profit targets might be established at nearby support or resistance levels, allowing traders to capitalise on the expected move while managing potential downside.
Strategy 3: Stochastic and Wedge Divergence
Stochastic divergence is a key technique for divergence day trading in forex, especially useful for identifying potential trend reversals. This strategy typically employs the Stochastic Oscillator with settings of 14, 3, 3.
Entry
- Traders may look for divergence scenarios where the Stochastic readings are above 80 or below 20, mirroring the RSI approach.
- This divergence is observed in conjunction with price action, forming a rising or falling wedge.
- Entry may be considered following a breakout from the wedge, which signals a potential shift in market direction.
Stop Loss
- Setting stop losses just beyond the high or low of the wedge might be an effective approach.
Take Profit
- Profit targets may be set at key support/resistance levels.
The Bottom Line
Divergence trading, coupled with the analysis of rising and falling wedges, offers a comprehensive approach to navigating the forex market. By integrating the discussed strategies with sound risk management and market analysis, traders may potentially enhance their ability to make informed decisions in the dynamic world of forex.
This article represents the opinion of the Companies operating under the FXOpen brand only. It is not to be construed as an offer, solicitation, or recommendation with respect to products and services provided by the Companies operating under the FXOpen brand, nor is it to be considered financial advice.

BUY EURUSD now for 4h time frame bullish trend continuation BUY EURUSD now for 4h time frame bullish trend continuation ...............
STOP LOSS: 1.1615
This buy trade setup is based on hidden bullish divergence trend continuation trading pattern ...
Always remember, the trend is your friend, so whenever you can get a signal that the trend will continue, then good for you to be part of it
TAKE PROFIT : take profit will be when the trend comes to an end, feel from to send me a direct DM if you have any question about take profit or anything...
Remember to risk only what you are comfortable with... trading with the trend, patient and good risk management is the key to success here

EUR/USD Rises to 2.5-Week High Ahead of ECB MeetingEUR/USD Rises to 2.5-Week High Ahead of ECB Meeting
Today at 15:15 GMT+3, the European Central Bank (ECB) will announce its interest rate decision, followed by a press conference at 15:45 GMT+3. According to Forex Factory, the main refinancing rate is expected to remain unchanged at 2.15% after seven consecutive cuts.
In anticipation of these events, the EUR/USD exchange rate has risen above the 1.1770 level for the first time since 7 July. Bullish sentiment is also being supported by expectations of a potential trade agreement between the United States and the European Union. According to Reuters, both sides are reportedly moving towards a deal that may include a 15% base tariff on EU goods entering the US, with certain exemptions.
Technical Analysis of the EUR/USD Chart
From a technical perspective, the EUR/USD pair has shown bullish momentum since June, resulting in the formation of an ascending channel (marked in blue).
Within this channel, the price has rebounded from the lower boundary (highlighted in purple), although the midline of the blue channel appears to be acting as resistance (as indicated by the arrow), slowing further upward movement.
It is reasonable to assume that EUR/USD may attempt to stabilise around the midline—where demand and supply typically reach equilibrium. However, today’s market is unlikely to remain calm. In addition to the ECB’s statements, volatility could be heightened by news surrounding Donald Trump’s unexpected visit to the Federal Reserve.
This article represents the opinion of the Companies operating under the FXOpen brand only. It is not to be construed as an offer, solicitation, or recommendation with respect to products and services provided by the Companies operating under the FXOpen brand, nor is it to be considered financial advice.
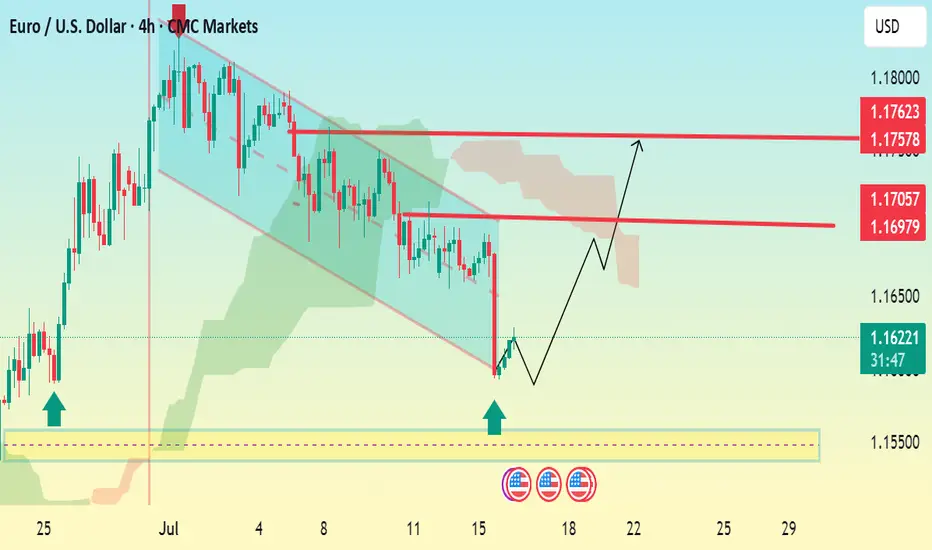
EUR/USD 4H Bullish Reversal Setup Analysis:The chart shows a falling wedge pattern, a typical bullish reversal signal.
Price has broken out of the wedge, suggesting a potential trend reversal to the upside.
Two strong demand zones (highlighted with blue arrows and yellow box) show strong buying pressure around 1.15500–1.15700.
The Ichimoku Cloud above indicates resistance, but a breakout above it would confirm continued bullish momentum.
Key Levels:
Current Price: 1.16171
Immediate Resistance: 1.16979
Next Targets (TP):
TP1: 1.17057
TP2: 1.17578
TP3: 1.17623
Support Zone: 1.15500 – 1.15700
Conclusion: If the price holds above the 1.15700 support zone and sustains momentum above the wedge breakout, expect bullish continuation toward 1.17500+. Ideal long setup on retracement with tight SL below 1.15500.
EURUSD will break the resistance ?EURUSD now facing a resistance level which was its support earlier and is now consolidating and soon may resume to higher price with target around 1.82.

eurusd upin my pov euro dollar is going up, first instance until 1.1670 then 1.1730 after that maybe until 1.18 oreven 1.19

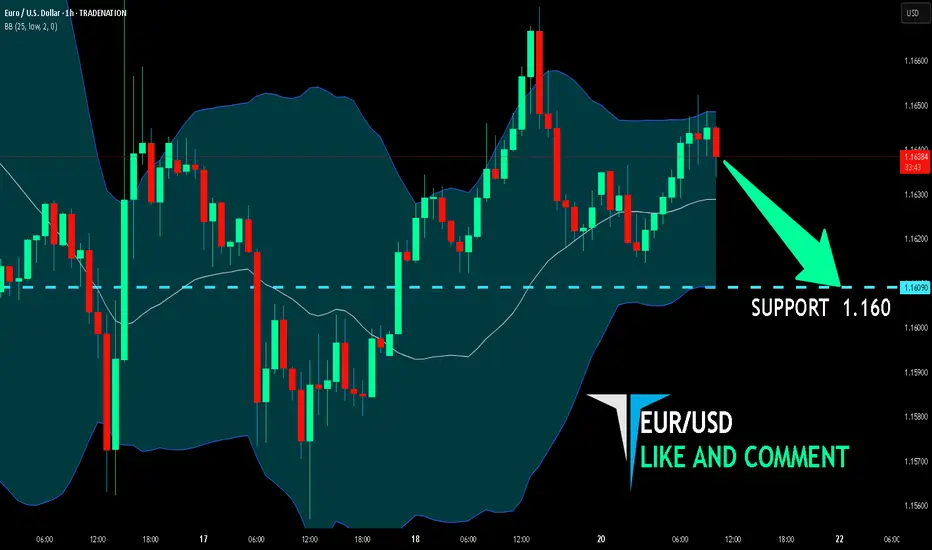
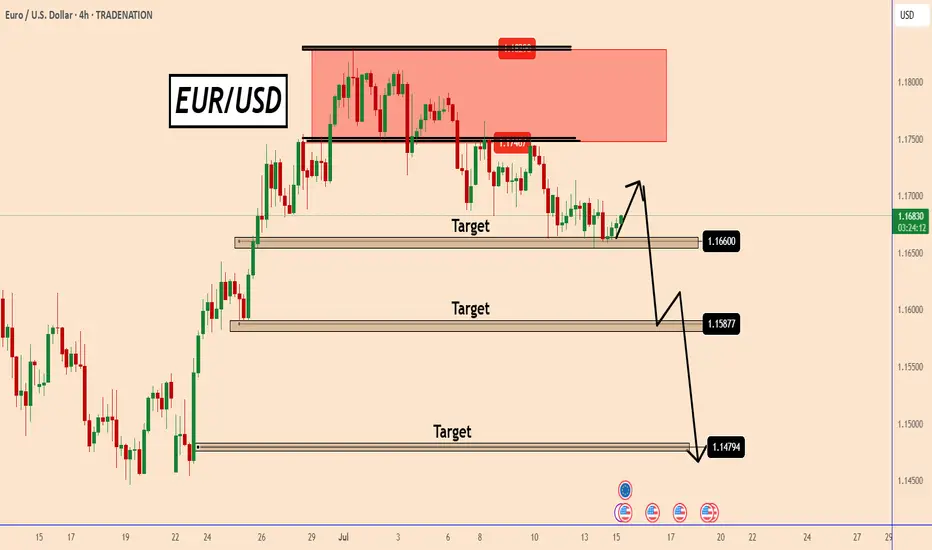
EUR/USD BEST PLACE TO SELL FROM|SHORT
Hello, Friends!
EUR/USD is making a bullish rebound on the 1H TF and is nearing the resistance line above while we are generally bearish biased on the pair due to our previous 1W candle analysis, thus making a trend-following short a good option for us with the target being the 1.160level.
Disclosure: I am part of Trade Nation's Influencer program and receive a monthly fee for using their TradingView charts in my analysis.
✅LIKE AND COMMENT MY IDEAS✅
EURUSD FOUND SUPPORT, READY TO BREAK THE CHANNELEURUSD FOUND SUPPORT, READY TO BREAK THE CHANNEL🔥
EURUSD has been trading within the descending channel since the beginning of the descending channel. Recently the price reached the major trendline, graph started to show the bullish divergence on the RSI .
What is a bullish divergence?
A technical analysis pattern where the price makes lower lows, but a momentum indicator (e.g., RSI, MACD) forms higher lows, signaling weakening bearish momentum and a potential trend reversal upward.
So, another hike in this pair is expected. Possible direction: spike towards the SMA200, minor pullback and a further development of the bullish impulse.

EURUSD: Bigger Bearish Move is PossibleEURUSD: Bigger Bearish Move is Possible
EURUSD is positioned to fall further from the bearish pattern it is showing. The market is hesitant to fall further after we get the CPI data today. The US is expected to report a growth of 2.7% vs. 2.4% last month.
The impact of the data is unclear in my opinion because the market is not paying much attention to the data, but it should definitely increase the market volume which is decreasing in these summer days.
You may find more details in the chart!
Thank you and Good Luck!
PS: Please support with a like or comment if you find this analysis useful for your trading day
Disclosure: I am part of Trade Nation's Influencer program and receive a monthly fee for using their TradingView charts in my analysis.
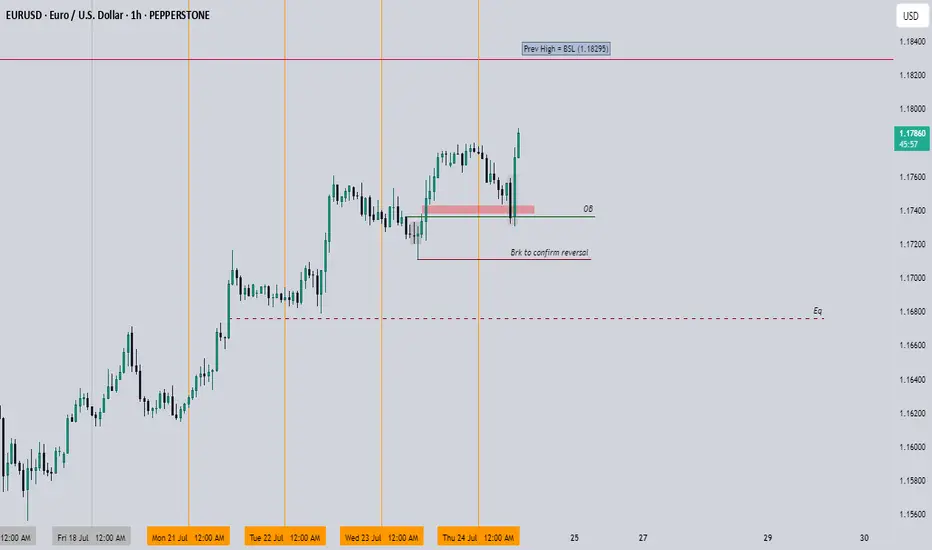
EURUSD Looking bullish in all areasI think now it is safe to say we know where EURUSD is heading to, I am looking for a sweep above the 1.18295 level
Trade Cautiously
EURUSD Will Go Down! Short!
Please, check our technical outlook for EURUSD.
Time Frame: 3h
Current Trend: Bearish
Sentiment: Overbought (based on 7-period RSI)
Forecast: Bearish
The price is testing a key resistance 1.161.
Taking into consideration the current market trend & overbought RSI, chances will be high to see a bearish movement to the downside at least to 1.155 level.
P.S
Please, note that an oversold/overbought condition can last for a long time, and therefore being oversold/overbought doesn't mean a price rally will come soon, or at all.
Disclosure: I am part of Trade Nation's Influencer program and receive a monthly fee for using their TradingView charts in my analysis.
Like and subscribe and comment my ideas if you enjoy them!

Bullish momentum to extend?The Fiber (EUR/USD) is reacting off the pivot which is a pullback support that aligns with the 61.8% Fibonacci retracement and could bounce to the 1st resistance.
Pivot: 1.1584
1st Support: 1.1448
1st Resistance: 1.1809
Risk Warning:
Trading Forex and CFDs carries a high level of risk to your capital and you should only trade with money you can afford to lose. Trading Forex and CFDs may not be suitable for all investors, so please ensure that you fully understand the risks involved and seek independent advice if necessary.
Disclaimer:
The above opinions given constitute general market commentary, and do not constitute the opinion or advice of IC Markets or any form of personal or investment advice.
Any opinions, news, research, analyses, prices, other information, or links to third-party sites contained on this website are provided on an "as-is" basis, are intended only to be informative, is not an advice nor a recommendation, nor research, or a record of our trading prices, or an offer of, or solicitation for a transaction in any financial instrument and thus should not be treated as such. The information provided does not involve any specific investment objectives, financial situation and needs of any specific person who may receive it. Please be aware, that past performance is not a reliable indicator of future performance and/or results. Past Performance or Forward-looking scenarios based upon the reasonable beliefs of the third-party provider are not a guarantee of future performance. Actual results may differ materially from those anticipated in forward-looking or past performance statements. IC Markets makes no representation or warranty and assumes no liability as to the accuracy or completeness of the information provided, nor any loss arising from any investment based on a recommendation, forecast or any information supplied by any third-party.

EUR/USD Elliott Wave Update –Classic Wave 5 Breakout OpportunityThis chart of the EUR/USD pair shows a well-structured Elliott Wave impulse pattern unfolding on the 4-hour timeframe. The price action is currently progressing in the final Wave (5) of the impulse cycle, which typically represents the last bullish leg before a larger correction begins.
Wave (1): The initial move up from the bottom (early May), showing a clean 5-wave internal structure.
Wave (2): A healthy retracement after Wave 1, forming a base for further upside.
Wave (3): The strongest and steepest rally, as expected in Elliott theory. It broke past previous highs and extended sharply.
Wave (4): A corrective phase that formed a falling wedge pattern — typically a bullish continuation pattern.
Wave (5): Currently in progress. The wedge has broken to the upside, confirming the potential start of Wave 5.
Target 1 (T1): 1.18306
Target 2 (T2): 1.19012
Stop Loss (SL): 1.16600
After a strong uptrend, the market went sideways in a wedge pattern (a typical wave 4 behavior). It has now broken out, signaling the start of the final wave 5 move. This is often a strong and sharp push. Since the breakout is clean and the Elliott wave count aligns well, this creates a favorable long opportunity

EURUSD Bullish ProjectionIt’s been a while since my last update here.
Here’s my projection and actual entry/entries on EURUSD, based on a sweep of the previous 1H swing low and mitigation of a Daily imbalance (Fair Value Gap).
We're anticipating a full Change of Character to mark the end of the ongoing Daily pullback.

EURUSD Will the 1D MA50 hold?The EURUSD pair seems to be rebounding just before a 1D MA50 (blue trend-line) test, which is its short-term Support. At the same time it bounced off the 0.382 Fibonacci retracement level, which after a +6.92% rise, it resembles the March 27 rebound.
The 1D RSI is printing a standard bullish reversal setup, seen already 4 times since February, and a break above its MA will confirm it.
As long as the 1D MA50 holds, it may extend the uptrend to a new Channel Up (dashed), outside the blue one that may look for a new +6.92% rise. In that case our Target will be 1.21000.
If the 1D MA50 breaks, we will add one last buy at 1.14000, near the 1D MA100 (green trend-line).
-------------------------------------------------------------------------------
** Please LIKE 👍, FOLLOW ✅, SHARE 🙌 and COMMENT ✍ if you enjoy this idea! Also share your ideas and charts in the comments section below! This is best way to keep it relevant, support us, keep the content here free and allow the idea to reach as many people as possible. **
-------------------------------------------------------------------------------
Disclosure: I am part of Trade Nation's Influencer program and receive a monthly fee for using their TradingView charts in my analysis.
💸💸💸💸💸💸
👇 👇 👇 👇 👇 👇

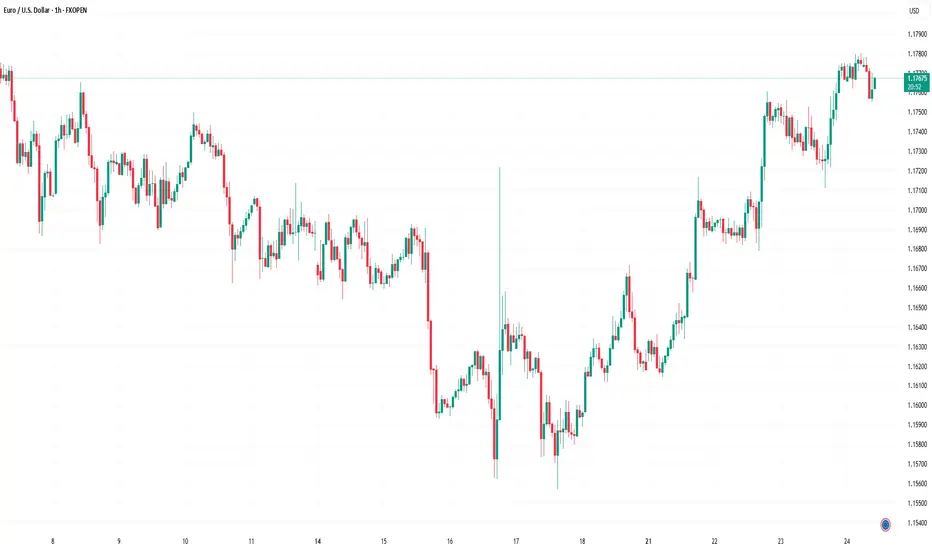
EURUSD SELLEUR/USD stays defensive below 1.1800 ahead of ECB decision
EUR/USD remains in a bullish consolidation mode below 1.1800 in European trading on Thursday. Traders refrain from placing fresh bets ahead of the European Central Bank policy announcements and the US preliminary PMI data. Mixed PMI data from Germany and the Eurozone failed to trigger a noticeable reaction.
The EUR/USD pair retreated from a fresh two-week peak at 1.1781 posted during Asian trading hours, hovering around 1.1750 ahead of the European Central Bank (ECB) monetary policy announcement. The US Dollar (USD) edged lower on the back of risk appetite, amid headlines indicating a trade deal between Japan and the United States (US).
US President Donald Trump announced in a post on social media a trade deal with Japan that sets "reciprocal" tariffs at 15% on Tuesday, while Japanese Prime Minister Shigeru Ishiba acknowledged the trade agreement on Wednesday, saying it would benefit both sides. Trump shifted his attention to the European Union (EU), noting that if the Union agrees to open up to US businesses, he will then charge lower levies.
Meanwhile, the Hamburg Commercial Bank (HCOB) published the preliminary estimates of the July Purchasing Managers’ Indexes (PMIs). European growth stands at its highest in almost a year according to the surveys, as the Composite PMI rose to 51.0 in July from 50.6 in Jun,e while beating expectations of 50.8.
As for the ECB, the central bank announced its decision to keep the benchmark rates on hold, as widely anticipated. The interest rate on the main refinancing operations, the interest rates on the marginal lending facility and the deposit facility stood at 2.15%, 2.4% and 2%, respectively. The headline had no impact on EUR/USD, which kept trading at around 1.1750.
Right afterwards, the US released Initial Jobless Claims for the week ended July 19, which improved to 217K from the 221K previously posted and the 227K anticipated. Coming up next is ECB President Christine Lagarde's press conference, and the US S&P Global preliminary July PMIs.
SUPPORT 1.17118
SUPPORT 1.16767
SUPPORT 1.16316
RESISTANCE 1.17937
RESISTANCE 1.17703

EURUSD Considering the higher timeframe trend, I expect further downside in price.
It has reached a key price level on this same timeframe, and I anticipate a rejection from this area.
The highlighted blue zones represent the target levels for EUR/USD.

EURUSD Will Collapse! SELL!
My dear subscribers,
This is my opinion on the EURUSD next move:
The instrument tests an important psychological level 1.1696
Bias - Bearish
Technical Indicators: Supper Trend gives a precise Bearish signal, while Pivot Point HL predicts price changes and potential reversals in the market.
Target - 1.1651
About Used Indicators:
On the subsequent day, trading above the pivot point is thought to indicate ongoing bullish sentiment, while trading below the pivot point indicates bearish sentiment.
Disclosure: I am part of Trade Nation's Influencer program and receive a monthly fee for using their TradingView charts in my analysis.
———————————
WISH YOU ALL LUCK

EURUSD: the ECB weekThe focus of the previous week was on US inflation figures. Posted data showed relatively stable figures for June, as inflation was standing at 0,3% for the month and 2,7% on a yearly basis. Both figures were in line with market expectations. Core inflation remained elevated and reached 0,2% for June and 2,9% y/y. At the same time, core inflation was by 0,1pp lower from market forecasts. The Producers Price Index in June was standing at 0%, same as core PPI. Compared to the year before, PPI was increased by 2,3%, while core PPI was higher by 2,6%. Retail sales in June were higher by 0,6%, and were better from market estimates of 0,1%. Building permits preliminary for June reached 1,397M and housing starts were standing at 1,321M in line with market expectations. The University of Michigan Consumer Sentiment preliminary for June was at the level of 61,8 in line with forecasts. Five year inflation expectations cooled a bit to 3,6%, from previous 4%. This year inflation expectations also eased to 4,4% from previous 5%.
The Industrial Production in the Euro Zone in May was higher by 1,7% for the month, bringing the indicator to the level of 3,7% on a yearly basis. Both figures were much higher from market forecasts of 0,9% for the month and 2,4% for the year. The ZEW Economic Sentiment Index in July for Germany reached the level of 52,7 a bit higher from forecasted. The final CPI in the Euro Zone in June was 2,3% y/y and core CPI at 2,3%, without change from the previous estimates.
For the second week in a row markets favored the US Dollar, which strengthened to the level of 1,1570 against euro. The currency pair ended the week at the level of 1,1626. The RSI continues to move around the level of 50 and is still not ready for a move toward the oversold market side. The MA50 continues to diverge from MA200, without an indication of a potential change in course in a near term period.
With a move toward the 1,1560, the eurusd tested the short term support line. At this level, the currency pair peaked in April this year. Charts are pointing to a potential for the short term reversal in the coming period. In this sense, levels modestly above the 1,17 resistance could be shortly tested. On the opposite side, 1,1560 might be tested for one more time at the start of the week, before the move toward upside. It should be considered that the ECB meeting will be held in a week ahead, where ECB members will draw the interest rate decision. A pause in rate cuts is overwhelmingly expected by market participants.
Important news to watch during the week ahead are:
EUR: GfK Consumer Confidence in august in Germany, HCOB manufacturing PMI flash for July for both Germany and Euro Zone, ECB meeting and interest rate decision will be held on Thursday, July 24th, Ifo Business Climate in July in Germany,
USD: Existing Home Sales in June, Durable Goods Orders in June.

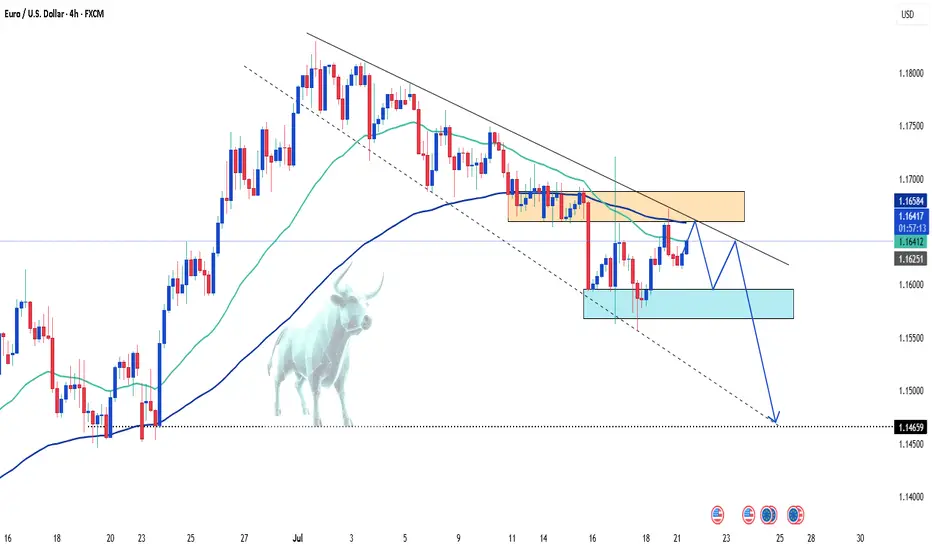
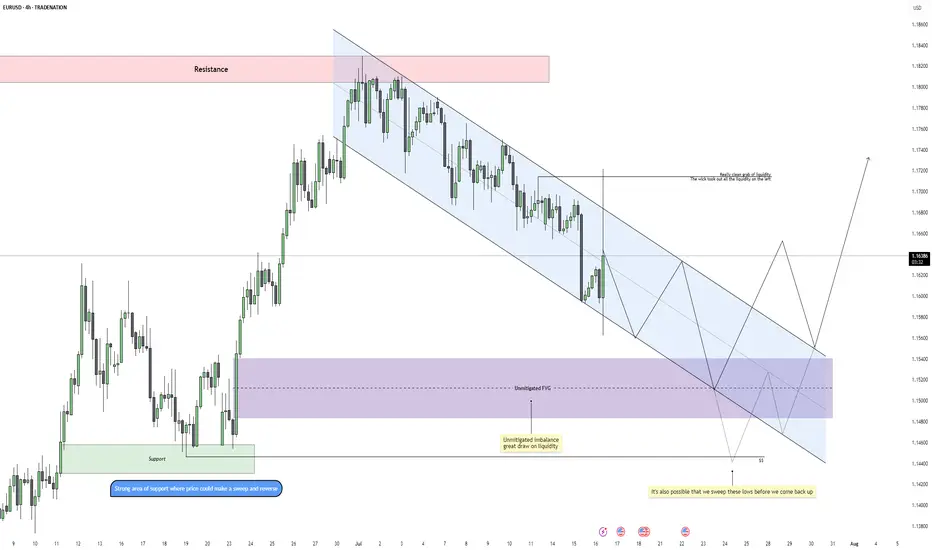
EURUSD – Bearish Rhythm ContinuesEURUSD is currently moving within a well-defined descending channel on the 4H timeframe, maintaining a consistent pattern of lower highs and lower lows. This confirms that bearish order flow remains intact, especially after the recent rejection from the upper boundary of the channel. The previous move up was largely a liquidity grab, taking out short-term highs before swiftly reversing, which adds confluence to a continuation lower.
Liquidity and Imbalance Zones
After sweeping some upside liquidity near 1.1670, price left behind a clean set of equal lows and an unmitigated fair value gap (FVG) sitting below, acting as a magnet. The purple zone marks this FVG, which is likely to be the next area of interest for price as it aligns with the midpoint of the channel and previous demand. Below that, there’s also a clear support region with resting liquidity, giving price a solid reason to reach deeper before reversing.
Projected Path and Channel Dynamics
As long as we remain inside the current bearish channel, we should expect price to respect the internal structure and continue pushing lower. The expectation is for price to trickle down through lower highs and lower lows, tapping into the FVG and potentially sweeping the lows beneath it. The projected internal path mimics this staircase-style movement down before any potential reversal can happen.
Reversal Zone and Bullish Scenario
If price does sweep the lows around 1.1450 and fills the imbalance cleanly, this would create ideal conditions for a bullish reversal. A reaction from this zone could lead to a break of the channel structure, initiating a shift in market sentiment. The upside target, in that case, would be the clean area around 1.1700 where previous liquidity was removed but not yet retested.
Short-Term Expectation
In the short term, the path of least resistance remains bearish. The most probable scenario is a continuation down into the FVG and potential liquidity sweep before we see any meaningful upside. Any premature breakout from the channel without first collecting this liquidity would be viewed as a weak move lacking proper fuel.
Conclusion
EURUSD remains technically bearish while inside the descending channel. Liquidity has been taken on the upside, and the path is now open to target unmitigated imbalances and resting lows. A full sweep into the FVG area could provide the setup for a clean reversal, but until then, trend continuation is favored.
Disclosure: I am part of Trade Nation's Influencer program and receive a monthly fee for using their TradingView charts in my analysis.
___________________________________
Thanks for your support!
If you found this idea helpful or learned something new, drop a like 👍 and leave a comment, I’d love to hear your thoughts! 🚀

EUR/USD: Bearish Trend in FocusHello everyone, what are your thoughts on EUR/USD?
From my personal analysis, it's clear that EUR/USD is extending its downtrend. The pair is trading around 1.164 and is under pressure from sellers after breaking below both the EMA 34 and EMA 89, with EMA 34 already turning downward — a classic bearish signal.
On the macro side, the European Central Bank is set to announce its monetary policy decision on Thursday. Meanwhile, U.S. President Donald Trump's ongoing trade tensions may add further uncertainty to the market. This corrective downtrend in EUR/USD could very well continue in the weeks ahead.
What do you think — will EUR/USD keep falling?