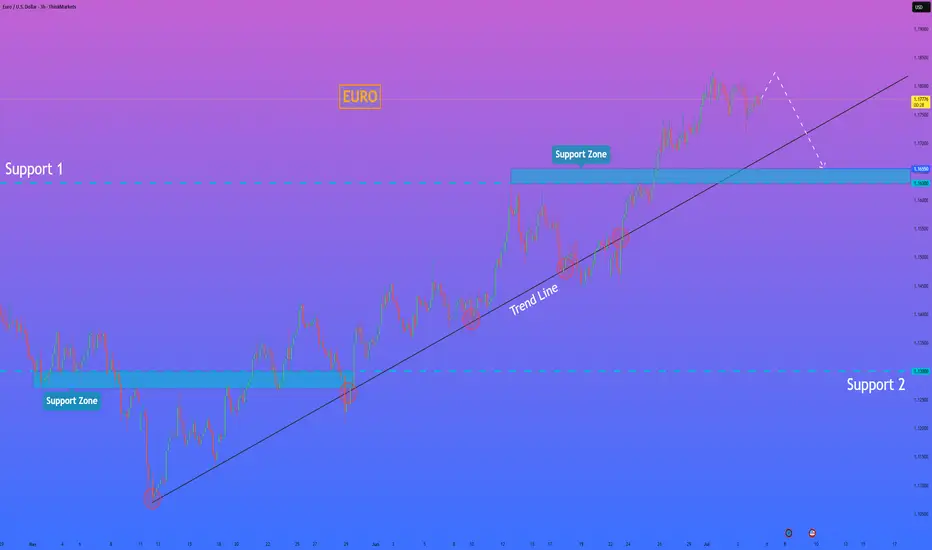
HelenP. I Euro may soon reverse and test support near $1.1655Hi folks today I'm prepared for you Euro analytics. If we look at the chart, EURUSD has been climbing steadily within an uptrend, bouncing multiple times from the trend line and making higher highs. However, despite the recent bullish structure, the pair is now showing signs of slowing momentum. The price is approaching a possible turning point near the top, and the latest candles show hesitation. Now the pair is trading near 1.1790 and still staying above the trend line, but I believe it may rise a bit more and then break down below the trend line. Once this structure is broken, I expect sellers to take control and push EURUSD toward the nearest support zone between 1.1655 and 1.1630 points. This zone acted as a key level in the past and may serve as the next area of interest for buyers. Given the extended movement and potential loss of bullish pressure, I remain bearish and expect EURUSD to move down to retest support. The level of 1.1655 is my current goal. If you like my analytics you may support me with your like/comment ❤️
Disclaimer: As part of ThinkMarkets’ Influencer Program, I am sponsored to share and publish their charts in my analysis.
EURUSD trade ideas
Euro-dollar retreats from $1.18Euro-dollar’s uptrend which has lasted fairly consistently since the start of 2025 continued in June with the price reaching a fresh four-year high above $1.18 on 1 July. Less confidence in the USA as the government continues to flip-flop and contradict on tariffs has driven capital out of the dollar. Monetary policy in the eurozone might stabilise with majority expectations pointing to only one more cut by the ECB this year while CME FedWatch suggests an 80% probability of at least two cuts by the Fed before the end of 2025.
Low volume and clear overbought conditions might point to a pause in the uptrend soon, but selling demand also seems to be limited as seen from the relatively long tails of recent candlesticks. The 23.6% monthly Fibonacci retracement is slightly above the top of this chart around $1.1885. The 38.2% Fibo around $1.166 is a possible area of support.
This is my personal opinion, not the opinion of Exness. This is not a recommendation to trade.

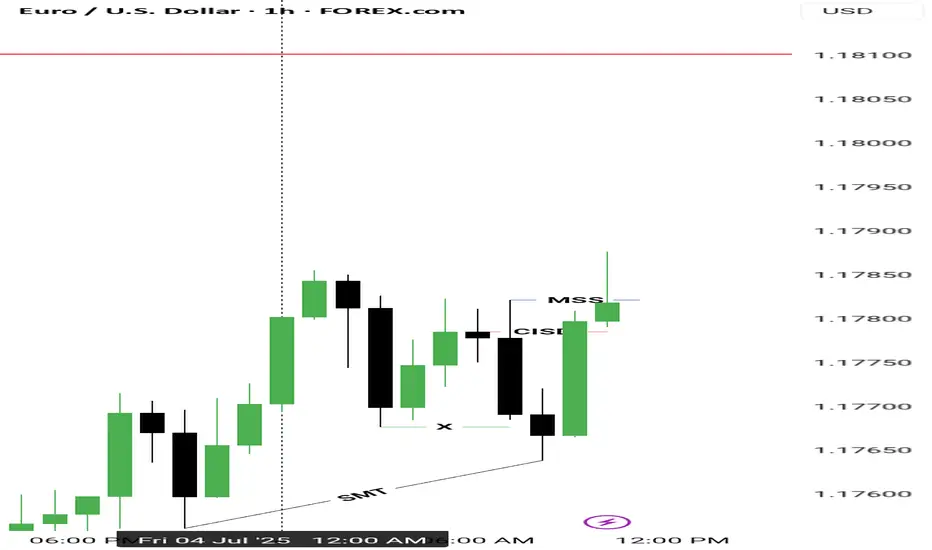
Possible buys for eurusd Dxy yet to confirm the CISD
HTF KEY LEVEL
1. Hourly OB; we've confirmed bullishness yesterday so 1H can serve as HTF
CONFIRMATIONS
1. liquidity purge ✅
2. Cisd ✅
3. ifvg✅
4. Fvg ✅
5. Mss ✅
EURUSD A Fall Expected! SELL!
My dear subscribers,
My technical analysis for EURUSD is below:
The price is coiling around a solid key level - 1.1784
Bias - Bearish
Technical Indicators: Pivot Points High anticipates a potential price reversal.
Super trend shows a clear sell, giving a perfect indicators' convergence.
Goal - 1.1667
My Stop Loss - 1.1853
About Used Indicators:
By the very nature of the supertrend indicator, it offers firm support and resistance levels for traders to enter and exit trades. Additionally, it also provides signals for setting stop losses
Disclosure: I am part of Trade Nation's Influencer program and receive a monthly fee for using their TradingView charts in my analysis.
———————————
WISH YOU ALL LUCK

EURO - After movement up, price will drop to support lineHi guys, this is my overview for EURUSD, feel free to check it and write your feedback in comments👊
Recently price started to grow inside a rising channel, where it some time traded below the support area and soon bounced up.
Price broke $1.1455 level and rose to the resistance line of the channel, after which it turned around and made correction movement.
Next, price some time traded near $1.1455 level and then bounced and continued to move up inside the channel.
In a short time Euro rose to $1.1700 level, which coincided with a support area, and some time trades between this level.
Then the price broke this level and continued to move up, until it almost reached the resistance line of the channel and started to fall.
Now, I think the Euro can rise a little and then continue to fall to $1.1610 support line of the channel, breaking $1.1700 level.
If this post is useful to you, you can support me with like/boost and advice in comments❤️
Disclaimer: As part of ThinkMarkets’ Influencer Program, I am sponsored to share and publish their charts in my analysis.

#AN015: TRUMP-PUTIN Phone Call and July 4th, Markets Closed
In an unexpected phone call on the sidelines of the American Independence Day, Vladimir Putin and Donald Trump – in the midst of the campaign for his potential re-election – had a confidential conversation that quickly captured the attention of global markets, even on a day when Wall Street was closed.
Hello, I am Trader Andrea Russo and today I want to talk to you about the latest news of these hours. I would like to thank in advance our Official Broker Partner PEPPERSTONE for the support in creating this article.
📉 Wall Street closed, but Forex is always open
While the US stock markets remain closed for the July 4th holiday, the currency market – by its nature decentralized and global – never stops completely. And it is precisely in these moments of low liquidity that geopolitical moves can have an amplified impact.
☎️ What did Putin and Trump say to each other?
Official sources speak of a “cordial discussion” on global security issues, Ukraine, and the future of US-Russia energy relations. However, according to leaks from Moscow, Putin has expressed openness to a new energy negotiation in the event of Trump’s return to the White House.
Translated into Forex language? This could mean:
Lower geopolitical risk on USD in the long term (Trump is seen as more in favor of dialogue with Moscow)
Pressure on Euro if negotiations with Russia are diverted to a Washington-Moscow axis
Temporary strength of RUB in case of glimmers of easing of energy sanctions
📊 Impact on key currency crosses
Comparing the post-news movements on some crosses:
USD/RUB: flat for now, but ready to jump over the weekend if confirmations arrive
EUR/USD: latent weakness, also due to the decline in ISM and the resilience of European inflation
USD/JPY: stable, but with pro-dollar sentiment in the background (Trump is perceived as economically dovish)
⏱️ What to expect in the next 24 hours?
With liquidity recovering already since tonight (Tokyo), markets could start to price in the geopolitical narrative of Trump's return. This scenario favors:
USD slightly stronger in the short term
Watch out for false breakouts on low volatility (typical of July 4th)

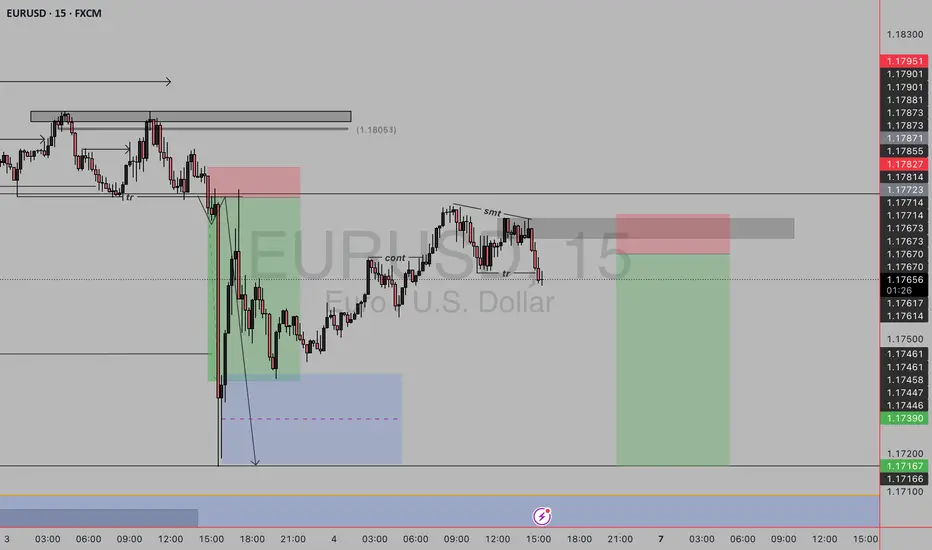
eurusd sell setup The trend on ltf is currently bearish and i have noticed a break of low plus liquidity available to grab for sells .Since its a counter trend due to HTF trend we go low risk short if given a retracement
SHORT ON EUR/USDEU has given a nice bearish setup with a rising channel.
I will be selling EU to the next demand level looking to catch 200-300 pips.

EURUSD: Strong Bearish Sentiment! Short!
My dear friends,
Today we will analyse EURUSD together☺️
The recent price action suggests a shift in mid-term momentum. A break below the current local range around 1.17775 will confirm the new direction downwards with the target being the next key level of 1.17696.and a reconvened placement of a stop-loss beyond the range.
❤️Sending you lots of Love and Hugs❤️

EU may stop rising soon. Closes to W1 downtrend!1. Key points for reversal coming:
The bullish wave on the weekly (W1) timeframe has been rising for quite a long time and has extended significantly.
It is approaching the downtrend zone on the weekly/monthly (W1/MN) chart.
There is a twisted Kumo top in the Ichimoku Cloud, indicating potential indecision or reversal.
The current structure may be forming the right shoulder of a Quasimodo pattern.
The TDI (Traders Dynamic Index) momentum indicator is showing a strong overbought condition.
2. Plan: Sell around 1.1950!

EURUSD 4H Structure Analysis | MMC Strategy + Channel + CurveIn this EURUSD 4-hour chart analysis using MMC (Market Mind Concept), we are observing a textbook rising channel structure accompanied by a black mind curve (evidence of psychological support behavior). Let's break it down:
📊 Structure Overview:
Straight Ascending Channel:
Price has been respecting a clean, straight rising channel, forming higher highs and higher lows over the past several weeks. This structure provides a controlled bullish bias, but we are approaching an inflection point.
Black Mind Curve Support (Evidence 2):
A curved trendline (Mind Curve) is providing dynamic support. This curve intersects with the lower boundary of the rising channel—creating a confluence zone, which is likely to act as strong short-term support or the base of a reversal.
Major BOS (Break of Structure):
A significant bullish BOS occurred earlier, confirming momentum strength. This previous break is acting as a reference point for bullish continuation scenarios.
📉 Bearish Scenario:
If the price breaks below the channel and mind curve support, this would invalidate the current bullish channel structure.
A clean breakout + retest below the support zone may invite strong selling pressure, targeting previous support zones around 1.1500 – 1.1350.
📈 Bullish Scenario:
If the price holds above the mind curve and continues upward, we may see a breakout above the top of the channel.
A confirmed breakout could send price toward the 1.1900 – 1.2000 resistance zone.
Patience is key—wait for a confirmed breakout from the channel (either side) before engaging.
⏳ Strategy Outlook:
✅ Wait for channel breakout confirmation (up or down)
⚠️ Watch for fakeouts or liquidity grabs near channel boundaries
🔁 Mind Curve Support adds another layer of decision-making structure
🧠 Trade with the trend, but remain adaptable to shift if channel breaks
🔍 Summary:
The EURUSD pair is in a decision-making zone—either we get a bullish continuation breakout, or the structure fails and we flip into a bearish correction. The confluence of the straight channel and mind curve makes this setup high-quality for both trend traders and breakout traders.

After all the news EUR/USD confirmed its time to pullback looking at daily up side leg extansion, almost with no retracments , it has a lot of space to fall down at least to 50% fib level , london gave couple good entry points to the downside. but its friday manage your positions more aggresive , anything could happen today,but we are bearish for the next week

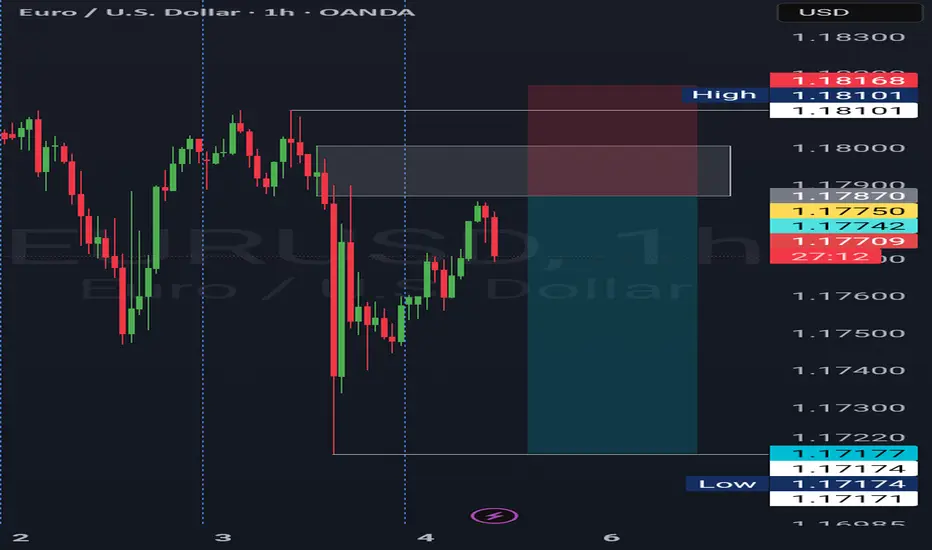
EURUSD is almost at h1 ob and previous day high. EURUSD approaching the H1 order block (OB) and the previous day high. That’s a strong confluence zone for a potential reversal.
Here’s a quick game plan you could consider:
Entry: Look for bearish reversal price action signals (like pin bars, bearish engulfing candles) right at the H1 OB / previous day high zone.
Stop loss: Just above the order block or recent swing high to minimize risk.
Target: Yesterday’s low as your take profit zone — logical support area.
Risk/Reward: Make sure it fits your 1-2% risk per trade with at least 1:2 or 1:3
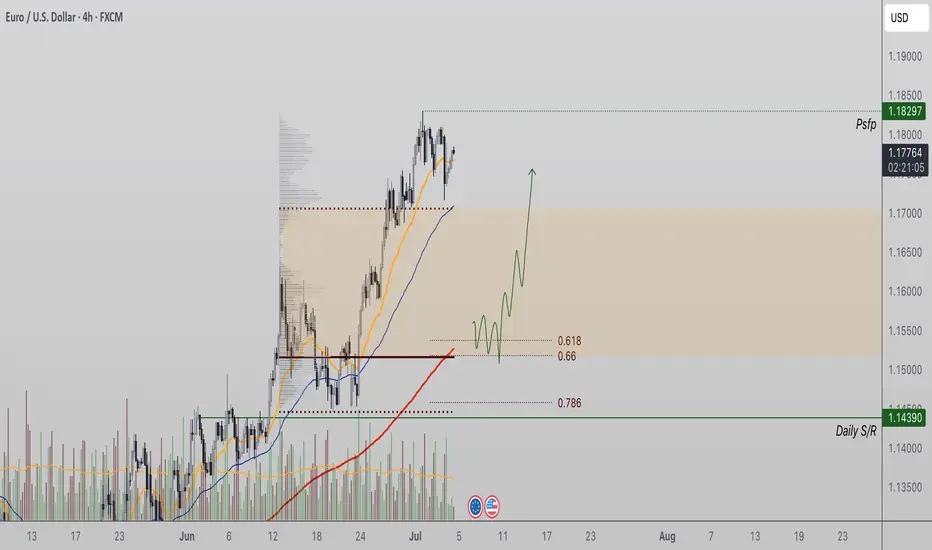
EURUSD Healthy Correction Could Set Up Next Bullish LegEURUSD continues to trade within a strong bullish structure, marked by a consistent sequence of higher highs and higher lows across multiple timeframes. The pair recently tested a significant resistance zone around $1.18, which acted as a swing high and has since been defended by sellers. This rejection has led to a short-term pause in the uptrend, with price now consolidating around the value area high, a critical area on the volume profile that typically precedes either continuation or a corrective move.
From a technical standpoint, a pullback from the current level would be healthy, especially given the extended nature of the recent move. The ideal retracement zone lies between the 0.618 Fibonacci level, the point of control (POC), and the 200-period moving average — all of which converge to form a strong demand region. A revisit of this zone would offer a textbook opportunity for the formation of a higher low, which would preserve the existing bullish structure and invite renewed buying interest.
A correction into this region would not indicate weakness but rather reinforce the strength of the trend. It allows for momentum reset and offers a more sustainable base for the next potential move higher, potentially targeting a breakout above the $1.18 swing high.
As long as price action remains above the previous higher low and these key support zones hold, the bullish bias remains intact, and traders may look for long opportunities on signs of a reversal within the corrective zone.
Fundamental Market Analysis for July 4, 2025 EURUSDEvents to pay attention to today:
12:00 EET. EUR - Producer Price Index
EURUSD:
On Friday, during the Asian session, the EUR/USD pair is trading in a narrow range around 1.1760. The main currency pair is showing sluggish dynamics amid the US holiday (Independence Day).
The US dollar (USD) is maintaining its recovery, triggered by better-than-expected non-farm payrolls (NFP) data for June. Data released on Thursday showed that the US economy added 147,000 new jobs, exceeding expectations of 110,000.
The better-than-expected NFP data brought some relief to the US dollar, but this is unlikely to continue as the report shows that private sector hiring is losing momentum. Private employers added 74,000 jobs in June, well below the three-month average of 115,000. This scenario is unlikely to ease the position of several Federal Reserve (Fed) officials, including Vice Chair for Supervision Michelle Bowman, who advocated for lower interest rates at a policy meeting later this month, citing potential risks in the labour market.
In the eurozone, the sharp appreciation of the euro (EUR) has raised concerns that inflation could fall below the European Central Bank's (ECB) 2% target. According to a senior ECB official, ‘the ECB may have to make it clear that too strong a euro could be a problem, as it could cause inflation to hover below target,’ reports the Financial Times (FT).
Trading recommendation: SELL 1.17700, SL 1.18000, TP 1.16900


EURUSD after the NFPYesterday, EURUSD pulled back to 1,1714.
Today is likely to be a calmer day on the markets, with no major swings expected.
Avoid rushing into new positions or using large lot sizes.
The uptrend on EURUSD remains intact, and we’ll be watching for new buying opportunities again next week.
EURUSD Short Projections for Big Beautiful BillI think we may hit a resistance point soon and drop to around 1.16 or lower. Based on the fundamentals of the Big Beautiful Bill. I think this will be short term and the USD may lose strength.
It will have large economic impact, I think this will happen in short term.
FX:EURUSD
TVC:DXY

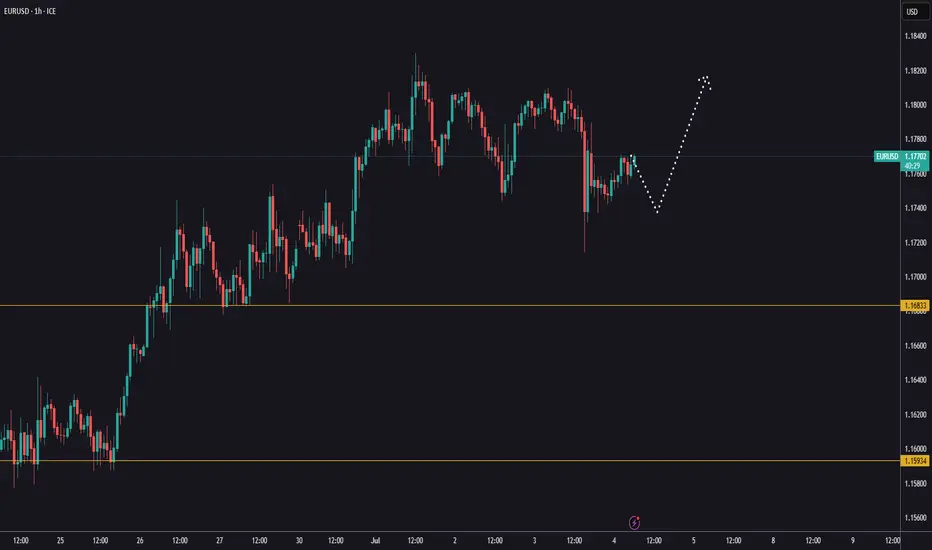
EURUSD Bullish Setup: Watching for a Break and Retest📈 Looking at EURUSD right now, we’re in a strong bullish structure 🔼 — but it’s clearly overextended 🚀
As we head into the end of the week, there’s still potential for more upside today ⬆️ — but ⚠️ be cautious, since Fridays often bring retracements as we move into the weekly close 🕒📉
🔍 I’m watching for a bullish opportunity if we get a break above the current equal highs, followed by a retest and failure to break back below 🧠📊
If that setup doesn’t materialize, we’ll simply step aside and abandon the idea 🚫
💬 Not financial advice — always trade at your own risk.

Prediction for EUR/USD Sell Setup (Short from 1.1825–1.1830)
Why?
• Price recently broke down from an ascending channel (seen on your TradingView screenshot).
• Confirmed lower high structure (bearish).
• Rejection from previous resistance near 1.1830 is likely.
• Fibonacci retracement shows 1.1830 aligns with key 78.6% reversal zone.
• DXY (USD Index) strength supports EUR/USD downside pressure.
• Clean downside liquidity resting near 1.1700 and possibly 1.1630.
⚠️ Buy Setup (Long from 1.1745–1.1750)
• Confidence: ⚪ 78%
• Why Lower?
• Although 1.1745 is solid support, it is being retested too frequently.
• Momentum is weakening.
• If price stalls and fails to bounce strongly off 1.1750, it risks collapsing to 1.1700 or lower.
• MACD/Volume divergence showing early bearish bias on M15/M30 timeframes.
⸻
🧠 Verdict:
• Short trade from 1.1825–1.1830 has higher probability based on current structure and momentum.
• This would be a sell-the-retest opportunity of the broken ascending channel.
• Hold to TP1 = 1.1745, and TP2 = 1.1700, with clean smart trail logic activated after TP1.
Then wait for reversal triggers and initiate sell long setup

EUR/USD: A Perfect Storm for BullsThis is a high-conviction long setup based on a powerful combination of macroeconomic divergence and a confirmed multi-year technical breakout.
The Non-Farm Payrolls report has now been released, and the resulting price dip has created what I believe is an ideal entry opportunity to align with the dominant bullish trend.
The Fundamental Why 📰
NFP Aftermath: Yesterday's NFP report was a mixed bag that ultimately reinforces the case for Fed rate cuts. The headline number beat expectations, causing an initial USD rally and a dip in EUR/USD. However, the underlying details like wage growth were soft. Crucially, the market continues to price in a 96% probability of a Fed rate cut by September, a figure that was unchanged by the data. The core driver of USD weakness—a dovish Fed—remains firmly intact.
Resilient EUR 🇪🇺: In contrast, the ECB has signaled it is at or near the end of its easing cycle. Economic data from core Eurozone countries is stabilizing, providing the Euro with relative strength.
Risk-On Sentiment 💹: The broader market remains in a "risk-on" mood, which is typically negative for the safe-haven USD. Gold is soaring and equities are near all-time highs, confirming the anti-dollar flow.
The Technical Picture 📊
The Secular Breakout 🚀: The most significant event is the breakout of a decade-long downtrend resistance line. This is a major structural shift. The pair has also achieved a monthly and quarterly close above the critical 1.1500 handle, turning a historic resistance level into a new support floor.
The Impulsive Uptrend 🌊: On the 4-hour chart, the price is in a clear ascending channel. The post-NFP dip represents a healthy correction within this uptrend, bringing price back toward key support.
Key Levels 🔑:
Support Zone: The dip has brought price directly into the key support confluence between 1.1700 and 1.1760, making this an ideal area to enter long.
Resistance Zone: Major resistance still sits at 1.1900, making it a prudent take-profit target.
Strategy & Risk Management 🧠
The stronger-than-expected NFP headline has provided the exact pullback this strategy was designed for. The dip presents a prime opportunity to buy into the dominant uptrend at a more favorable price. Instead of chasing the market, we are now positioned to enter on a technically sound correction.
Good luck, and trade safe!
Trade Parameters ✅
Pair: EUR/USD
Direction: Long / Buy 🟢
Entry Type: Limit Order
Entry Price: 1.1745
Stop-Loss: 1.1685 (60 pips) 🔴
Take-Profit: 1.1895 (150 pips) 🎯
Risk/Reward Ratio: 2.5 : 1

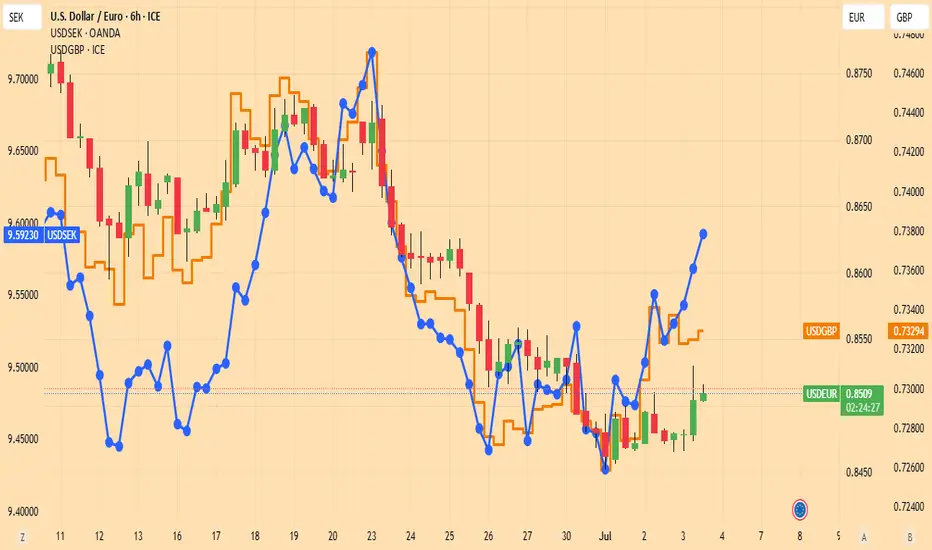
EURUSD should pull backLet us look at the comparative behavior of USDEUR, USDGBP and USDSEK.
Both USDSEK and USDGBP suggest that the Dollar has hit a through against European currencies.
The lines are creeping higher, so USDEUR is lagging.
Strategy : Sell EURUSD as long as USDSEK rises
Bearish drop?The Fiber (EUR/USD) is rising towards the pivot and could drop to the 1st support which acts as a pullback support that is slightly below the 161.8% Fibonacci extension.
Pivot: 1.1768
1st Support: 1.1700
1st Resistance: 1.1816
Risk Warning:
Trading Forex and CFDs carries a high level of risk to your capital and you should only trade with money you can afford to lose. Trading Forex and CFDs may not be suitable for all investors, so please ensure that you fully understand the risks involved and seek independent advice if necessary.
Disclaimer:
The above opinions given constitute general market commentary, and do not constitute the opinion or advice of IC Markets or any form of personal or investment advice.
Any opinions, news, research, analyses, prices, other information, or links to third-party sites contained on this website are provided on an "as-is" basis, are intended only to be informative, is not an advice nor a recommendation, nor research, or a record of our trading prices, or an offer of, or solicitation for a transaction in any financial instrument and thus should not be treated as such. The information provided does not involve any specific investment objectives, financial situation and needs of any specific person who may receive it. Please be aware, that past performance is not a reliable indicator of future performance and/or results. Past Performance or Forward-looking scenarios based upon the reasonable beliefs of the third-party provider are not a guarantee of future performance. Actual results may differ materially from those anticipated in forward-looking or past performance statements. IC Markets makes no representation or warranty and assumes no liability as to the accuracy or completeness of the information provided, nor any loss arising from any investment based on a recommendation, forecast or any information supplied by any third-party.
