EURUSD trade ideas

Bearish drop?EUR/USD is rising towards the resistance level which is a pullback resistance that lines up with the 50% Fibonacci retracement and could drop from this level to our take profit.
Entry: 1.1765
Why we like it:
There is a pullback resistance that lines up with the 50% Fibonacci retracement.
Stop loss: 1.1807
Why we like it:
There is a pullback support level.
Take profit: 1.1712
Why we like it:
There is a pullback support level.
Enjoying your TradingView experience? Review us!
Please be advised that the information presented on TradingView is provided to Vantage (‘Vantage Global Limited’, ‘we’) by a third-party provider (‘Everest Fortune Group’). Please be reminded that you are solely responsible for the trading decisions on your account. There is a very high degree of risk involved in trading. Any information and/or content is intended entirely for research, educational and informational purposes only and does not constitute investment or consultation advice or investment strategy. The information is not tailored to the investment needs of any specific person and therefore does not involve a consideration of any of the investment objectives, financial situation or needs of any viewer that may receive it. Kindly also note that past performance is not a reliable indicator of future results. Actual results may differ materially from those anticipated in forward-looking or past performance statements. We assume no liability as to the accuracy or completeness of any of the information and/or content provided herein and the Company cannot be held responsible for any omission, mistake nor for any loss or damage including without limitation to any loss of profit which may arise from reliance on any information supplied by Everest Fortune Group.

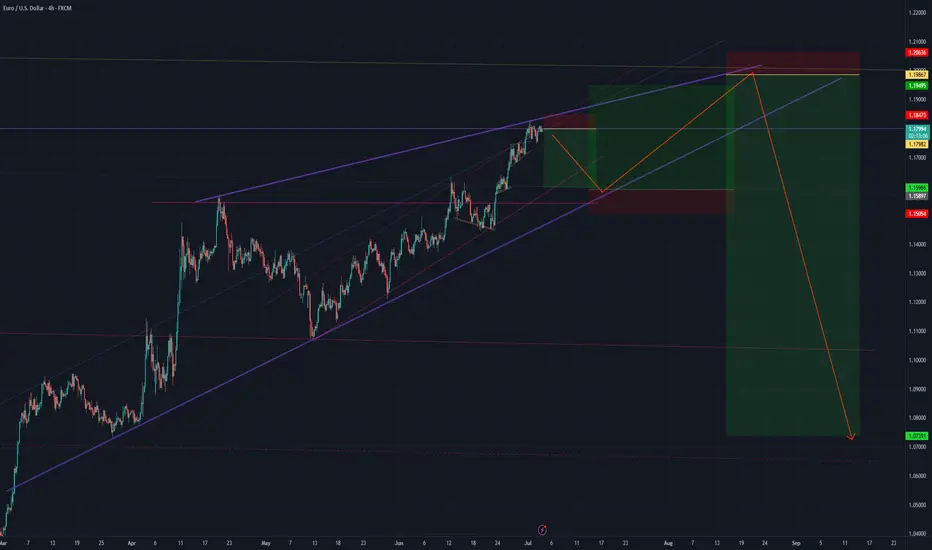
EURUSD – Bearish Reversal Confirmed After Structural BreakEURUSD has shifted out of its bullish environment after a sustained rally inside a clean ascending channel. Price recently rejected a resistance zone that capped previous buying pressure and has now started to rotate downward. This marks the first serious challenge to the trend and sets the tone for a potential bearish phase.
Channel Breakdown and Price Behavior
The ascending channel had been respected for several sessions, guiding price upward with consistent higher highs and higher lows. The recent breakdown from this structure is significant, as it shows the market is no longer willing to support higher prices within that controlled environment. This type of breakout often signals a loss of momentum and increased volatility in the opposite direction.
Break of the Low and Shift in Structure
After breaking the channel, price also took out a major internal low, which had previously held during retracements. This is a key signal of a structural shift, confirming that the uptrend has been interrupted. When price breaks a low that buyers had been defending, it shows sellers have stepped in with conviction and are likely aiming lower targets.
Short-Term Target and Reaction Zone
The first area of interest sits just below current price where a support shelf and price inefficiencies line up. This zone, marked with the dollar sign symbol on the chart, may attract a short-term reaction. If buyers are still present, this is where they would likely try to step in. However, the rejection from resistance and the structural break suggest this level could eventually give way.
Imbalance Zone Below and Liquidity Target
If that support fails, the next high-probability draw is the large untested imbalance sitting further below. This zone has remained untouched since the rally began and represents unfinished business for the market. Price often seeks out these inefficiencies, especially after trend shifts, making it a natural target for sellers if momentum continues.
Conclusion
EURUSD is showing clear signs of bearish pressure after rejecting resistance, breaking structure, and leaving behind unmitigated downside targets. As long as we remain below the broken low, the path of least resistance points lower. The imbalance zone below remains the key destination unless the market shows signs of reversal higher.
Disclosure: I am part of Trade Nation's Influencer program and receive a monthly fee for using their TradingView charts in my analysis.
___________________________________
Thanks for your support!
If you found this idea helpful or learned something new, drop a like 👍 and leave a comment, I’d love to hear your thoughts! 🚀

EURUSD Sell analysis/ideaThis analysis is based on the 4-hour timeframe and executed using reversal trading and trend formation. complete explanation in the video!

Elliott Wave Analysis: Potential Correction AheadThe overarching 5-wave structure from January 9, 2025, to today is nearing completion. We are currently in Wave 5, with the subordinate Wave 3 in progress. Within this, the sub-subordinate Wave 5 is just starting. Once the overarching Wave 5 concludes, expect a multi-week correction. The correction is projected to target levels between 1.1173 and 1.075.
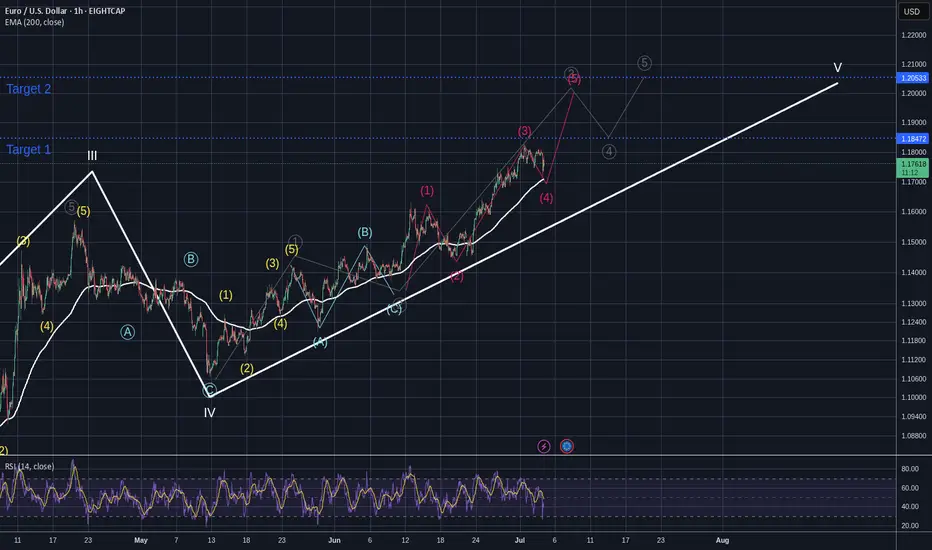
Retracement, top of the rising wedge and change of trend?I think EURUSD could retrace a bit to the the 1.16 then look for new highs around 1.19-1.20 area, that could be a potential reversal zone: long term target 1.07
EURUSD: Expecting Bullish Continuation! Here is Why:
The analysis of the EURUSD chart clearly shows us that the pair is finally about to go up due to the rising pressure from the buyers.
Disclosure: I am part of Trade Nation's Influencer program and receive a monthly fee for using their TradingView charts in my analysis.
❤️ Please, support our work with like & comment! ❤️

EURUSDEUR/USD Bias: Bullish
(Market is positioned for euro strength vs. dollar weakness, so EUR/USD likely to move higher)
Speculators are confident in euro strength, and mildly bearish on the dollar — giving EUR/USD a clear upward bias.

EURUSD | ARX Method RecapIn this short video, we walk through what happened on EURUSD today using the ARX Method focusing on liquidity, structure, and market behavior.
We also highlight the next key zones and areas of interest we're watching based on price flow and confluence.
This is for educational purposes only not financial advice or trade signals.
The goal is to help traders understand how to read and react to price with clarity and structure.

EURUSD 30Min Engaged ( Bullish Entry Detected )————-
➕ Objective: Precision Volume Execution
Time Frame: 30-Minute Warfare
Entry Protocol: Only after volume-verified breakout
🩸 Bullish Wave Coming From : 1.18050
➗ Hanzo Protocol: Volume-Tiered Entry Authority
➕ Zone Activated: Dynamic market pressure detected.
The level isn’t just price — it’s a memory of where they moved size.
Volume is rising beneath the surface — not noise, but preparation.
🔥 Tactical Note:
We wait for the energy signature — when volume betrays intention.
The trap gets set. The weak follow. We execute.
Short for the next swing low.Is EURO bull run gonna end?
ECB vs Fed Policy Paths
Federal Reserve officials are divided but generally more cautious about cutting rates soon. In mid-June the Fed held rates steady at 4.25–4.50% and forecast only two 25bp cuts in 2025
Chair Powell warned of “meaningful” inflation coming from U.S. tariffs
implying cuts may be delayed. Indeed, Fed Governor Bowman recently said she would support a rate cut “as soon as” the July meeting if inflation remains contained
highlighting internal debate. In contrast, the ECB has already started lowering rates. After its June 5 decision to cut 25bp to 2.0%, Goldman Sachs analysts see two more ECB cuts (bringing deposit rates toward ~1.5% by year-end)
As one strategist noted, “market pricing now shows a big gap between ECB and Fed rate cut expectations…Fed remains hamstrung by inflation,” keeping U.S. yields relatively high
a stickier Fed (fewer cuts) versus a more dovish ECB (more cuts) would favor USD strength and EUR weakness.
Geopolitical and Eurozone Risks
Europe’s two largest economies face looming elections and weak coalitions. Fitch Solutions notes “Germany is set to hold early elections in February 2025” complicated by far-right gains, while France “is currently being governed by a weak coalition” with rising debt risks
Such instability can undermine confidence in the euro.
Slow growth: Eurozone growth is sluggish. After a 0.2% contraction in Germany, Fitch warns that “Germany and Italy weighing on aggregate growth forecasts” in 2025
Anemic output makes the euro vulnerable, especially if the U.S. economy outperforms.
Labor market tightening: Euro-area unemployment is low (~6.3%), but conditions are “unjustifiably tight” given the weak economy
Any economic slowdown could quickly raise Eurozone joblessness, pressuring the euro.
Trade/tariff risks: A return to U.S. protectionism (e.g. renewed tariffs) could hit European exporters. Trump presidency could strain EU–US relations and dent demand for Eurozone exports
Even talk of fresh tariffs tends to boost the safe-haven dollar over the euro.

EURUSD - trade - market structureDXY - trade - market structure , easy setup, clean setup , good probability, if this happen is a big win, use risk and trade managment
01.07.2025 #EURUSDSELL 1.17850 | STOP 1.18350 | TAKE 1.17150 | Drawdown corrective price. Channel movement.

EURUSD Short, 03 JuneHTF shows clear Bearish OBs on both W and D, with doji & hammer formations hinting at buyer exhaustion. Expecting a pullback into imbalance below.
On LTF, we’ve had a clean BOS in Asia, followed by a retrace into the last 15m extreme OB – an ideal scenario for forming a new lower high in the ongoing bearish trend.
📉 Entry: 1m BOS + reaction from 15m POI
🧩 Confluence: Asia BOS, LTF structure, DXY alignment
🎯 TP: Asia Low (less than 3RR), potential to run further into HTF imbalance
🛡️ Context: All factors align – HTF bias, LTF trend, and precise entry logic.
A textbook continuation play – if we’re going to turn, this is the zone to do it.

EURUSD D1 & H4 (Wave Analysis) Update 3/7/2025EURUSD D1 & H4 (Wave Analysis) Update 3/7/2025
See the Chart

EURUSD: Move Up Expected! Long!
My dear friends,
Today we will analyse EURUSD together☺️
The recent price action suggests a shift in mid-term momentum. A break above the current local range around 1.17930v will confirm the new direction upwards with the target being the next key level of 1.17985 and a reconvened placement of a stop-loss beyond the range.
❤️Sending you lots of Love and Hugs❤️

EUR/USD Rallies on Broad Dollar WeaknessEUR/USD Rallies on Broad Dollar Weakness
EUR/USD started a fresh increase above the 1.1750 resistance.
Important Takeaways for EUR/USD Analysis Today
- The Euro started a decent increase from the 1.1600 zone against the US Dollar.
- There is a connecting bullish trend line forming with support near 1.1770 on the hourly chart of EUR/USD at FXOpen.
EUR/USD Technical Analysis
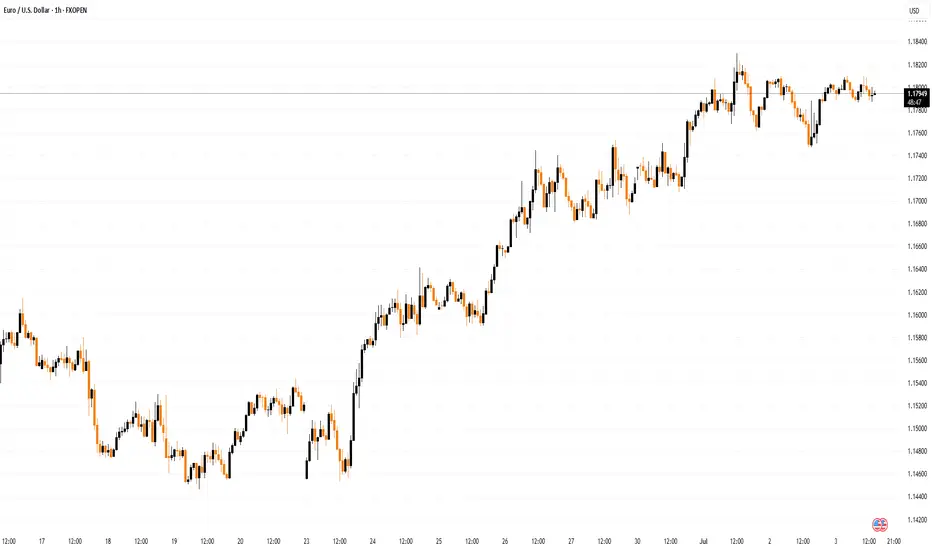
On the hourly chart of EUR/USD at FXOpen, the pair started a fresh increase from the 1.1600 zone. The Euro cleared the 1.1650 resistance to move into a bullish zone against the US Dollar.
The bulls pushed the pair above the 50-hour simple moving average and 1.1750. Finally, the pair tested the 1.1830 resistance. A high was formed near 1.1829 and the pair is now consolidating gains above the 23.6% Fib retracement level of the upward wave from the 1.1590 swing low to the 1.1830 high.
Immediate support on the downside is near a connecting bullish trend line at 1.1770. The next major support is the 1.1710 level. A downside break below the 1.1710 support could send the pair toward the 1.1680 level and the 61.8% Fib retracement level of the upward wave from the 1.1590 swing low to the 1.1830 high.
Any more losses might send the pair into a bearish zone toward 1.1645. Immediate resistance on the EUR/USD chart is near the 1.1830 zone. The first major resistance is near the 1.1850 level. An upside break above the 1.1850 level might send the pair toward the 1.1920 resistance.
The next major resistance is near the 1.1950 level. Any more gains might open the doors for a move toward the 1.2000 level.
This article represents the opinion of the Companies operating under the FXOpen brand only. It is not to be construed as an offer, solicitation, or recommendation with respect to products and services provided by the Companies operating under the FXOpen brand, nor is it to be considered financial advice.
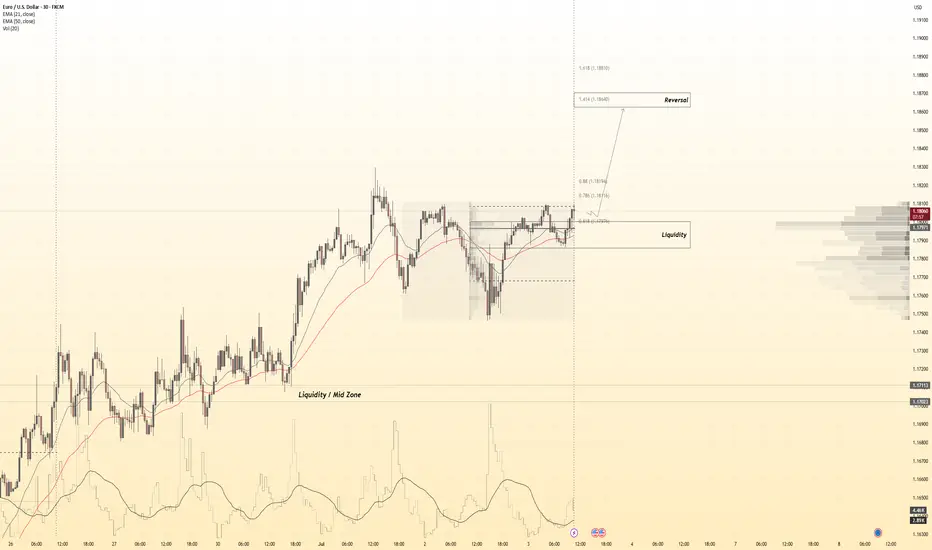
Nearing the Top: A Final Push or Smart Money Liquidity Trap?EUR/USD – Nearing the Top: A Final Push or Smart Money Liquidity Trap?
🌍 MACRO OUTLOOK – EURO CLIMBS WHILE USD TREADS ON UNCERTAIN POLITICAL GROUND:
EUR/USD is trading just below the 1.1700 mark as investors remain cautious about the US dollar's long-term credibility. Growing concerns over the Federal Reserve’s independence — should the “Trump 2.0” scenario unfold — have weighed heavily on USD sentiment across global markets.
Meanwhile, the Euro is gaining support thanks to a relatively hawkish tone from the European Central Bank (ECB). Policymakers appear reluctant to ease policy prematurely, which supports the Euro through expectations of prolonged higher interest rates.
However, with no major catalyst in play yet, traders are watching closely for mid-tier US data and any upcoming statements from ECB officials that might set the tone for the next directional breakout.
📊 TECHNICAL ANALYSIS – H4 TIMEFRAME:
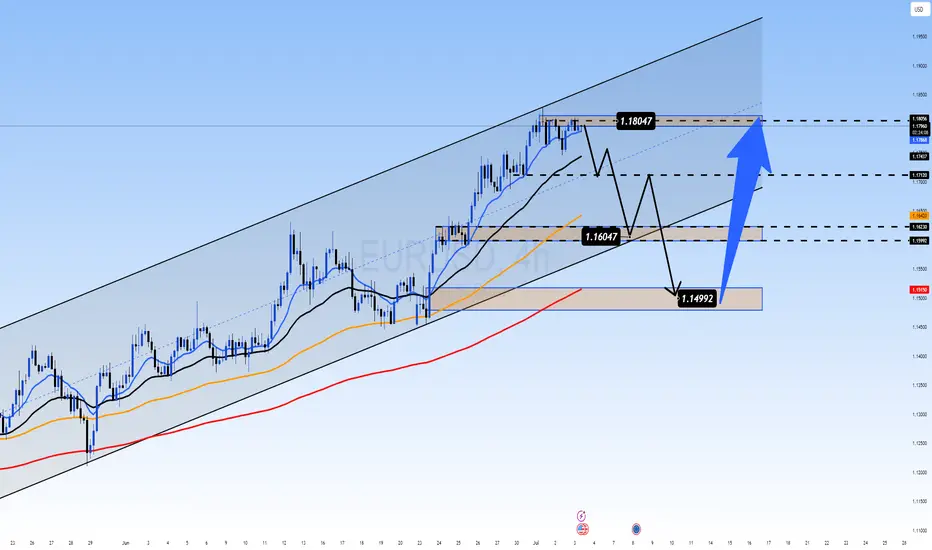
Market Structure: EUR/USD remains in a well-defined ascending price channel. However, the pair is now testing the upper band near the 1.1804 resistance, a key liquidity zone where sellers previously stepped in.
EMA Alignment: Price is trading above the EMA 13/34/89/200 cluster — a strong sign of sustained bullish momentum.
Momentum Indicators:
RSI is hovering near 70 — potential overbought territory.
ADX remains above 25 — confirming trend strength but signaling caution at extended highs.
FVG (Fair Value Gap): A visible unfilled gap between 1.1600 and 1.1640 could act as a magnetic zone for price to revisit before the next impulse move.
🔹 Key Resistance: 1.1804 – 1.1835
🔹 Key Support: 1.1640 – 1.1600 (gap zone)
🔹 Major Demand Zone: 1.1499 – 1.1515
🎯 TRADE PLAN:
Scenario 1 – Buy the Dip (Primary Bias):
Entry: 1.1600 – 1.1640
Stop Loss: 1.1550
Targets: 1.1750 → 1.1800 → 1.1850
Scenario 2 – Buy Deep Pullback:
Entry: 1.1499 – 1.1515
Stop Loss: 1.1450
Targets: 1.1640 → 1.1700
Scenario 3 – Countertrend Sell at Key Resistance (High Risk):
Entry: 1.1804 – 1.1830
Stop Loss: 1.1860
Targets: 1.1720 → 1.1650
📌 Strategic Insight:
EUR/USD may be setting up for either a breakout continuation above 1.1800 or a temporary reversal to sweep liquidity from the lower zones. Momentum favors bulls, but chasing highs without confirmation is risky. Focus on clean retracements and volume-supported entries.
💬 If EUR/USD drops back into the 1.1600 zone, will you load up for another leg higher — or wait for confirmation of trend strength? Share your view in the comments!
Eurusd techinical analysis.Eurusd techinical analysis next move posibale at h1 time frame.not finchinal advice.

EURUSD - Macro Trend Shift Soon?Hello TradingView Family / Fellow Traders. This is Richard, also known as theSignalyst.
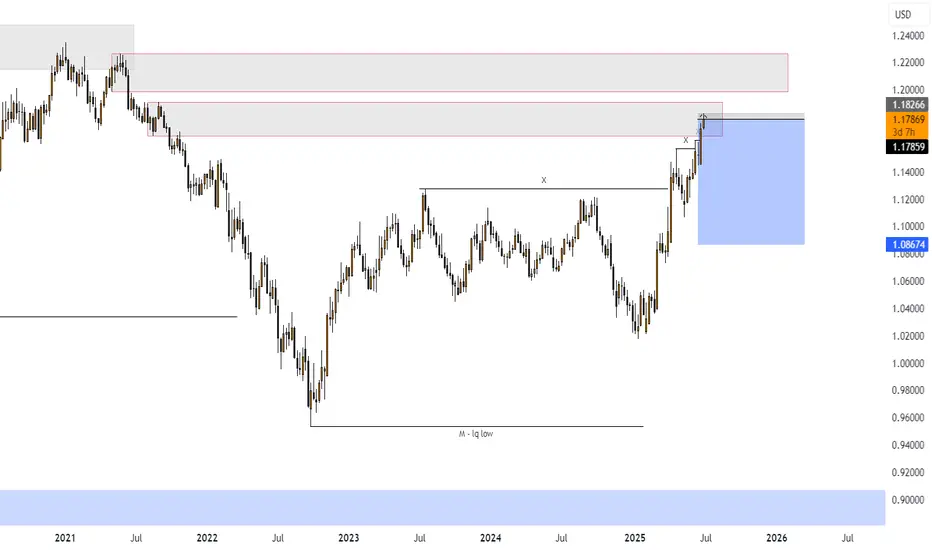
📈From a macro perspective, EURUSD has been bearish trading within the falling red channel.
Medium-term, EURUSD has been in a correction phase trading within the rising channel in orange.
Moreover, the green zone is a massive monthly resistance.
🏹 Thus, the highlighted red circle is a strong area to look for sell setups as it is the intersection of the upper red and orange trendlines and resistance.
📚 As per my trading style:
As #EURUSD is around the red circle zone, I will be looking for bearish reversal setups (like a double top pattern, trendline break , and so on...)
📚 Always follow your trading plan regarding entry, risk management, and trade management.
Good luck!
All Strategies Are Good; If Managed Properly!
~Rich
Disclosure: I am part of Trade Nation's Influencer program and receive a monthly fee for using their TradingView charts in my analysis.

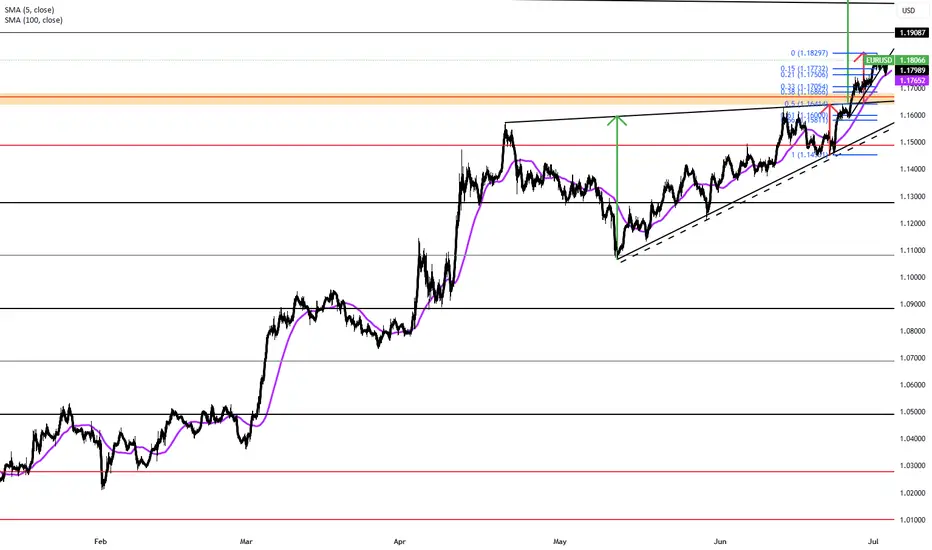
EURUSD BULISH OR BEARISH DETAILED ANALYSISEURUSD has been playing out exactly as forecasted, now trading confidently above the key 1.17 handle. Price action has respected prior structure levels perfectly, with the recent bullish impulse forming clean higher highs and higher lows. After a minor corrective move and successful retest of the previous breakout zone, we’re now seeing continuation momentum build toward the 1.21 target. This pattern is a textbook bullish flag followed by a clean breakout and retest, confirming the strength behind this current upside leg.
Fundamentally, the euro has gained strength due to growing divergence between the ECB and the Fed. With inflation in the Eurozone stabilizing and recent data indicating a modest recovery in manufacturing and services PMI, there's increasing speculation the ECB may hold rates longer, while the Fed is seen leaning toward eventual rate cuts as US labor data softens. The June NFP miss and downward revisions in prior data have weakened the USD’s position, creating a favorable environment for EURUSD bulls.
The technical confluence with macro fundamentals is striking. Risk sentiment is improving across global markets as inflation fears ease and rate clarity emerges. The euro remains supported by strong capital inflows and demand for yield stability. Additionally, EURUSD has cleared multi-month resistance zones with conviction, signaling institutional interest and momentum-based positioning. The recent candle formations suggest buyers are in firm control.
We remain on track for the 1.21 level, which aligns with prior swing highs and a key Fibonacci extension target. Any pullback toward the 1.16–1.1650 region should be viewed as a high-probability buying opportunity. With the DXY under pressure and euro zone resilience improving, EURUSD continues to be one of the top-performing major pairs heading into Q3. Stay patient and ride the wave—this move has more room to run.

EURUSD Ahead of NFP Data! Trading ScenariosEURUSD Ahead of NFP Data! Trading Scenarios
Today we have NFP data. The market expects NFP to reach 110K vs. 139K previously
ADP data came in lower than expected - 33K vs. 95K expected and JOLT data came in higher than expected 7.76M vs. 7.3M
It will be a risky decision to trade EURUSD today due to the market's interpretation regarding the FED and whether or not they will cut rates at the July meeting.
EURUSD could make either move. If it moves above the 1.1825 box, then it could rise further for a larger bullish wave near 1.1900
If it moves below the 1.1745 box, then a larger bearish wave could occur with targets at 1.1660 and 1.1590
You may find more details in the chart!
Thank you and Good Luck!
PS: Please support with a like or comment if you find this analysis useful for your trading day
Disclosure: I am part of Trade Nation's Influencer program and receive a monthly fee for using their TradingView charts in my analysis.

EUR/USD Steady Near 1.1800 as Fed Cut Bets RiseEUR/USD held steady for a second session near 1.1800 in early Thursday trading. The pair could gain momentum as the US dollar weakens on rising expectations of a Fed rate cut after ADP data disappointed.
June’s ADP Employment Change showed a surprise 33,000 drop, its first decline in over two years, well below forecasts of 95,000. May’s figure was also revised down to a 29,000 gain.
Attention now turns to the upcoming US Nonfarm Payrolls, Average Hourly Earnings, ISM Services PMI, and S&P Global US PMI.
Key levels: Resistance at 1.1830; support at 1.1730.