EURUSD Thursday 03 JulyGet ready for a strong bullish rally on EURUSD. There is a massive breakout of a bullish flag pattern price is currently forming a continuation pattern; another bullish flag on the smaller timeframes
EURUSD trade ideas

EUR/USD timw to rebalance priceEUR/USD extended one side for long now , was huge buy pressure ,but it cant go forever one side, country economics would colapse. on this idea we have head and shoulders pattern on 1h time frame,plus extra confirmation of another low structure formed. now we wait to double tops get swept and we could look for short entrys , should be nice runnere to the short side

#AN014: Ursula von der Leyen No Confidence Motion, Market Crisis
Hello, I am Andrea Russo, a Forex trader and today I want to focus on an explosive news that has hit Brussels in the last 24 hours: the motion of no confidence against the President of the European Commission Ursula von der Leyen. I thank in advance the Official Broker Partner PEPPERSTONE for the support in carrying out this analysis.
The fact: Motion of No Confidence in the European Parliament
On July 1st, several MEPs from both conservative right and far left groups formally presented a motion of no confidence against Ursula von der Leyen, accusing her of: Non-transparent agreements with Emmanuel Macron, Opaque management of the new “Pact for Europe”, Conditioning of key appointments within the Commission and the Council and above all the violation of the democratic principle of balance of powers.
Although the motion does not seem to have the numbers to pass, it represents a direct attack on the political legitimacy of the outgoing president, just when she is trying to obtain a second term.
The suspicion is that this move is not so much to bring down von der Leyen, but to: Weaken her negotiating position, Force her to make political concessions and reopen the game on the strategic EU appointments 2024–2029.
This internal crisis comes at the worst possible time. A crisis of internal legitimacy in this context can undermine institutional stability and slow down all the economic reforms expected by the markets.
Impact on Forex
1. EUR under pressure
European political risk is back in the spotlight. Even if there was no immediate shock to the euro, institutional trading rooms are already pricing in more internal instability. This translates into:
Downward pressure on EUR/USD, especially if the motion receives more votes than expected (even if it does not pass).
EUR/CHF at risk of retracement, as the Swiss franc is seen as a safe haven currency in the event of EU institutional crises.
EUR/GBP with potential loss of strength, especially if London takes advantage of the crisis to relaunch bilateral agreements.
2. Push for safe haven currencies
JPY, USD and CHF have shown anomalous movements in the last few hours: political uncertainty is pushing traders to seek safe havens. The EUR/USD futures curve also shows a slight downward revaluation.
3. Upcoming events to monitor
The real threat will be if the number of votes in favor of the no-confidence motion exceeds 30–35% of Parliament → in that case, even if the motion does not pass, von der Leyen will be delegitimized.
The euro, in this case, could undergo a technical correction extended up to 1.0650, especially if accompanied by weak macro data.
Follow me, if you like, for other updates.
EUR/USD - Bullish Bias with Key S/R Level | TCB StrategyEUR/USD - Bullish Bias with Key Support and Resistance Levels | TCB Strategy
Trend:
The overall trend is bullish, with EUR/USD respecting an ascending channel. The market remains in a clear uptrend on higher timeframes, favoring long positions unless resistance is broken.
Key Levels:
Support: 1.1750–1.1770 (bullish bias if price holds here).
Resistance: 1.1800–1.1820 (possible short if price fails to break).
Action Plan:
Long Setup: Look for a bullish reversal pattern near 1.1750–1.1770 (solid support). Targets: 1.1800–1.1820.
Short Setup: If the price fails to break 1.1800–1.1820 and shows a rejection, consider a countertrend short targeting 1.1750.
Breakout Setup: If 1.1820 is broken with momentum, look for a retest and continuation towards 1.1850–1.1900.
Risk Management:
Stop Loss: Below 1.1750 for long trades, above 1.1820 for short trades.
Risk/Reward: Favorable 1:2 or 1:3 R:R ratio based on your setup.
TCB Checklist Score: 83%
Trend Setup: 10/10
Countertrend Setup: 7/10
Breakout Setup: 6/10
Risk Management: 9/10
Target Setting: 8/10
External Factors: 10/10
Overall Score: 50/60 = 83%
Fundamental Backing for EUR/USD Bullish Bias:
ECB vs. Fed Divergence:
The Fed’s hawkish policy may be nearing its peak, while the ECB continues to tighten to combat inflation, favoring the euro over the USD. As the ECB remains more aggressive than the Fed, this could keep EUR/USD supported.
U.S. Economic Data:
If U.S. economic data continues to underperform (e.g., weaker GDP, jobless claims, or inflation reports), it would put downward pressure on the USD, supporting a bullish EUR/USD outlook.
Eurozone Economic Resilience:
The Eurozone has shown solid economic growth despite global challenges, with nations like Germany and France demonstrating resilience. This strengthens the EUR against a potentially weaker USD.
Geopolitical Factors:
While the Russia-Ukraine war is ongoing, the EU’s resilience to the energy crisis and the gradual improvement in global risk sentiment could support the euro in the medium-term.
Global Risk Sentiment:
Risk-on sentiment could benefit higher-yielding assets like the euro, especially against a USD that could face weakening pressures from an economic slowdown.
This setup is solid but requires further confirmation. The bullish trend supports a long bias, but be alert to potential rejections at resistance or breakouts that could push EUR/USD higher.
#EURUSD #TCBStrategy #ForexTrading #Breakout #TrendFollowing #Countertrend #TradingView #ForexAnalysis #RiskManagement #TechnicalAnalysis #ForexSetup #BullishBias #ForexTraders

EUR/USD – Consolidation and Uptrend Channel Analysis!Price is holding inside a well-defined uptrend channel on the 1-hour timeframe.
The trend remains bullish as long as price respects the channel structure.
Currently, we see consolidation near the upper zone, showing market indecision.
A breakout above consolidation will confirm bullish continuation.
If this happens, buyers can look for momentum entries to the upside.
However, if price breaks down below channel support and consolidates under it,
the bias will shift to bearish and open the way for deeper corrections.
Target in case of breakdown: 1.1400 – strong support and liquidity area.
Trading Plan:
Stay bullish while price is inside the channel.
Only turn bearish on a clean break and retest below the channel.
Avoid trading inside the middle of consolidation to reduce false signals.
Patience and confirmation are essential before taking any positions.

Bearish ContinuationI am expecting price to continue lower from the newly formed area of supply zone. For now price has already mitigated the EQ of the bullish swing range so this is a medium probability trade setup. When price breaks the structure in HTF trading from the fresh demand zone in support of HTF bullish continuation would be much higher probability than this. But since I am going to use confirmation entry at the area of 1hr supply zone if it is a low probability I might not get the entry.

Golden Opportunity with EURUSDEURUSD is maintaining a strong bullish structure, with a key support zone around 1.16600. Currently, the price is consolidating just below the 1.18100 resistance and may experience a short-term pullback before continuing higher.
Bullish Supporting Factors:
– The US dollar is weakening amid expectations that the Fed will act cautiously ahead of the upcoming jobs report.
– Eurozone PMI has shown signs of recovery, lending further strength to the euro.
Suggested Strategy:
Wait for buy opportunities around the 1.16600 – 1.17000 area if bullish reversal signals appear. The target remains 1.18100 and potentially higher if upward momentum continues.

EURUSD before the NFPEURUSD remains in an uptrend, holding steady around the 1,1800 level.
Today, the U.S. Non-Farm Payroll (NFP) data will be released.
The news is scheduled for 1:30 PM London time and tends to have a significant market impact.
It's advisable to reduce risk on all open positions and avoid rushing into new trades.
Keep an eye on how the price reacts around key levels and whether it has the strength to continue the trend.

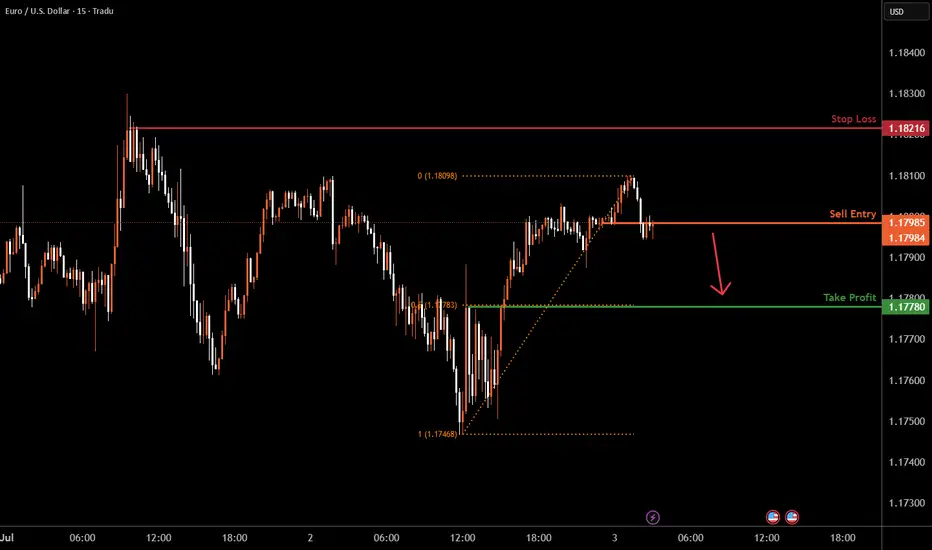
EURUSD M15 I Bearish Fall Based on the M15 chart, the price is testing our sell entry level at1.1798, a pullback resistance.
Our take profit is set at 1.17780 an overlap support that aligns with the 50% Fib retracement.
The stop loss is set at 1.1821, a swing high resistance.
High Risk Investment Warning
Trading Forex/CFDs on margin carries a high level of risk and may not be suitable for all investors. Leverage can work against you.
Stratos Markets Limited (tradu.com ):
CFDs are complex instruments and come with a high risk of losing money rapidly due to leverage. 63% of retail investor accounts lose money when trading CFDs with this provider. You should consider whether you understand how CFDs work and whether you can afford to take the high risk of losing your money.
Stratos Europe Ltd (tradu.com ):
CFDs are complex instruments and come with a high risk of losing money rapidly due to leverage. 63% of retail investor accounts lose money when trading CFDs with this provider. You should consider whether you understand how CFDs work and whether you can afford to take the high risk of losing your money.
Stratos Global LLC (tradu.com ):
Losses can exceed deposits.
Please be advised that the information presented on TradingView is provided to Tradu (‘Company’, ‘we’) by a third-party provider (‘TFA Global Pte Ltd’). Please be reminded that you are solely responsible for the trading decisions on your account. There is a very high degree of risk involved in trading. Any information and/or content is intended entirely for research, educational and informational purposes only and does not constitute investment or consultation advice or investment strategy. The information is not tailored to the investment needs of any specific person and therefore does not involve a consideration of any of the investment objectives, financial situation or needs of any viewer that may receive it. Kindly also note that past performance is not a reliable indicator of future results. Actual results may differ materially from those anticipated in forward-looking or past performance statements. We assume no liability as to the accuracy or completeness of any of the information and/or content provided herein and the Company cannot be held responsible for any omission, mistake nor for any loss or damage including without limitation to any loss of profit which may arise from reliance on any information supplied by TFA Global Pte Ltd.
The speaker(s) is neither an employee, agent nor representative of Tradu and is therefore acting independently. The opinions given are their own, constitute general market commentary, and do not constitute the opinion or advice of Tradu or any form of personal or investment advice. Tradu neither endorses nor guarantees offerings of third-party speakers, nor is Tradu responsible for the content, veracity or opinions of third-party speakers, presenters or participants.
EURUSD: Uptrend Targeting 1.18600EURUSD is maintaining a solid bullish structure after breaking above the 1.17300 zone. The pair is currently consolidating around 1.1800 and may see a minor pullback before pushing toward the 1.18600 target.
The main support comes from a weaker USD following Fed Chair Powell’s “patient” remarks, along with strong PMI data from the EU. EURUSD has now posted 10 consecutive days of gains, signaling strong upward momentum.
As long as price holds above the FVG zone near 1.1780, the bullish trend remains intact, with 1.18600 as the next potential upside target.

EURUSD toppish at 1.195A simple Fibonacci projection seems to show that EURUSD might reach the 1,618 mark at around 1.1955
A 5 Wave pattern is also clear

Wedge Top Short ScalpIt looks like EURUSD is forming a Wedge Top extended from the 20 EMA, presenting a Short Scalp opportunity targeting the move back to the EMA in the next few days.
Depending on how the current daily candle closes, this could be a good trade, so I'll be watching it today.
The bull trend is strong on this one, so we should expect a quick resolution on this short trade, otherwise, we have to cut it off quickly. I don't wan to be against this trend.
After the move back to the EMA, we will potentially have a Breakout Pullback opportunity to trade With Trend. So there's no need to rush.

EURUSD ADP Report (Today):
-33,000 jobs in manufacturing & goods-producing sectors
Overall ADP employment report: weaker than expected
➡️ Normally, that would imply a soft NFP tomorrow.
⸻
So Why Are People Saying NFP Will Be “Hot”?
There are 3 key reasons why some traders are still expecting a strong NFP despite a weak ADP:
⸻
1. ADP ≠ NFP
• ADP is NOT a reliable predictor of NFP.
• Historically, ADP and NFP often diverge widely — especially in months with:
• Revisions
• Government hiring
• Seasonal distortions
Example: In several past months, ADP missed badly while NFP was strong.
⸻
2. Other Labor Indicators Are Still Strong
• The JOLTS report this week showed job openings holding up
• Weekly jobless claims remain near historic lows
• Wages are still growing at 4%+
So markets may believe the labor market is stronger than ADP suggests.
⸻
3. Positioning & Speculation
• Traders often “fade” the ADP number, expecting NFP to surprise the opposite way.
• Some are just betting on momentum or trying to trap weak hands.

EUR/USD Fibonacci Support at Prior Resistance BounceEUR/USD has stretched the rally into the opening days of Q3 trade but at this point, the pair is overbought from both daily and weekly charts. On the weekly, RSI is nearing the 75 level and the last time the indicator was that high was back in January of 2018, just ahead of an almost 2,000 pip sell-off that ran for the next year and change.
Overbought doesn't mean automatic reversal, but it does highlight an increasingly heavier load for bulls to carry as the market gets more and more one-sided.
At this point structure on short-term charts remains bullish: The same Fibonacci retracement looked at last week has continued to carve highs and lows so far this week, with today's low showing at last week's high, around the 78.6% retracement of the 2021-2022 major move.
If we do see sellers make a statement move into the end of the week, perhaps provoked by NFP or perhaps just driven by a short squeeze in the USD, then we'd have a weekly wick above that key Fibonacci level on the longer-term EUR/USD chart, and that's something that can start to set the stage for more attractive reversal themes. - js

EURUSD I Monday CLS I Model 1Hey, Market Warriors, here is another outlook on this instrument
If you’ve been following me, you already know every setup you see is built around a CLS Footprint, a Key Level, Liquidity and a specific execution model.
If you haven't followed me yet, start now.
My trading system is completely mechanical — designed to remove emotions, opinions, and impulsive decisions. No messy diagonal lines. No random drawings. Just clarity, structure, and execution.
🧩 What is CLS?
CLS is real smart money — the combined power of major investment banks and central banks moving over 6.5 trillion dollars a day. Understanding their operations is key to markets.
✅ Understanding the behavior of CLS allows you to position yourself with the giants during the market manipulations — leading to buying lows and selling highs - cleaner entries, clearer exits, and consistent profits.
📍 Model 1
is right after the manipulation of the CLS candle when CIOD occurs, and we are targeting 50% of the CLS range. H4 CLS ranges supported by HTF go straight to the opposing range.
"Adapt what is useful, reject what is useless, and add what is specifically your own."
— David Perk aka Dave FX Hunter ⚔️
👍 Hit like if you find this analysis helpful, and don't hesitate to comment with your opinions, charts or any questions.

Eurusd technical analysis.Eurusd techinical analysis next move posibale at h1 time frame.not finchinal advice.
