EUR/USD neutral: Proceed with cautionHello traders
My short was short lived and not too damaging.
This powerful EUR/USD bounce is not unusual but perhaps a little bit of a head scratcher.
No economic data of note.
Maybe some positioning before the ECB rate decision?
I don't know what time this morning Senator Mike Lee(R) of Utah decided it was a good idea to repost a clearly fake resignation letter from Chairman Jerome Powell on X, so perhaps that was a factor.
Once again, Scott Bessent calmed the markets by stating that he does not see any reason for Chair Powell to resign.
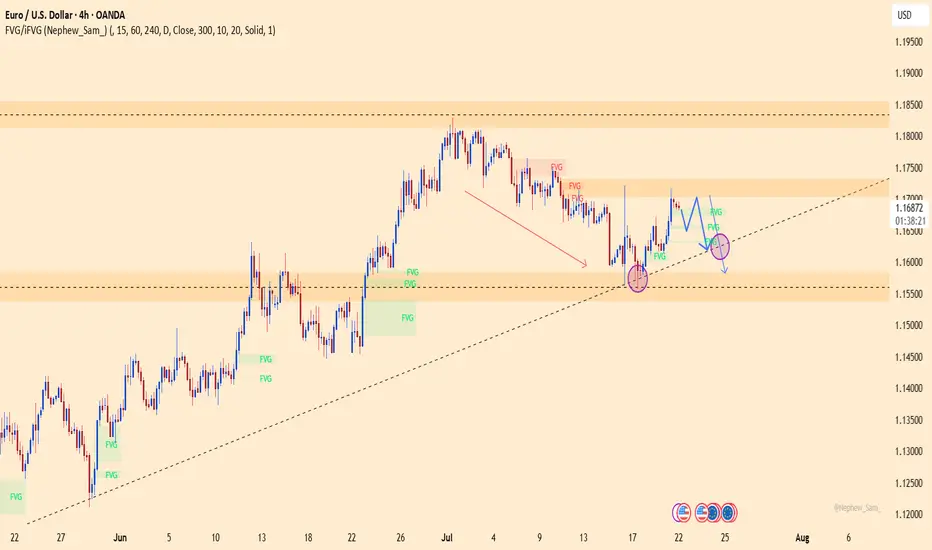
The technical picture is clear. The pair has broken and closed above a long term downtrend line/channel but is at the upper boundary of the short term channel.
I have noticed several ideas and minds looking for a decline to 1.1450. The intersection of the up and downtrend lines identifies that as a possible level to go long.
However, I take it one day at a time and I am generally hesitant to make long term predictions, so use your own best judgment.
The current economic environment is rife with uncertainty, so keep the risk small. To diversify,
I have been looking for potential growth stocks to dip my toes back into the stock market.
JOBY or ACHR anyone?
Best of luck
EURUSD trade ideas

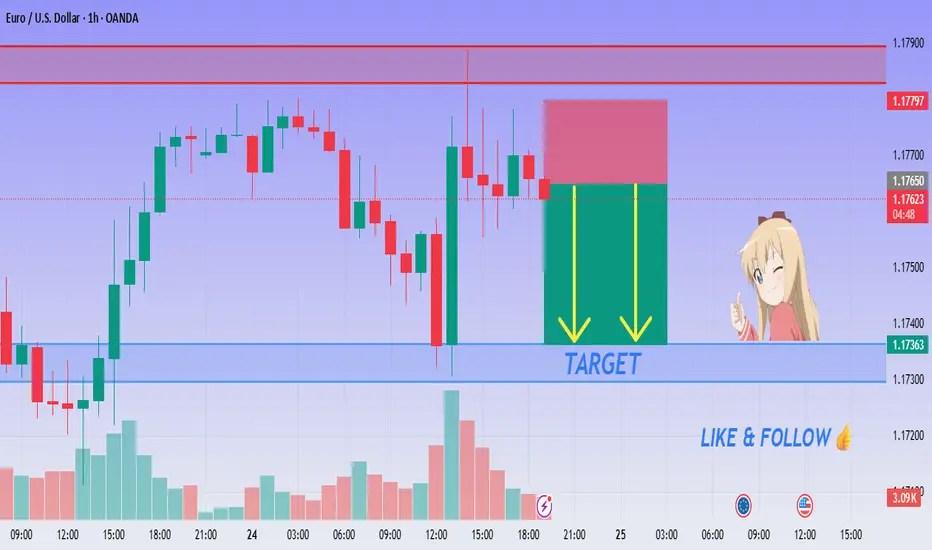
EUR/USD SELL SETUP - Rejection at Resistance!💙 EUR/USD Rejection Confirmed! SELL!
👩💻 Dear traders,
After reviewing the price action on EUR/USD (1H), I’ve concluded the following:
Price is reacting to a clear supply zone around 1.17680 – 1.17780, and signs of rejection have started appearing.
Bias – Bearish
🎯 Target – 1.17450
🎯 Target – 1.17320
🎯 Final Target – 1.17200
🛑 Safe Stop Loss – 1.17820
📊 Reasoning:
– Price touched key resistance and began stalling
– Red zone marks a clean rejection range
– Two yellow arrows show expected short move
– Trend is turning bearish near resistance
– Ideal intraday short setup with clear R:R
🍀 Stay sharp & follow the setup! Good luck!

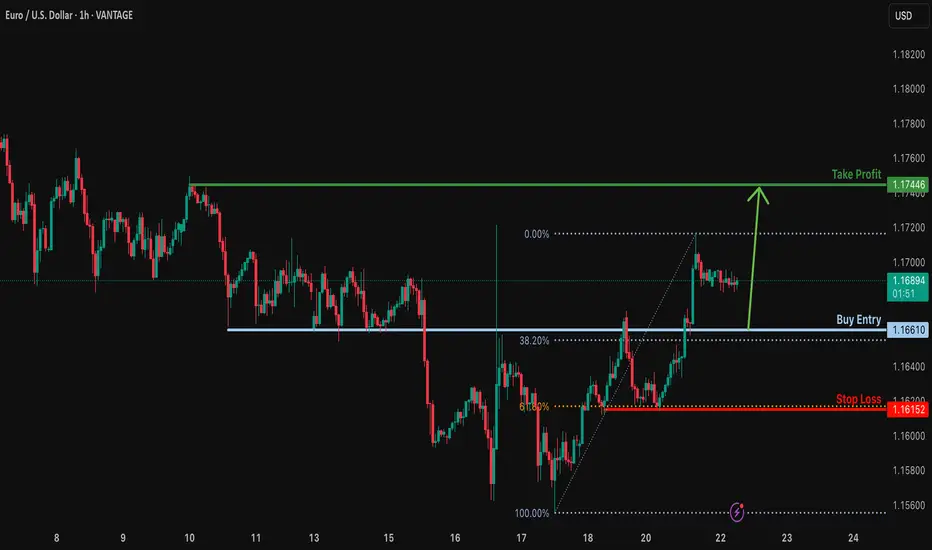
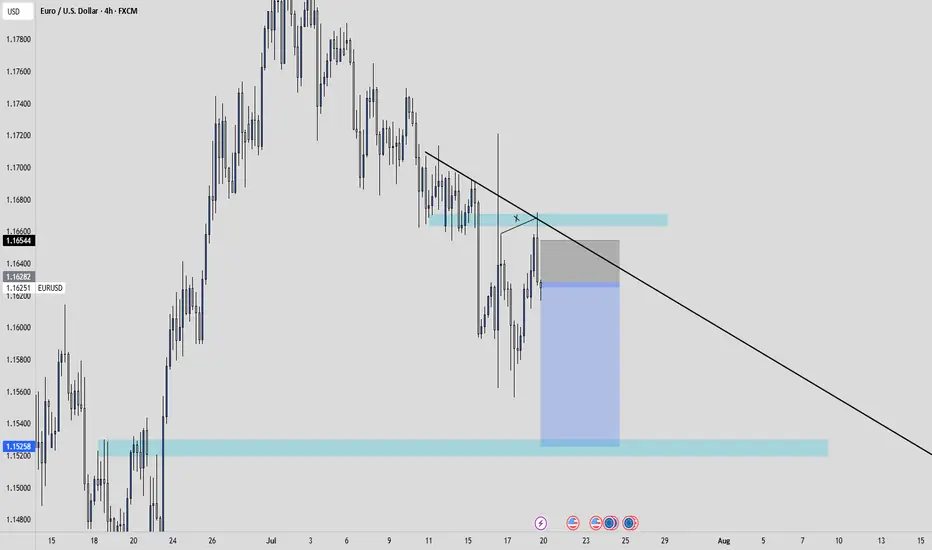
Bullish bounce off overlap support?EUR/USD is falling towards the support level which is an overlap support that aligns with the 38.2% Fibonacci retracement and could bounce from this level to our take profit.
Entry: 1.1661
Why we like it:
There is an overlap support that lines up with the 38.2% Fibonacci retracement.
Stop loss: 1.1615
Why we like it:
There is a pullback support that aligns with the 61.8% Fibonacci retracement.
Take profit: 1.1744
Why we like it:
There is a pullback resistance.
Enjoying your TradingView experience? Review us!
Please be advised that the information presented on TradingView is provided to Vantage (‘Vantage Global Limited’, ‘we’) by a third-party provider (‘Everest Fortune Group’). Please be reminded that you are solely responsible for the trading decisions on your account. There is a very high degree of risk involved in trading. Any information and/or content is intended entirely for research, educational and informational purposes only and does not constitute investment or consultation advice or investment strategy. The information is not tailored to the investment needs of any specific person and therefore does not involve a consideration of any of the investment objectives, financial situation or needs of any viewer that may receive it. Kindly also note that past performance is not a reliable indicator of future results. Actual results may differ materially from those anticipated in forward-looking or past performance statements. We assume no liability as to the accuracy or completeness of any of the information and/or content provided herein and the Company cannot be held responsible for any omission, mistake nor for any loss or damage including without limitation to any loss of profit which may arise from reliance on any information supplied by Everest Fortune Group.
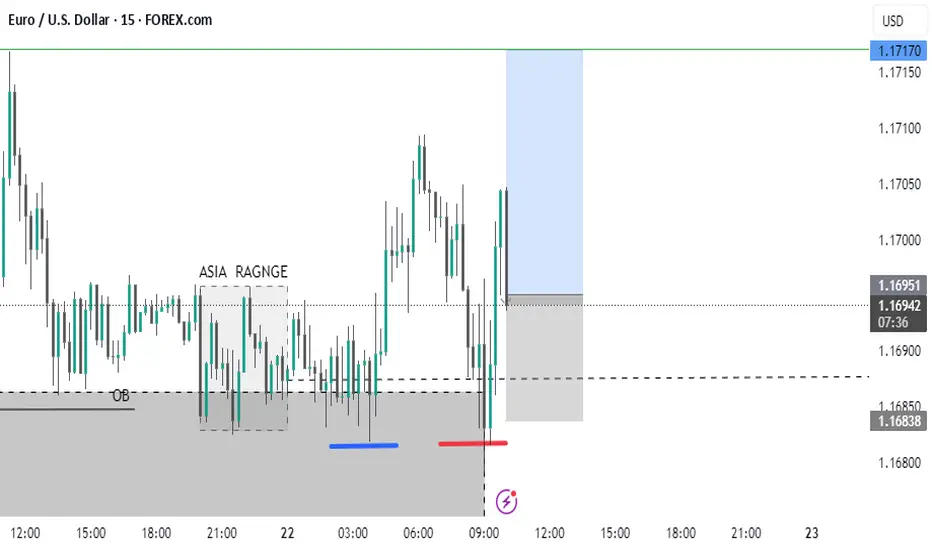
EURUSD - Sell Setup in ProgressPair: EURUSD
Bias: Bearish
HTF Overview: Structure leaning bearish — price respecting recent lower highs with room to fall into deeper 4H demand.
Current Zone: Price just mitigated the 30M sell-side OB, showing early signs of reaction.
LTF Confirmation: Still in observation mode — waiting for 5M or 1M confirmation to trigger short entries with confidence.
Entry Zone: Focused on refined LTF shift beneath the 30M OB — ideal setup includes inducement or liquidity run before executing.
Targets: First target is intraday low — ultimate target is the strong 4H demand zone below.
Mindset Note: Let the market bring the entry to you — don’t jump ahead of confirmation. Smart patience wins.
Bless Trading!

eurusd long positionin my opinion this is a good trade with a good r/r
hope hit the tp
consider this is my trade not your trade and i just like to share my trades with world
Sell eurusdStrong sell expected
Still weekly and monthly overbought pair
Bearish correction expected
Daily buy trend broken

Today's EURUSD Analysis : Channel Break : EURUSD Eyes 1.19056Chart Overview:
The EURUSD pair has broken out of a well-defined descending channel, indicating a potential shift in momentum. Price has now approached a critical Central Zone that acts as a probable reaction or reversal area. This zone lies between minor and major supply levels.
🔍 Key Technical Highlights:
Descending Channel:
Price was previously trapped in a bearish channel. This channel was respected with multiple touches on both upper and lower bounds, showing controlled bearish structure.
Breakout & Momentum Shift:
The recent bullish breakout above the channel suggests buyers are gaining control. A strong candle has closed outside the structure, confirming the breakout.
Major & Minor Zones:
Two levels are marked just above the breakout:
Minor Resistance: First possible supply zone where price may pause.
Major Resistance: A stronger historical level and the top of the Central Zone.
Central Zone Reaction Area (CZRA):
This is the MMC's focus area — price is expected to react here. Either we see a rejection that could confirm a reversal setup, or price slices through, opening the door to the Next Reversal Zone around 1.19056.
📌 Strategic Condition (MMC Logic):
Condition 1:
If price respects the Central Zone and shows bearish signs (e.g., wick rejections, engulfing candles, divergence), we expect a strong pullback or reversal toward previous demand levels.
If Condition 1 Fails:
The annotation clearly states: “If this condition not apply, it will go 100%.”
Meaning: If price breaks and holds above the Central Zone, it confirms bullish strength, targeting 1.19056 — the Next Reversal Zone (NRZ).
📊 Trader's Mindset (MMC Application):
This setup is a classic MMC structure trap-break scenario:
The channel traps sellers,
The breakout invites buyers,
And the Central Zone becomes the battlefield.
Wait for confirmation, not assumption. Whether it's rejection or breakout, risk management and reaction-based trading are key.

EURUSD BUY SETUPEURUSD has touched our sloping support trendline and support zone , ITS still in an uptrend it just came for retest . so our expectations is that we might see it going up since it has tested the major zone but we stay watch on what's going to follow next .

EURUSD major resistance breakout bullish strong Readmore...📊EURUSD Analysis – 1H Timeframe
EURUSD has broken out of the descending channel with strength, shifting structure and showing clear bullish intent
📌 Breakout Confirmed:
✅ Major resistance at 1.16900 broken with strong momentum — now acting as support
Buy position activated from the 1.16900 breakout level
🎯 Next Resistance Targets / Supply Zones:
🔹 1.17200
🔹 1.17500
🔹 1.17600
Watching for reaction at these levels — trend continuation likely as long as structure holds
🧠Always follow your trading plan and risk rules — markets don’t promise, they move!
What’s your take on EURUSD’s breakout? Drop your thoughts below
#eurusd
👋Regards from expert Team

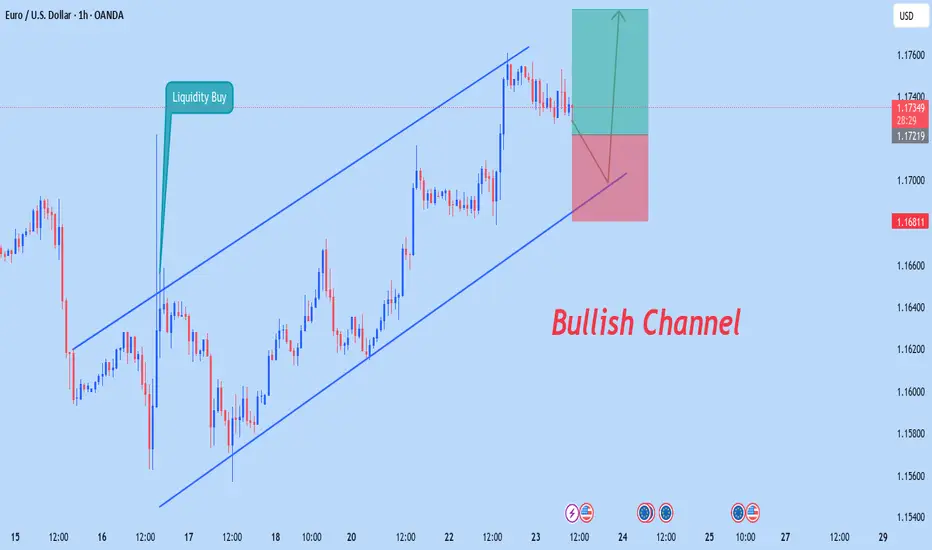
EUR/USD – Smart Money Playbook | 1H Analysis🔹 Current Price: 1.1735
🔹 Session Range: Day High 1.1760 | Day Low 1.1679
📊 Market Structure:
Clean bullish structure after breaking the previous range high.
Liquidity grab above Buy Side Liquidity (BSL) and forming a bear flag near premium zone.
🔍 Smart Money Concept Flow:
✅ Premium OB tapped → Distribution in progress
✅ Bear Flag forming → Potential break to downside
🔹 Re-accumulation zone aligned with 1H Order Block (OB)
🎯 If price retraces to 1.1680–1.1700 OB zone and holds → Bullish continuation likely
📈 Trade Idea:
Wait for pullback into 1H Bullish OB zone
Confirm entry via bullish reaction / iMS / FVG
Target: Sweep of Day High + Mitigation of upper OB (1.1780 zone)
⚠️ Risk Note:
This idea is based on smart money concepts (liquidity, structure, and OB logic). Always use proper risk management and confirmation before entries.

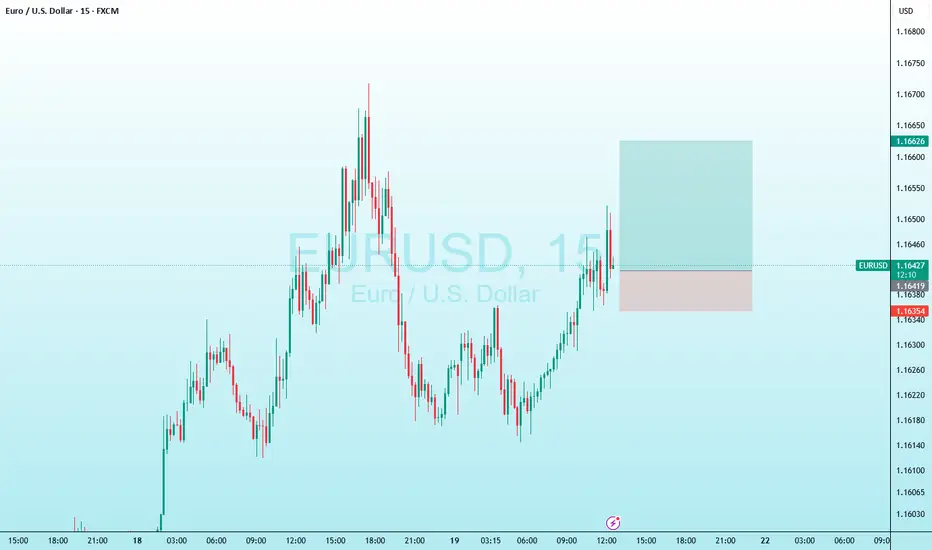
BUY FIBERGreetings traders, today we are looking for buys on EURUSD. Our first entry is at 1.16288 and second entry will be lower at 1.16046 our target is 1.16854 and stops are below 1.15883. use proper risk management and best of luck.
This trade is based on a fine tuned DAILY approach to the algo. Be careful and risk wisely.
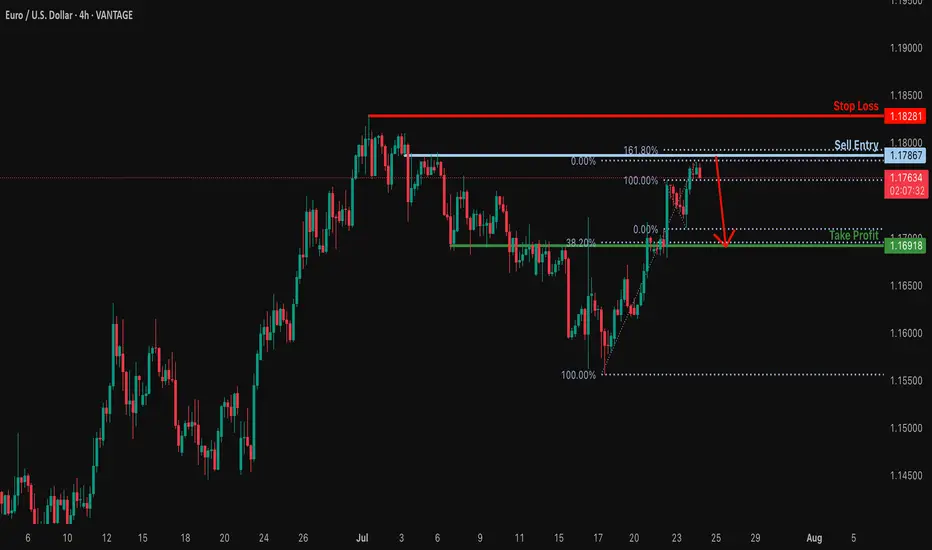
Bearish reversal off 161.8% Fibonacci resistance?EUR/USD is rising towards the resistance level which is a pullback resitance that lines up with the 161.8% Fibonacci rretracement and could drop from this level to our take profit.
Entry: 1.1786
Why we like it:
There is a pullback resistance level that lines up with the 161.8% Fibonacci extension.
Stop loss: 1.1828
Why we like it:
There is a swing high resistance.
Take profit: 1.1691
Why we like it:
There is an overlap support that aligns with the 38.2% Fibonacci retracement.
Enjoying your TradingView experience? Review us!
Please be advised that the information presented on TradingView is provided to Vantage (‘Vantage Global Limited’, ‘we’) by a third-party provider (‘Everest Fortune Group’). Please be reminded that you are solely responsible for the trading decisions on your account. There is a very high degree of risk involved in trading. Any information and/or content is intended entirely for research, educational and informational purposes only and does not constitute investment or consultation advice or investment strategy. The information is not tailored to the investment needs of any specific person and therefore does not involve a consideration of any of the investment objectives, financial situation or needs of any viewer that may receive it. Kindly also note that past performance is not a reliable indicator of future results. Actual results may differ materially from those anticipated in forward-looking or past performance statements. We assume no liability as to the accuracy or completeness of any of the information and/or content provided herein and the Company cannot be held responsible for any omission, mistake nor for any loss or damage including without limitation to any loss of profit which may arise from reliance on any information supplied by Everest Fortune Group.
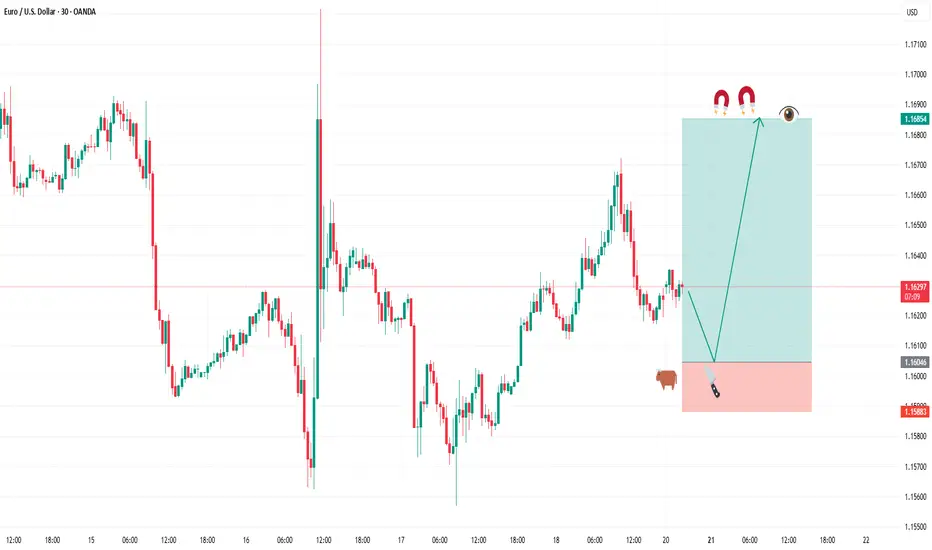
EURUSD - Next Buy Zone? This one has some nice potential
We will see how it plays out if we get tagged in

"EUR/USD Technical Blueprint: Bullish Continuation EUR/USD Technical Blueprint: Bullish Continuation Patterns and Strategic Price Zones Explained
🔹 Market Structure & Trend
The chart shows a clear shift from a ranging phase into a bullish breakout:
Price previously consolidated in a broad horizontal channel, with a strong demand zone (support) established between 1.16000 – 1.16600.
Following a deep liquidity grab on July 17-18, the price bounced sharply from support, creating higher highs and higher lows – a classic bullish structure.
Current momentum shows bullish continuation, as the price broke above local resistance around 1.16645 and is now forming a potential bull flag or bullish pennant pattern.
🟢 Bullish Momentum Confirmation
Price is currently retesting the broken resistance (now acting as support at 1.16645).
If the support holds and bullish momentum continues, the measured move target projects a price move toward 1.17331, the next significant resistance level.
This is also supported by increased volume activity in the breakout zone, as seen on the VPVR.
📊 Key Technical Levels
Level Type Description
1.16000 Major Support Historical demand zone + liquidity grab
1.16645 Support Zone Previous resistance, now retest area
1.16926 Current Price Bullish consolidation forming
1.17331 Resistance Bullish target based on breakout projection
1.17700+ Extension Potential continuation level if momentum persists
🧠 Volume & Volatility Insight
Bollinger Bands are expanding post-breakout, indicating increasing volatility and a potential trend continuation.
VPVR shows a high-volume node around 1.166, confirming it as a strong demand zone.
🔎 Outlook & Strategy
✅ Bullish Bias
As long as the price remains above 1.16645, buying dips could be a favorable strategy.
A break above 1.17000 with strong volume could open a path toward 1.1733 and higher.
❌ Invalidation Level
A strong close below 1.16600 would invalidate the bullish setup and could return price to the lower support around 1.16000.
📌 Conclusion
EUR/USD is displaying strong bullish momentum after breaking a key resistance level and forming a solid support base. A breakout above 1.17000 may lead to a continuation toward 1.17331 and potentially higher. This setup favors bullish positioning with tight risk management.

EURUSD SHORTS IDEA
Key take away poins : FX:EURUSD
Fundamental :
The Euro has been weaker because of USA's tariff on the EU. Which caused an increased demand for USD, as the tariffs supports US economical growth, which boost the short term currency strength.
Technical :
EURUSD has made a break and retest of a previous SnR area.
We printed a H4 engulfing after we swept liquidity.
We have a strong LQ grab
Price retested a really POWERFUL trendline.
I will look to enter directly at the engulfing for some sell opportunities.
TMAS20X, entertainement purpose only. Not financial advice.
EURUSD –Bearish Pressure Below 1.1780 |Channel Structure HoldingEURUSD | UPDATE
The price is currently respecting the descending channel, failing to close above the pivot zone (1.1780 – 1.1750) and rejecting from the upper boundary of the structure.
Bias: Bearish While Below 1.1780
As long as price remains under the pivot zone and inside the descending channel, the bearish pressure is likely to persist. A potential correction may retest 1.1750 – 1.1730 levels before continuation.
Next Targets:
1.1700 – Minor support
1.1684 – Short-term level
1.1627 – Mid-target
1.1557 – Main support zone and channel bottom
Invalidation:
Clear breakout and H4 close above 1.1780 would invalidate the short bias and open a path toward 1.1820 and possibly 1.1882.
Structure: Bearish inside descending channel

EUR/USD 6E Futures Risk Management: Navigating Macro Divergence As Risk Manager at WaverVanir International, I’m constantly evaluating asymmetrical setups where macroeconomic divergence aligns with technical structure. The current EUR/USD trade is one such instance—an evolving case of volatility compression within a descending triangle, positioned beneath key resistance at 1.1730.
🔻 Bias: Bearish
🧮 Structure: Daily lower highs + descending triangle
📉 Key Break Level: 1.1612 (horizontal support)
⚠️ Invalidation: Daily close above 1.1730
📊 Probability: 65% likelihood of downside continuation into August, driven by USD real yield strength and ECB rate path lag
We’re managing this trade with dynamic risk protocols:
🔐 Option hedge overlay for tail protection
🎛️ Exposure throttle post-FOMC volatility
💡 VolanX protocol flags 1.1530 and 1.1360 as likely liquidity pools if 1.1612 gives out
🧠 Remember: It's not about being right—it's about being protected when wrong.
—
This post is part of our ongoing commitment to transparency, system-level discipline, and volatility-aware macro execution.
#WaverVanir #VolanXProtocol #MacroTrading #RiskManagement #6EFutures #EURUSD #OptionsFlow #InstitutionalTrading #ForexStrategy

EURUSD – Is the rally over? Time for a collapse?The technical picture reveals that EURUSD is losing momentum after a brief rebound. The 1.1700 level stands as a key resistance – if bulls fail to break it, the bears will take the wheel! A clear scenario is forming: lower highs, FVGs filled, and a potential drop toward the 1.1580 support zone this week.
The bad news for the euro isn’t over: yesterday’s Eurozone PMI data disappointed heavily, signaling stagnating growth. Meanwhile, the USD is gaining traction from strong labor data and hawkish Fed remarks, putting EURUSD under double pressure.
If the ascending trendline breaks, EURUSD could plunge even further – get ready for a potential breakdown!
Suggested strategy: Prioritize SELL below 1.1700, with a short-term target at 1.1580.
Stop-loss: Above 1.1720 – a breakout here would invalidate the bearish setup.
EURUSD BUY SETUPFOLLOW THE PRICE WILL GO UP
BECAUSE WE HAVE PATTERN ON 5 M
WE have strong candle on frame 4h

eur usd shortHi guys i fund this trade for the next hours, the price make a double top with divergence and the double top its confirmed, so lets go to get some money good luck

Eurusd Bullish StructureEurusd sjowing bullih channel lets try buy now @ 1.17346 with 200 pips target please follow money management use proper risk management always trade smarter not like a gambler stay grouped stay safe happy trading