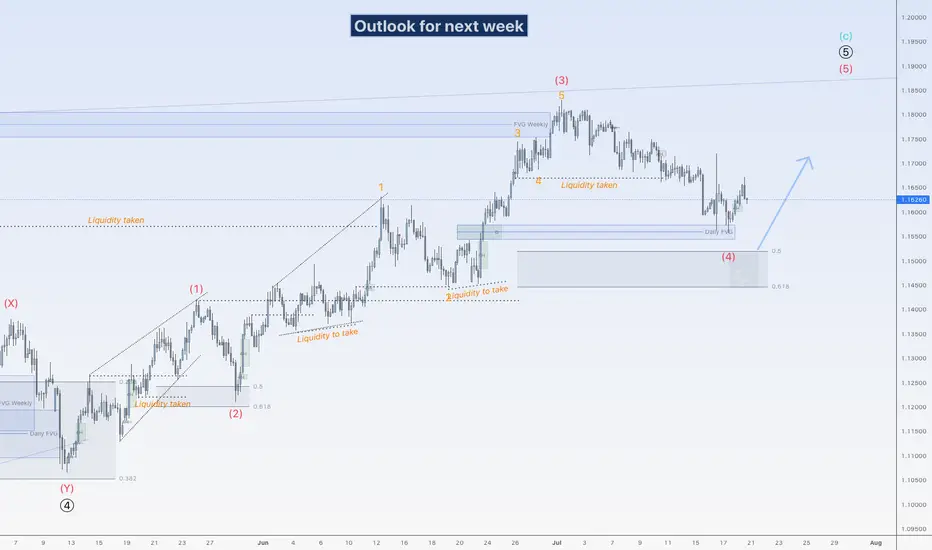
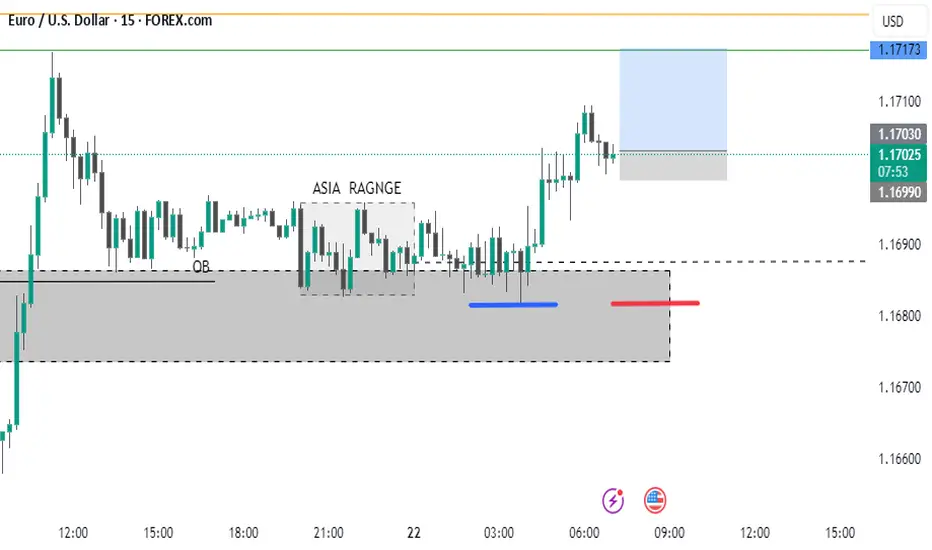
EU could go up againHi traders,
Last week EU continued the slowly down movement to the next bullish Daily FVG. Price rejected from there and swept the low of the rejection. After that it slowly went up again.
Next week we could see price go higher for the start of the next (impulsive or corrective) wave up.
Let's see what the market does and react.
Trade idea: Wait for the finish of a correction down and a change in orderflow to bullish on a lower time frame to trade longs.
If you want to learn more about trading with FVG's, liquidity sweeps and Wave analysis, then make sure to follow me.
This shared post is only my point of view on what could be the next move in this pair based on my technical analysis.
Don't be emotional, just trade your plan!
Eduwave
EURUSD trade ideas
EUR/USD Surges into Resistance Ahead of ECBEuro is poised to snap a two-week losing streak with EUR/USD up more than 1.2% since the Sunday open. The advance takes price back into weekly resistance ahead of tomorrow’s European Central Bank rate decision and the focus now shifts to the weekly close for guidance.
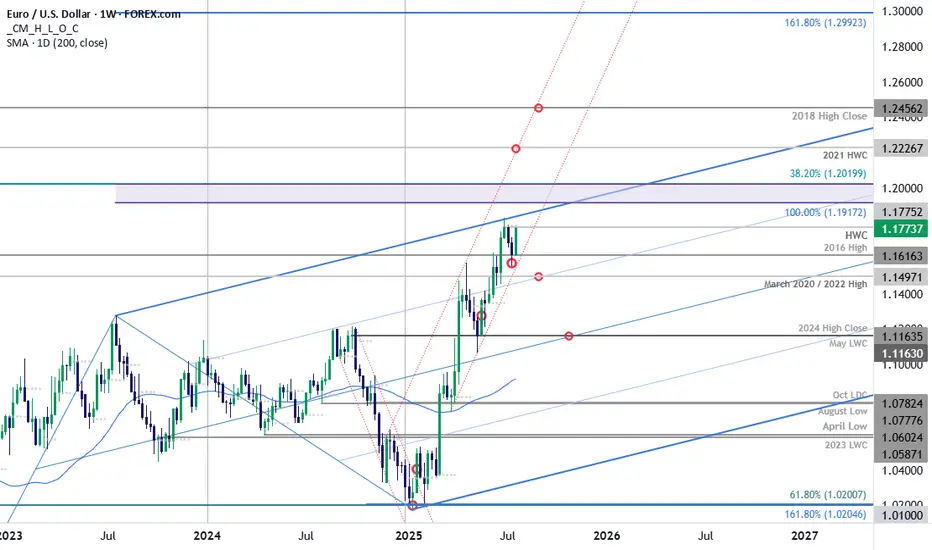
Euro plunged more than 2.3% off the June high with price briefly registering an intraweek low at 1.1557 before rebounding. The rally takes EUR/USD into resistance at the objective high-week close (HWC) / high-close at 1.1775- looking for a reaction off this mark with a weekly close above needed to keep the immediate advance viable into the close of the month.
Initial weekly support remains with the 2016 swing high at 1.1616 with the medium-term outlook still constructive while above the March trendline (red). Ultimately, a break below the 2020 / 2022 highs at 1.1497 would be needed to suggest a more significant high is in place / a larger correction is underway with subsequent support seen at the 2024 high close / May low-week close (LWC) at 1.1164.
A breach / close above this pivot zone exposes the upper parallel (blue), currently near 1.1840s, with the next major technical consideration eyed at 1.1917-1.2020- a region defined by the 100% extension of the 2022 advance and the 38.2% retracement of the 2008 decline (area of interest for possible top-side exhaustion / price inflection IF reached). Subsequent resistance objectives eyed at the 2021 HWC at 1.2227 and the 2018 high-close at 1.2456.
Bottom line: Euro rebounded just ahead of the March uptrend with the rally now testing the yearly high-close ahead of the ECB- watch the Friday close with respect to 1.1775. From a trading standpoint, a good zone to reduce portions of long-exposure / raise protective stops- losses would need to be limited to this week’s low IF price is heading higher on this stretch with a close above the upper parallel still needed to fuel the next major leg of the advance.
-MB
EURUSD DAILY UPDATESAs the main trendline on daily timeframe breaks, with the impulsive push price upside and also it closes below the previous day high.
I personally short the idea, see chart above
this is not a financial advice.
you can have a short positions on monday open with stoploss on previous day of the highest wick candle.
This is only my view, I shared the 3hr timeframe. the idea is on Daily.
Goodluck..

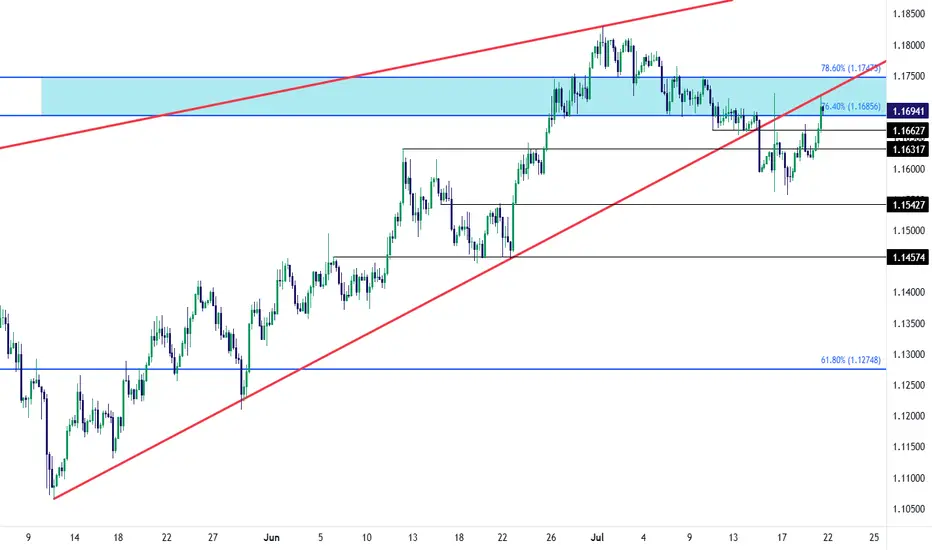
EUR/USD Recovery into Resistance TestEUR/USD bears had an open door to make a run last week and, so far, they've failed. The Wednesday turn around Trump's threat to fire Jerome Powell certainly made a mark, but the question now is whether the USD can respond to support at a longer-term trendline; and, in turn, EUR/USD is now testing in the zone between 76.4 and 78.6% Fibonacci retracements of the 2021-2022 major move.
There's also the underside of the falling wedge pattern that's now coming in as resistance as taken from prior support. The next resistance level overhead is the 1.1748 level, which is the 78.6% retracement that had offered both resistance and support with short-term price action in the pair. - js
EURUSD | 4H Chart | New York Session Sellers in Play 📉 EURUSD | 4H Chart | New York Session Sellers in Play 🇺🇸
🟥 Red Zone Rejection – clarity
As the New York session unfolds, sellers are stepping in at a premium supply zone — classic reaction near 1.1763–1.1812.
🔻 Current Structure:
Rising wedge formation tapped into prior supply zone
Price kissed the upper wedge and reacted — sellers triggering from the red zone
NY session = high liquidity = aggressive positioning by institutions
🎯 Potential Bearish Targets:
1️⃣ 1.1712 – Minor structure support
2️⃣ 1.1670 – Trendline + liquidity sweep
3️⃣ 1.1582 – Major bullish invalidation (optional swing target)
🧠 Smart Money Note:
This is where liquidity is grabbed before reversal
Risk-to-reward favors downside short-term as long as price stays below 1.1812
📌 Bias: Tactical Short
🎯 Reaction + Rejection = Execution
🎩

EURUSD : What the D saysWhile Buyer may have taken control, it would not be wise to BUY now, as it is too late.
Price is also at the D and resistance @ 1.1790 - Going by the D, a Sell now is possible with SL @ 1.1790/5
We should know very soon if/when the Seller tries to do something.
Good luck.

Educational EUR/USD Chart Breakdown – Price Action at Key LevelsEducational EUR/USD Chart Breakdown – Price Action at Key Levels
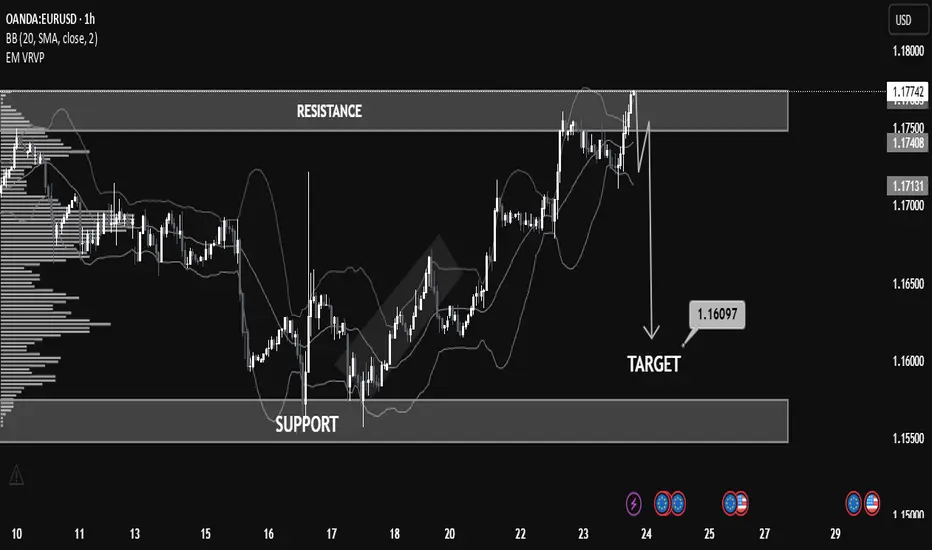
This EUR/USD (1-hour) chart provides a great example of how support and resistance zones, combined with price action and indicators like Bollinger Bands, can help anticipate market moves.
🔹 Resistance Zone Tested:
The pair recently approached the 1.17500–1.17800 resistance zone. This level had previously acted as a supply zone, and price once again showed rejection here, indicating selling pressure.
🔹 Bollinger Band Overextension:
Notice how the price extended beyond the upper Bollinger Band—this often signals that the market is overbought in the short term, leading to a potential reversal or correction.
🔹 Bearish Reaction & Target:
After rejection from resistance, the chart outlines a bearish move with a target at 1.16097. This level lies just above the next strong support zone (1.15500–1.16100), offering a realistic area for price to stabilize if the downtrend continues.
🔹 What to Learn:
Support & Resistance: Prices often react at key zones; previous resistance can turn into support and vice versa.
Confluence Tools: Use indicators like Bollinger Bands with price structure to increase confidence.
Target Planning: Identify likely reaction zones for risk management and profit-taking.
📚 Summary
This setup is a clean example of trading within a range and using technical confluence to plan entries and exits. If price breaks below 1.17130 with strong momentum, the probability increases for the market to reach the 1.16097 target.
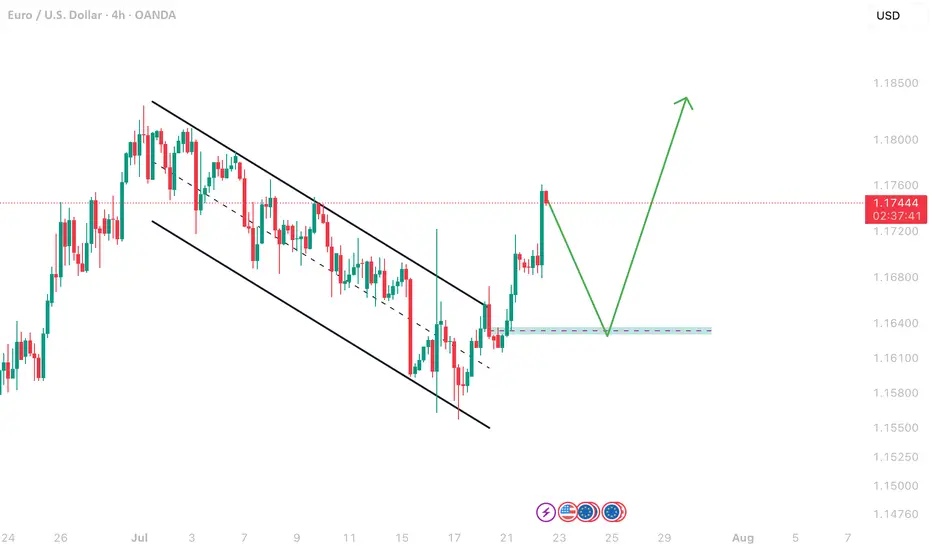
EURUSD Channel TradeAs you can see EU trading inside a channel and next predicted move can be possible retest and go again upside.
EURUSD wait for confirmationdaily shows a strong bullish setup reacting off a OB and an imbalance confluence while 4h shows a potential inversion that needs to occur, even on the confirmation timeframe of the Daily timeframe which for me will be 45 minutes there is no setup to be taken right now.

EURUSD 60/15 Pullback LongOverall strong up trend. Now under consolidate phase, then pullback, looking for long.
Possible buy zones are marked, monitor when reaching buy zones.

Sell then Buy!Hello all. if market return right from here (IF IF IF IF), the response is the zone I have shown on the chart. I had no time to Optimize it. but enter with your confirmation method. I try to optimize it tonight (wink)

EURUSD Forecast – Smart Money Setup 21st July 2025Here’s the detailed breakdown of my current EURUSD setup based on internal/external liquidity and order block reaction:
🔹 Bias: Bullish (after deeper retracement)
🧠 Breakdown:
Liquidity Sweep ✅
A clear liquidity sweep took place below recent equal lows.
This sweep triggered a bullish displacement, confirming demand.
Market Structure Shift (MSS) 🔁
A valid MSS followed the sweep, confirming short-term reversal in structure.
4H Internal Liquidity 🫧
Price tapped into internal liquidity, setting the stage for a deeper retracement before continuation.
15 Min Order Block (OB) 🧱
Price is currently trading within a 15-minute OB zone, which aligns with minor resistance before a deeper retrace.
🔻 Anticipated Retracement:
Expecting a short-term rejection from the current OB zone.
Price may retrace into the 4H OB zone near 1.1590–1.1610, aligning with an upcoming 4H liquidity pool.
This zone also aligns with previous mitigation and accumulation areas.
🟢 Final Target:
If the 4H OB holds, I'm anticipating a bullish continuation targeting the external 4H liquidity near 1.1730+.
📌 Summary:
Waiting for retracement into demand zone → looking to long from 1.1590–1.1610 area → targeting 1.1730+.
✍️ Execution Plan:
Set alerts near 1.1610
Look for LTF CHoCH or BOS confirmation in demand
Enter with tight stop loss below 4H OB
Target external liquidity

EURUSD – Preparing For Potential Volatility AheadThe week ahead has all the elements to be a volatile one for EURUSD traders to navigate. First, the unwind of long positions that has been on-going throughout July, since prices hit a 4 year high at 1.1830 on July 1st may have potentially found a short-term base after rebounding last week from printing a low of 1.1556 on Thursday. More on this in the technical section below.
Secondly, Bloomberg reported over the weekend that negotiations to agree a trade deal between the US and EU are proving to be more challenging than initially hoped. This leaves room for market moving headlines on this topic, or social media posts from President Trump that could influence the direction of FX markets, especially if it shifts trader expectations towards preparing for the prospect of a trade war between these two global economic heavyweights.
Then on Thursday, consideration needs to be given to the ECB interest rate decision (1315 BST) and then the press conference led by ECB President Lagarde, which starts at 1345 BST. After eight consecutive rate cuts at their previous meetings, the European Central Bank are expected to take a pause to assess incoming inflation and growth data, so this outcome would probably not be a surprise. However, the comments of Madame Lagarde in the press conference could increase EURUSD volatility given that there is some uncertainty surrounding whether a further rate cut is possible either in September, or later in the year.
Technical Update: Limited Price Correction or Reversal?
We all know well, even if an asset is trading within a positive uptrend, periods of price weakness can materialise, before fresh buying support develops. This can lead to renewed price strength that manages to break and close above a previous high, leading to an extension of a pattern of higher price highs and higher price lows.
Having been capped by the July 1st high at 1.1830, EURUSD has seen a price correction develop. Traders may be trying to decide if this is a limited move lower before fresh price strength is seen, or if it could be a price reversal, which may result in risks of a more extended phase of price weakness.
Much will depend on the outcome of the risk events outlined above, as well as future market sentiment and price trends, however it is possible to assess what may be the important support and resistance levels that traders could focus on to help gauge the next direction of price activity
Potential Support Levels:
After a period of price strength, it can be useful to calculate Fibonacci retracements on the latest up move to identify areas of potential support. As the chart below shows, for EURUSD, the latest phase of price strength seen from 1.1065 the May 12th low up to 1.1830, the July 1st high can be used for this purpose.
The 38% retracement of this advance stands at 1.1539 and after having remained intact during last week’s sell off, traders may now be watching how this support level performs on a closing basis.
Breaks below 1.1539, while not a guarantee of further price declines, may then lead to a deeper phase of weakness towards 1.1446, the June 19th low, even 1.1356, which is equal to the lower 61.8% retracement level.
Potential Resistance Levels:
If the 38% retracement support at 1.1539 holds any future price weakness in the week ahead, a positive trending condition may still be in place, opening the possibility of EURUSD moving back to higher levels again.
Any potential upside move could bring 1.1690 into play as an important resistance. This is the current level of the Bollinger mid-average, with closing breaks above this needed to open retests of 1.1830 July 1st highs, maybe further if this is in turn broken.
The material provided here has not been prepared accordance with legal requirements designed to promote the independence of investment research and as such is considered to be a marketing communication. Whilst it is not subject to any prohibition on dealing ahead of the dissemination of investment research, we will not seek to take any advantage before providing it to our clients.
Pepperstone doesn’t represent that the material provided here is accurate, current or complete, and therefore shouldn’t be relied upon as such. The information, whether from a third party or not, isn’t to be considered as a recommendation; or an offer to buy or sell; or the solicitation of an offer to buy or sell any security, financial product or instrument; or to participate in any particular trading strategy. It does not take into account readers’ financial situation or investment objectives. We advise any readers of this content to seek their own advice. Without the approval of Pepperstone, reproduction or redistribution of this information isn’t permitted.


ECB holds rates as expected, Euro steadyThe euro is showing limited movement on Thursday. In the North American session, EUR/USD is trading at 1.1763, down 0.03% on the day. Earlier, the euro climbed to a high of 1.1788, its highest level since July 7.
The European Central Bank's decision to maintain the key deposit rate at 2.0% was significant but not a surprise. With the hold, the ECB ended a streak of lowering rates at seven consecutive meetings. The ECB has been aggressive, chopping 250 basis points in just over a year.
The ECB statement said that inflation was falling in line with the Bank's forecasts and that future rate decisions would be data dependent. President Lagarde has said that the easing cycle is almost down, but the markets are expecting at least one more rate cut before the end of the year.
The European Union and the United States are locked in negotiations over tariffs, with hopes that an agreement can be reached, on the heels of the US-Japan deal earlier this week. US President Trump has threatened to hit the EU with 30% tariffs if a deal is not made by August 1, but there are signals that the sides will agree to 15% tariffs on European imports, as was the case in the US-Japan agreement.
If an agreement is reached, it will greatly reduce the uncertainty around tariffs and will make it easier for the ECB to lower rates and make more accurate forecasts for inflation and growth.
In the US, Services PMI rose to 55.2 in July, up from 52.9 in June and above the market estimate of 53.0. This pointed to strong expansion and marked the fastest pace of growth in seven months. Manufacturing headed the opposite direction, falling from 52.6 in June, a 37-month high, to 49.5. This was the first contraction since December, with new orders and employment falling.
The Mighty US Dollar: At A CrossroadsThe value of the US Dollar currently sits at an interesting place, both from a fundamental and a technical standpoint. Is this the beginning of the end for the Dollar, as the world's reserve currency? Or will America prevail once more?

EUR/USD Update: Bullish Momentum Builds The euro just popped above $1.17 as optimism grows around a potential US-EU trade deal, following the recent US-Japan agreement. 📊
From a technical perspective:
• The euro found support at the April high of 1.1573, rebounding sharply — a strong sign that the bull trend is still intact. 🚀
• Next resistance levels to watch:
o 1.1830 – July’s high 📅
o 1.1850 – Top of a long-term channel from 2022 📈
o 1.2000 – The 200-month moving average, a major long-term target that often attracts price reaction 🔄
📌 Key takeaway: The path of least resistance remains to the upside, with momentum building toward 1.18+ in the near term.
Disclaimer:
The information posted on Trading View is for informative purposes and is not intended to constitute advice in any form, including but not limited to investment, accounting, tax, legal or regulatory advice. The information therefore has no regard to the specific investment objectives, financial situation or particular needs of any specific recipient. Opinions expressed are our current opinions as of the date appearing on Trading View only. All illustrations, forecasts or hypothetical data are for illustrative purposes only. The Society of Technical Analysts Ltd does not make representation that the information provided is appropriate for use in all jurisdictions or by all Investors or other potential Investors. Parties are therefore responsible for compliance with applicable local laws and regulations. The Society of Technical Analysts will not be held liable for any loss or damage resulting directly or indirectly from the use of any information on this site.

EURUSD Q3 | D23 | W30 | Y25📊EURUSD Q3 | D23 | W30 | Y25
Daily Forecast🔍📅
Here’s a short diagnosis of the current chart setup 🧠📈
Higher time frame order blocks have been identified — these are our patient points of interest 🎯🧭.
It’s crucial to wait for a confirmed break of structure 🧱✅ before forming a directional bias.
This keeps us disciplined and aligned with what price action is truly telling us.
📈 Risk Management Protocols
🔑 Core principles:
Max 1% risk per trade
Only execute at pre-identified levels
Use alerts, not emotion
Stick to your RR plan — minimum 1:2
🧠 You’re not paid for how many trades you take, you’re paid for how well you manage risk.
🧠 Weekly FRGNT Insight
"Trade what the market gives, not what your ego wants."
Stay mechanical. Stay focused. Let the probabilities work.
FRGNT

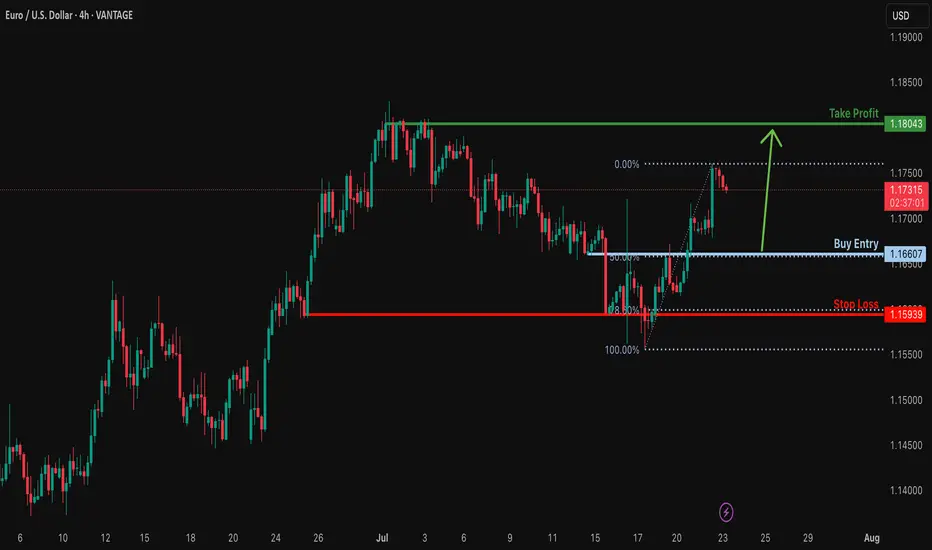
Bullish bounce?EUR/USD is falling towards the support level which is a pullback support that aligns with the 50% Fibonacci retracement and could bounce to from this level to our take profit.
Entry: 1.1660
Why we like it:
There is a pullback support that lines up with the 50% Fibonacci retracement.
Stop loss: 1.1593
Why we like it:
There is a multi swing low support that is slightly below the 78.6% Fibonacci retracement.
Take profit: 1.1813
Why we like it:
There is a swing high resistance.
Enjoying your TradingView experience? Review us!
Please be advised that the information presented on TradingView is provided to Vantage (‘Vantage Global Limited’, ‘we’) by a third-party provider (‘Everest Fortune Group’). Please be reminded that you are solely responsible for the trading decisions on your account. There is a very high degree of risk involved in trading. Any information and/or content is intended entirely for research, educational and informational purposes only and does not constitute investment or consultation advice or investment strategy. The information is not tailored to the investment needs of any specific person and therefore does not involve a consideration of any of the investment objectives, financial situation or needs of any viewer that may receive it. Kindly also note that past performance is not a reliable indicator of future results. Actual results may differ materially from those anticipated in forward-looking or past performance statements. We assume no liability as to the accuracy or completeness of any of the information and/or content provided herein and the Company cannot be held responsible for any omission, mistake nor for any loss or damage including without limitation to any loss of profit which may arise from reliance on any information supplied by Everest Fortune Group.
EUR/USD – The Cleanest Buy Setup This Quarter
Channel respecting every pivot.
Liquidity beneath – Smart Money needs fuel.
This is not an entry.
This is a precision blueprint.
🔹 Tap into the demand zones at 1.15824 or 1.13862, and ride the next impulse to 1.19614+
Wave D correction underway.
Wave E coming to steal the spotlight.
🧠 Elliott wave structure. Liquidity mapping. Channel geometry.
You’re either chasing price... or anticipating it. I prefer the second.
📍Forex | Where Price Meets Purpose
—
#EURUSDSetup | #WaveEIncoming | #SmartMoneyMoves | #ForexBlueprint | Forex | Trading | #InstitutionalFlow | #LiquidityHunt
---

CHECK EURUSD SIGNAL UPDATE GO AND READ CAPTAINEntry Point: Around 1.17350 TO 1.17250
Take Profit 1: 1.16900
Take Profit 2: 1.16450
Last Target: 1.16050
Stop Loss: 1.17800

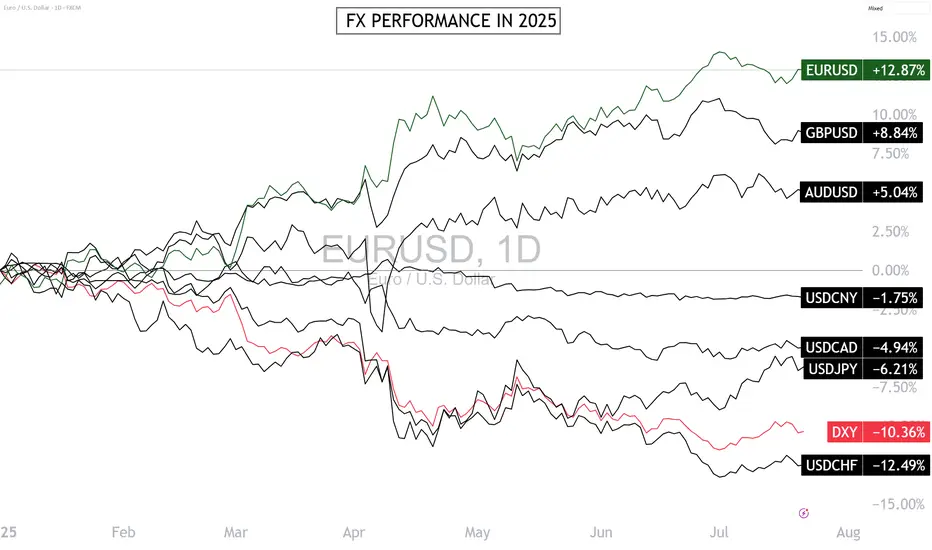
Can the Euro-Dollar Maintain Its Leadership in the FX Market?The Euro-Dollar is the best-performing major FX pair in 2025, and a short-term consolidation phase has begun below $1.18. This strength of the euro-dollar is surprising given the divergence in monetary policies. Can the euro-dollar go higher this year? How can this strength be explained fundamentally? In this week of ECB monetary policy decision (Thursday, July 24), let’s take a technical and fundamental look at the euro-dollar, which is stalling after reaching the technical resistance at $1.18.
1) Euro-Dollar’s Leadership in 2025 Defies the Logic of Monetary Policy Divergence
2025 is proving surprising in the FX market: the euro-dollar (EUR/USD) is the top-performing pair, with a gain of over 12% since the beginning of the year. This outperformance is puzzling if we rely on classic monetary fundamentals. The divergence between the Federal Reserve (Fed) and the European Central Bank (ECB) should favor the dollar.
The Fed maintains a prolonged monetary status quo with high rates due to persistent inflation and labor market tensions. In contrast, the ECB continued its rate-cutting cycle, reflecting a weaker European economy and better-contained inflation. Theoretically, this monetary asymmetry should have strengthened the dollar — yet the euro leads. This paradox is explained by a combination of fundamental factors.
2) Unexpected Fundamentals Are Driving the Euro-Dollar’s Strength in 2025
The euro-dollar’s bullish trend this year ignores the interest rate differential between the Fed and the ECB, both current and projected for the end of 2025.
Here’s a summary of the bullish fundamentals that allowed the euro-dollar to overlook monetary divergence:
• Trump administration’s fiscal policy raises concerns over U.S. debt sustainability (see long-term bond yields)
• Trade war initiated by the Trump administration creates economic slowdown risks for U.S. companies heavily reliant on international trade
• U.S. administration’s political will to improve currency competitiveness for exporters
• European stocks catching up to U.S. stocks in valuation
• Emerging markets’ will to diversify their public debt issuance
• Euro catching up as a global reserve currency as diversification away from the U.S. dollar
• Germany’s structural shift in fiscal and debt policy with massive investments in defense and industry
• EU stimulus spending and the ECB’s perceived monetary policy coherence
3) Is $1.18 the Final High for the Euro-Dollar in 2025? Probably Not.
The euro-dollar has been consolidating since early July after hitting $1.18. Is this the peak for the year? The answer is no — unless EUR/USD breaks below the $1.13/$1.15 support and unless institutional net positions reverse from their upward trend (see yellow line in CFTC COT data).
DISCLAIMER:
This content is intended for individuals who are familiar with financial markets and instruments and is for information purposes only. The presented idea (including market commentary, market data and observations) is not a work product of any research department of Swissquote or its affiliates. This material is intended to highlight market action and does not constitute investment, legal or tax advice. If you are a retail investor or lack experience in trading complex financial products, it is advisable to seek professional advice from licensed advisor before making any financial decisions.
This content is not intended to manipulate the market or encourage any specific financial behavior.
Swissquote makes no representation or warranty as to the quality, completeness, accuracy, comprehensiveness or non-infringement of such content. The views expressed are those of the consultant and are provided for educational purposes only. Any information provided relating to a product or market should not be construed as recommending an investment strategy or transaction. Past performance is not a guarantee of future results.
Swissquote and its employees and representatives shall in no event be held liable for any damages or losses arising directly or indirectly from decisions made on the basis of this content.
The use of any third-party brands or trademarks is for information only and does not imply endorsement by Swissquote, or that the trademark owner has authorised Swissquote to promote its products or services.
Swissquote is the marketing brand for the activities of Swissquote Bank Ltd (Switzerland) regulated by FINMA, Swissquote Capital Markets Limited regulated by CySEC (Cyprus), Swissquote Bank Europe SA (Luxembourg) regulated by the CSSF, Swissquote Ltd (UK) regulated by the FCA, Swissquote Financial Services (Malta) Ltd regulated by the Malta Financial Services Authority, Swissquote MEA Ltd. (UAE) regulated by the Dubai Financial Services Authority, Swissquote Pte Ltd (Singapore) regulated by the Monetary Authority of Singapore, Swissquote Asia Limited (Hong Kong) licensed by the Hong Kong Securities and Futures Commission (SFC) and Swissquote South Africa (Pty) Ltd supervised by the FSCA.
Products and services of Swissquote are only intended for those permitted to receive them under local law.
All investments carry a degree of risk. The risk of loss in trading or holding financial instruments can be substantial. The value of financial instruments, including but not limited to stocks, bonds, cryptocurrencies, and other assets, can fluctuate both upwards and downwards. There is a significant risk of financial loss when buying, selling, holding, staking, or investing in these instruments. SQBE makes no recommendations regarding any specific investment, transaction, or the use of any particular investment strategy.
CFDs are complex instruments and come with a high risk of losing money rapidly due to leverage. The vast majority of retail client accounts suffer capital losses when trading in CFDs. You should consider whether you understand how CFDs work and whether you can afford to take the high risk of losing your money.
Digital Assets are unregulated in most countries and consumer protection rules may not apply. As highly volatile speculative investments, Digital Assets are not suitable for investors without a high-risk tolerance. Make sure you understand each Digital Asset before you trade.
Cryptocurrencies are not considered legal tender in some jurisdictions and are subject to regulatory uncertainties.
The use of Internet-based systems can involve high risks, including, but not limited to, fraud, cyber-attacks, network and communication failures, as well as identity theft and phishing attacks related to crypto-assets.