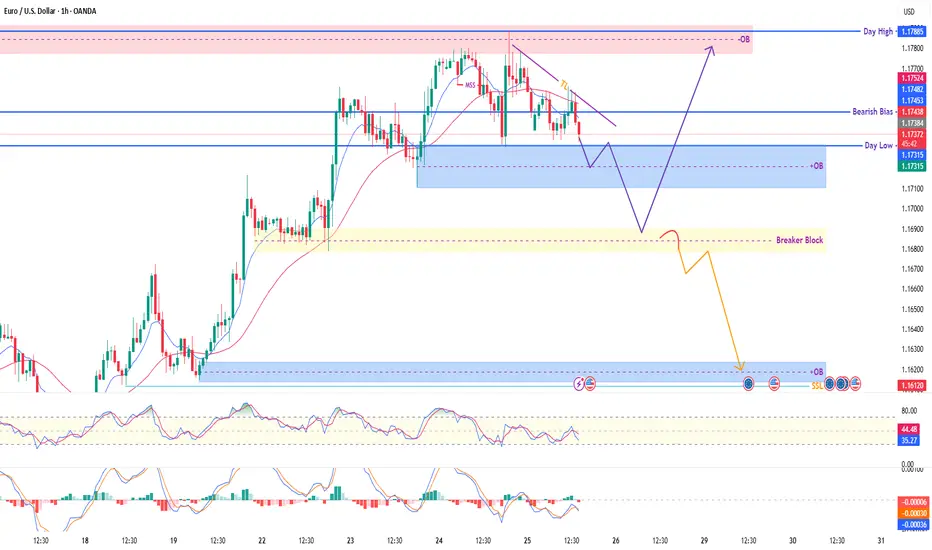
EUR/USD (1H) – Price Compression Near Decision Zone🔍 Market Insight:
The pair is hovering just above a fresh bullish OB zone, after forming a Market Structure Shift (MSS) and showing signs of bearish exhaustion. The chart outlines two clean scenarios – a potential reversal into premium OB or a deeper sweep toward the SSL below.
🧠 Smart Money Concepts Applied:
🔄 MSS + Trendline Liquidity (TL)
🧱 Order Blocks (OB) marked at high accuracy
⚡ Liquidity sweep potential toward SSL
🟨 Breaker Block acting as retest trap zone
📍 Key Price Zones:
🔴 Premium OB (Supply): 1.1752 – 1.1788
🔵 Demand OB (Buy Zone): 1.1731 – 1.1713
🟨 Breaker Block: ~1.1685 – 1.1700
🟦 Major Buy POI / SSL Trap Zone: 1.1612
🔵 Day High / Day Low: 1.1788 / 1.1733
📈 Scenario A – Bullish Reversal (Purple Path):
Price taps OB @ 1.1713 → reversal expected
First target: 1.1744 Bearish Bias Zone
Second target: 1.1788 OB
✅ Confirmation needed via bullish engulfing or BOS on LTF
📉 Scenario B – Liquidity Grab + Deeper Drop (Orange Path):
If OB fails, price may dive into the Breaker Block
Rejection from there can lead to the SSL sweep @ 1.1612
⚠️ This would trap breakout buyers & sweep below liquidity before bullish re-alignment
🎯 Trade Idea (Example – Scenario A):
Buy Limit: 1.1715
SL: 1.1695
TP1: 1.1744
TP2: 1.1785
Risk-Reward: ~1:3+
✅ Suggested TradingView Caption:
EUR/USD (1H) – Waiting for Liquidity Play
Price is consolidating near OB support with potential reversal to the premium zone. Two clean scenarios: a bullish break toward 1.1788 OB, or a liquidity sweep through the breaker block and into 1.1612 SSL.
RSI cooling off, MACD showing divergence. Staying patient for confirmation.
📘 Educational idea – not financial advice.
EURUSD trade ideas
Watch out for EURUSDEURUSD continues to move sideways above the support zone.
This week, the key event is the ECB’s interest rate decision.
Keep an eye on whether there's enough momentum for a breakout above 1,1720.
If it gets rejected again, we might see a deeper correction.

will it rise then fall or will it fall first then rise?Two different scenarios for EURUSD, is it a rise then a fall or a fall first then a rise.
To answer this question, we need to look at the economic data that was expected last week, especially on Friday, which shows short-term inflation. This path could be in the wake of a US interest rate cut.

EUR/USD LIVE TRADE UPDATE📍Trade in Progress – Key S/R Retest
Price is currently pulling back into the same S/R zone we sold from.
If price breaks and closes above this zone, the setup could be invalidated.
However, this level has shown strong historical structure, and we may see a rejection here.
We’re watching closely for:
A sign of momentum turning
A potential engulfing candle confirming rejection
📌 A strong zone can hold—but we don’t guess. We observe and react with discipline.

EURUSD ahead of the ECBYesterday, EURUSD continued its bullish movement, reaching 1,1780.
Today, the ECB will announce its decision on interest rates.
The news is scheduled for 1:15 PM, followed by a press conference 30 minutes later.
Expect possible sharp and misleading price movements — reduce your risk and avoid rushing into new positions!

Dollar dips as politics cloud Fed picture | FX ResearchThe dollar extended its slide on Tuesday, weighed down by soft US regional data and renewed political pressure on the Fed, reinforcing the market's dovish bias. The Richmond Fed manufacturing index plunged to -20, far below expectations, while business conditions and the Philly Fed survey showed slight improvements but remained in contractionary territory.
Treasury Secretary Bessant added to the day's drama with mixed messaging, praising Fed Chair Powell's capabilities while simultaneously calling for an internal review and pressing for rate cuts, aligning with President Trump's stance that rates should be 300 basis points lower.
Trade headlines added to the noise with Bessant signaling a hard August 1 deadline for trade talks and Trump announcing a new deal with Indonesia, albeit one that still includes steep tariffs.
With the Fed in blackout mode ahead of its next meeting, markets are left to navigate a fog of political theatrics and economic uncertainty. The euro climbed to near one-month highs as the dollar softened. And traders now turn to upcoming US data and a heavy Treasury supply schedule for further direction.
Exclusive FX research from LMAX Group Market Strategist, Joel Kruger

Eurousd techinical analysis.Eurousd techinical analysis next move posibale at h1 time frame not finchinal advice.

EURUSD pullbackYesterday, EURUSD attempted to continue its bullish move but was rejected at 1,1788.
Keep an eye on whether it has the strength for another push higher. If it fails again, a correction is more likely to follow.
The first support levels to watch are 1,1699 and 1,1644.
Next week, the FED’s interest rate decision is due.
That news will likely determine both the direction and timing for entry.

EURUSD: Next Move Is Down! Short!
My dear friends,
Today we will analyse EURUSD together☺️
The price is near a wide key level
and the pair is approaching a significant decision level of 1.17658 Therefore, a strong bearish reaction here could determine the next move down.We will watch for a confirmation candle, and then target the next key level of 1.17506..Recommend Stop-loss is beyond the current level.
❤️Sending you lots of Love and Hugs❤️

CHECK EURUSD SIGNAL READ CAPTAINEntry Point: Around 1.17700 1.17600
Stop Loss: Around 1.18000
🎯 Target Levels
Take Profit 1:
1.17250
Take Profit 2:
1.16900
last target
1.16450

Key resistance for EURUSDYesterday, EURUSD moved higher and reached a key resistance level at 1,1720.
Watch closely to see if there’s enough momentum for a breakout and further upside.
If the price gets rejected, we could see a deeper correction.
Increased volatility is likely on Thursday following the ECB decision.
At the current levels, there’s no clear reason to enter a trade.

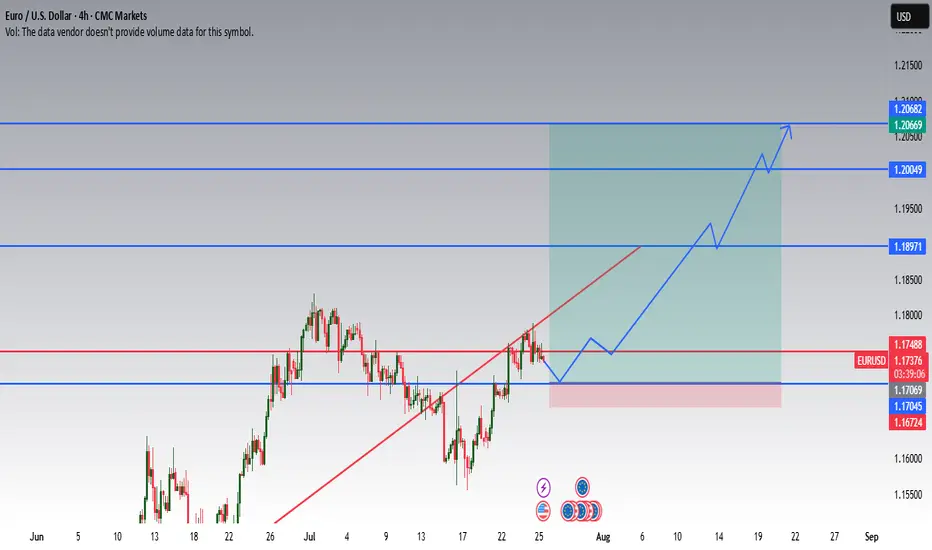
EURUSD Long Setup: Technically and Fundamentally Supported Push 📈 I'm expecting a climb of this pair due to weakening USD.
This idea is based on both technical and fundamental parameters:
🔍 Fundamentals
ECB kept rates unchanged, signaling stability and reluctance to tighten policy further.
FED is expected to cut rates in 5 days, as inflation eases and growth concerns rise in the US.
A weaker dollar is likely to support EURUSD strength.
1.20 is a psychological and political level – above that, European exporters begin to suffer, and ECB might intervene verbally or with policy action.
🧠 Technical Setup
Price has reclaimed a key support zone around 1.17069 – 1.17488, with consolidation signaling accumulation.
Break of the descending trendline shows bullish intent.
Next major resistance lies at 1.18971, followed by 1.20049 – a strong historical level and likely ECB reaction zone.
Final target at 1.20669 – 1.20682 marked by previous highs.
Entry Zone: 1.17045–1.17488 (current area of interest)
Stop Loss: Below 1.16724
Targets: 1.18971 / 1.20049 / 1.20669
💬 Feel free to monitor price action at key zones. Entry should be based on reaction at support or a confirmed breakout. This is not a blind entry setup.
📅 If the FED cuts rates as expected, USD weakness could accelerate the move.
EURUSD NEW IDEASee the chart above, were on decling its momentum, I believe more trap longs this move.
SEE it in 2 days how things works. targets see charts.
I don't really explain to gain more tractions on how trading works.
I am here to understand the movement. Don't complicate too much, If you're a swing trader, take it a leap and have patience. stick to your own proper stoploss.
Trade it or leave it.
Goodluck folks.

EURUSD : Status @ 23/7Direction: Buy
Signal triggered: 23/7/2025
Stop when:
a) Stop Loss @ 1.1700 ; or if
b) Sell signal triggered
Action:
Buy the dip
Good luck.
P/S: Note that the Buyer finally won the battle. But it did so, fighting the Seller all the way to the top. Now, they are at 1.1790 resistance with a potential to reach the long-term D @ 1.1900/30. My preference is not to buy. Instead, wait for a SELL as it is a bit late now to buy.

EURUSDI am thinking that a Wycoff pattern during a strong uptrend has formed up. I'll put a buy limit order here on 1H time frame and let it run and see what happens.

EURUSD BUY TRADE PLAN WITH CAUTIONEURUSD TRADE PLAN** 🔥
📅 Date: July 23, 2025
---
### 📋 Trade Plan Overview
| Plan ID | Type | Direction | Confidence | R\:R | Status |
| ----------------- | -------- | ----------------- | ---------- | ----- | ---------- |
| EURUSD-20250723-A | Swing | **Buy** (Primary) | ⭐⭐⭐⭐ (80%) | 3.5:1 | 🕒 Waiting |
| EURUSD-20250723-B | Tactical | Sell (Alt. Setup) | ⭐⭐⭐ (65%) | 2.5:1 | 🕒 Waiting |
🧭 **Guidance:**
Favor the **buy plan** due to HTF trend and liquidity sweep setup. Sell setup is tactical against trend.
---
## 📈 Market Bias & Trade Type
* **Bias:** Bullish overall (HTF)
* **Trade Type A:** Continuation (Buy) - PRIMARY / PREFERRED
* **Trade Type B:** Countertrend (Sell) - ALTERNATIVE
---
## 🔰 Confidence Level Breakdown
* ⭐⭐⭐⭐ 80% (Buy Plan A)
* H4 OB + Volume Imbalance = 35%
* Fib Confluence = 25%
* Sentiment Score +6/10 = 10%
* DXY Divergence = 10%
* ⭐⭐⭐ 65% (Sell Plan B)
* Short-term exhaustion pattern
* Inducement to the downside
---
## 📍 Entry Zones & Status
### 🟩 **Primary Buy Zone**
* **Zone:** 1.1680 – 1.1705 (H4 OB + Fib 61.8%)
* **Status:** 🕒 *Waiting*
### 🟧 **Secondary Buy Zone**
* **Zone:** 1.1640 – 1.1660 (Deeper imbalance)
* **Status:** 🕒 *Waiting*
---
### 🟥 **Sell Zone (Scenario B)**
* **Zone:** 1.1760 – 1.1790 (Liquidity sweep, bearish engulfing risk)
* **Status:** 🕒 *Waiting*
---
## ❗ Stop Loss Levels
* **Buy SL:** 1.1620 (Below OB + 1.5x ATR)
* **Sell SL:** 1.1815 (Above H4 supply & wick inducement)
---
## 🎯 Take Profit Targets
* 🥇 **TP1:** 1.1745 (OB imbalance reclaim) – \~65 pips
* 🥈 **TP2:** 1.1785 (Swing high) – \~100 pips
* 🥉 **TP3:** 1.1840 (Full extension / trail) – *Swing only*
---
## 📏 Risk\:Reward
* Buy Plan A: **3.5:1** to TP2, **5.2:1** to TP3
* Sell Plan B: **2.5:1** to TP2
---
## 🧠 Management Strategy
* Risk: 1.0% of account ($\ , \ lots)
* SL to breakeven at TP1
* Take: 30% at TP1, 50% at TP2, trail final 20%
* Exit if: H4 BOS or USD Index flips strongly bullish
---
## ⚠️ Confirmation Checklist
* Bullish engulfing or inside bar (H1-H4)
* Volume confirmation on bounce (preferably NY or London open)
* Optional: M30 RSI divergence
* **Avoid:** FOMC / ECB pressers
---
## ⏳ Validity
* **Buy Plan (H4):** Valid 48–72 hours → until July 26
* **Sell Plan (H1):** Valid 12–16 hours → intraday only
---
## ❌ Invalidation Conditions
* Close below 1.1620 (Buy)
* Close above 1.1815 (Sell)
* Major USD macro shift
---
## 🌐 Fundamental & Sentiment Snapshot
* COT: USD weak bias
* DXY: Retracing lower from 106.00
* Retail: 68% short EURUSD
* Cross-Pair: EURGBP also trending up
* Macro: EUR resilience post-ECB minutes
* Sentiment Score: **+6/10**
---
## 📋 Final Trade Summary
🟩 **Buy plan is preferred**, aligned with HTF trend, clean OB-Fib structure, and good RR.
🟥 **Sell plan** is tactical, potential liquidity grab before bullish continuation.
Both setups allow flexibility with proper confirmation and risk control.
---
Major EUR-related news is scheduled this week, and it's critical to factor into both trade timing and plan execution. Here's your ⚠️ Fundamental Update for EURUSD:
🌐 EUR Fundamental Events – This Week
Date Event Time (UTC) Impact Level Forecast / Notes
July 24 (Wed) 🇪🇺 Eurozone PMIs (Manu. & Services) 08:00 UTC 🔴 High Strong driver of EUR intraday volatility
July 25 (Thu) 🇪🇺 ECB Interest Rate Decision 12:15 UTC 🔴🔴🔴 Very High Key market mover – Dovish = bearish EUR
ECB Press Conference 12:45 UTC 🔴🔴🔴 Critical High volatility expected
July 26 (Fri) 🇩🇪 IFO Business Climate 08:00 UTC 🟡 Medium Impactful for EUR strength sentiment
🔍 Implications for Your EURUSD Trade Plan
✅ Buy Plan
Wait until post-ECB OR only take the setup with strong candle confirmation, ideally after NY session pullback.
Hold reduced exposure before July 25 ECB to avoid whipsaw.
❌ Sell Plan
Be extremely cautious; if ECB is neutral/hawkish, any tactical short may get invalidated rapidly.
If you take the short, exit before Thursday's ECB, unless trailing with SL to breakeven.
📊 Summary:
Yes, major EUR events this week — especially Thursday's ECB — could invalidate technical setups or accelerate them violently. Patience + confirmation = priority. Avoid entry during red events. Let volatility settle.
Let me know if you'd like to pause your trade plan until post-news or want a modified low-volatility alternative!
🧠 Always manage risk tightly around macro events. This is not investment advice.
🧠 Fundamental Snapshot
🔵 EUR Macro Landscape:
Factor Signal Explanation
Inflation 🔼 Still elevated Keeps ECB hawkish bias alive
ECB Policy ⚠️ Potentially hawkish hold Market expects no cut, but hawkish tone could push EUR higher
Economic Activity ⚪ Mixed PMIs Slight slowdown, but not recessionary
COT/Positioning 🟢 Light EUR longs Room for upside without overcrowding
Retail Sentiment 🔴 Bearish crowd Contrarian signal supports buys
USD Pressure 🟠 Mixed Fed possibly done hiking, but US economy resilient
⚠️ ECB SCENARIOS (July 25):
Scenario Likelihood Market Reaction
🟢 Hawkish Hold (no cut, firm inflation tone) 60% 🔼 EURUSD likely rallies
🟡 Neutral/Dovish Hold 30% 🔄 EUR consolidates or fades spike
🔴 Surprise Cut / Dovish Pivot 10% 🔽 EUR drops hard – buy invalidated
Most institutional forecasts lean toward a hawkish or neutral hold, giving EURUSD room to rise after the event.
🎯 Conclusion:
✅ Fundamentals support a buy, especially post-ECB.
❗ Best entry is after July 25, when market digests Lagarde's tone.
🔄 If entering early, stay small and manage risk very tightly — ECB surprises = volatility.
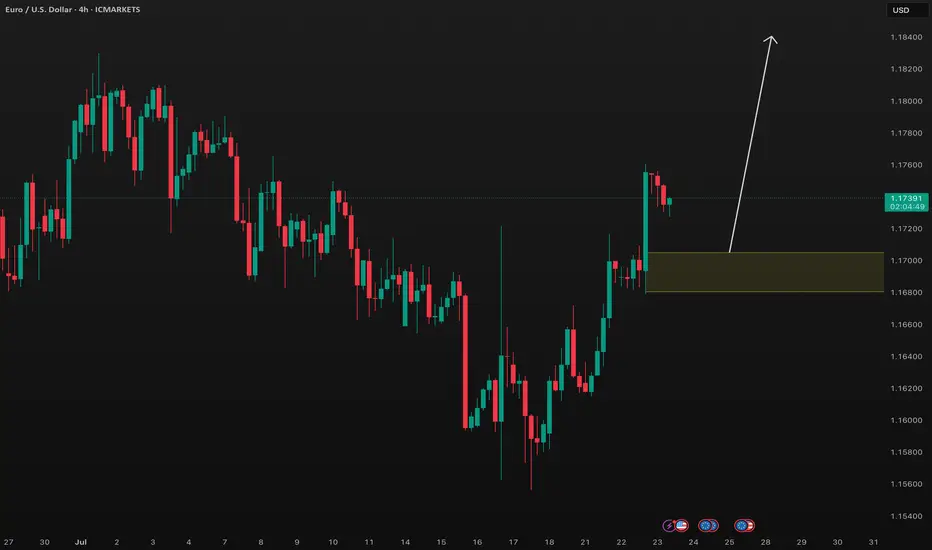
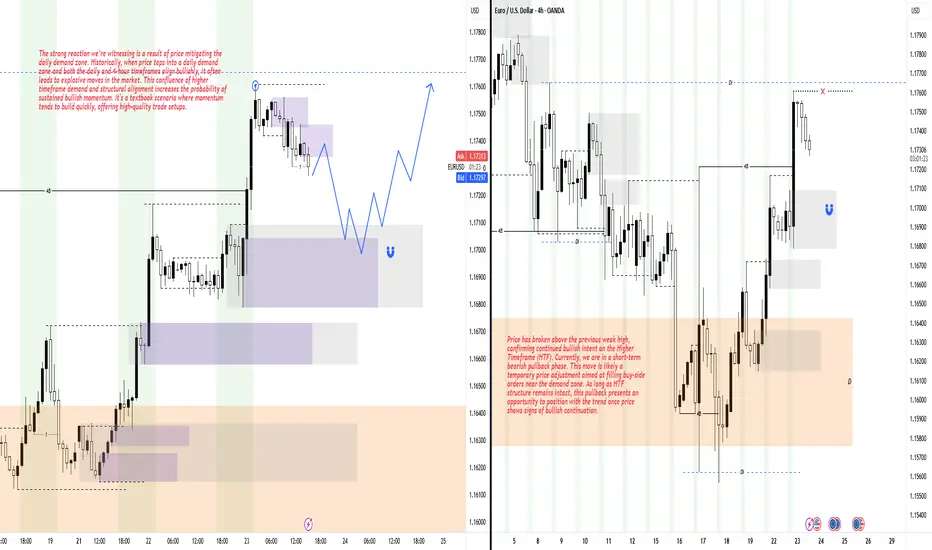
Short-Term Pullback Within a Bullish Higher Timeframe StructureHey Traders, hope you're all doing well! 👋
Price has recently broken above the previous weak high, showing strong bullish momentum. At the moment, we're seeing a short-term bearish pullback — a common market behavior aimed at filling buy orders near the demand zone.
Despite this minor retracement, the Higher Timeframe (HTF) remains firmly bullish. As long as that structure holds, this pullback could present a solid opportunity to rejoin the trend. Wait for bullish confirmation before executing any entries to stay aligned with the prevailing market direction.
The Day AheadKey Data Releases:
US:
Philadelphia Fed non-manufacturing activity – A pulse-check on services sector strength. Positive surprise could boost USD and Treasury yields.
Richmond Fed manufacturing & business conditions – Insight into regional factory health; any contraction signals broader economic weakness.
UK:
June Public Finances – Higher borrowing may raise concerns about fiscal headroom, putting pressure on gilts and GBP.
France:
June Retail Sales – A soft read may point to waning consumer demand, affecting Eurozone growth expectations.
Central Banks:
Fed Chair Powell Speaks:
Market-sensitive. Traders will watch closely for clues on rate cut timing—September odds remain high.
ECB Lending Survey:
Tightening credit standards may reinforce the case for ECB to hold or ease. Could weigh on EUR if dovish tones dominate.
BoE Governor Bailey Speaks:
Could guide GBP volatility. Hawkish lean might delay rate cut pricing.
RBA July Minutes:
Will reveal internal debate over inflation and growth. May impact AUD if dovish or hint at hikes.
Earnings to Watch:
Tech & Industrials:
SAP, Texas Instruments, RTX, Lockheed Martin, Northrop Grumman – Key for assessing global capex and defense spending cycles.
Texas Instruments: A bellwether for chip demand—guidance will drive semiconductor sentiment.
Lockheed/Northrop: Defense outlook in focus amid geopolitical tensions.
Consumer & Financials:
Coca-Cola, Capital One, Equifax, General Motors, Sherwin-Williams – Consumer strength, credit conditions, and input cost pressures in focus.
Capital One, Equifax: Loan growth and credit quality trends will signal consumer resilience or stress.
GM: Comments on EV outlook and pricing will be market-moving.
Healthcare & Industrials:
Intuitive Surgical, Danaher, Sartorius: Indicators of medtech demand and R&D cycles.
Trading Implications:
Expect rate-sensitive assets (USD, US yields, GBP) to move on central bank commentary.
Risk sentiment may shift post-earnings depending on guidance, especially from tech and defense names.
Watch EUR reaction to ECB lending data; dovish tilt may push EUR/USD lower.
AUD volatility possible if RBA minutes are unexpectedly hawkish or dovish.
This communication is for informational purposes only and should not be viewed as any form of recommendation as to a particular course of action or as investment advice. It is not intended as an offer or solicitation for the purchase or sale of any financial instrument or as an official confirmation of any transaction. Opinions, estimates and assumptions expressed herein are made as of the date of this communication and are subject to change without notice. This communication has been prepared based upon information, including market prices, data and other information, believed to be reliable; however, Trade Nation does not warrant its completeness or accuracy. All market prices and market data contained in or attached to this communication are indicative and subject to change without notice.

EURUSD H1 I Bullish Bounce Off Based on the H1 chart analysis, the price is falling toward our buy entry level at 1.1667 a pullback support that aligns with the 50% Fib retracement.
Our take profit is set at 1.1706, a swing high resistance.
The stop loss is placed at 1.1642, a pullback support.
High Risk Investment Warning
Trading Forex/CFDs on margin carries a high level of risk and may not be suitable for all investors. Leverage can work against you.
Stratos Markets Limited (tradu.com ):
CFDs are complex instruments and come with a high risk of losing money rapidly due to leverage. 66% of retail investor accounts lose money when trading CFDs with this provider. You should consider whether you understand how CFDs work and whether you can afford to take the high risk of losing your money.
Stratos Europe Ltd (tradu.com ):
CFDs are complex instruments and come with a high risk of losing money rapidly due to leverage. 66% of retail investor accounts lose money when trading CFDs with this provider. You should consider whether you understand how CFDs work and whether you can afford to take the high risk of losing your money.
Stratos Global LLC (tradu.com ):
Losses can exceed deposits.
Please be advised that the information presented on TradingView is provided to Tradu (‘Company’, ‘we’) by a third-party provider (‘TFA Global Pte Ltd’). Please be reminded that you are solely responsible for the trading decisions on your account. There is a very high degree of risk involved in trading. Any information and/or content is intended entirely for research, educational and informational purposes only and does not constitute investment or consultation advice or investment strategy. The information is not tailored to the investment needs of any specific person and therefore does not involve a consideration of any of the investment objectives, financial situation or needs of any viewer that may receive it. Kindly also note that past performance is not a reliable indicator of future results. Actual results may differ materially from those anticipated in forward-looking or past performance statements. We assume no liability as to the accuracy or completeness of any of the information and/or content provided herein and the Company cannot be held responsible for any omission, mistake nor for any loss or damage including without limitation to any loss of profit which may arise from reliance on any information supplied by TFA Global Pte Ltd.
The speaker(s) is neither an employee, agent nor representative of Tradu and is therefore acting independently. The opinions given are their own, constitute general market commentary, and do not constitute the opinion or advice of Tradu or any form of personal or investment advice. Tradu neither endorses nor guarantees offerings of third-party speakers, nor is Tradu responsible for the content, veracity or opinions of third-party speakers, presenters or participants.

EURUSD Will Go Up! Long!
Please, check our technical outlook for EURUSD.
Time Frame: 2h
Current Trend: Bullish
Sentiment: Oversold (based on 7-period RSI)
Forecast: Bullish
The market is approaching a significant support area 1.166.
The underlined horizontal cluster clearly indicates a highly probable bullish movement with target 1.170 level.
P.S
Overbought describes a period of time where there has been a significant and consistent upward move in price over a period of time without much pullback.
Disclosure: I am part of Trade Nation's Influencer program and receive a monthly fee for using their TradingView charts in my analysis.
Like and subscribe and comment my ideas if you enjoy them!

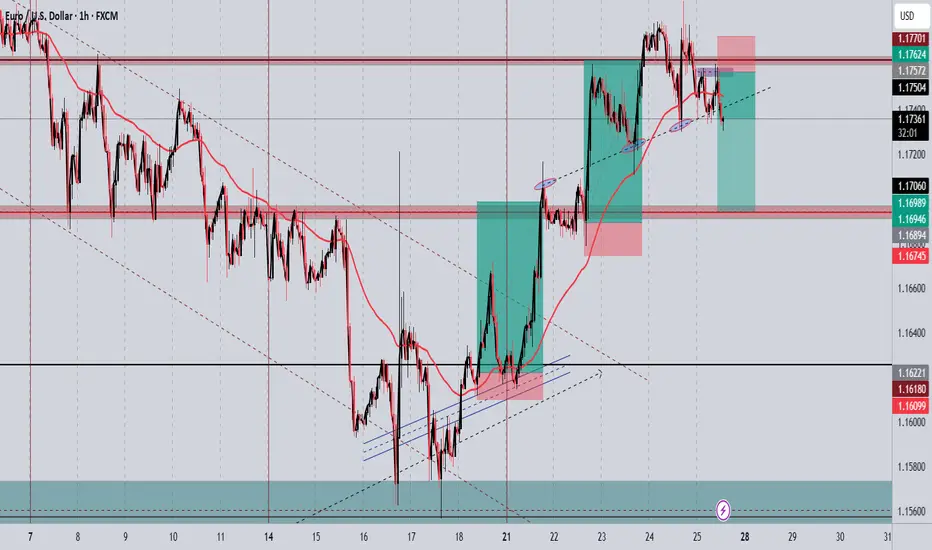
EUR/USD Short Setup – Bearish Reversal OpportunityPrice has rejected near resistance, forming lower highs.
Potential bearish divergence on momentum indicators (RSI/MACD).
Market sentiment suggests euro strength may be cooling after recent ECB hold.
Dollar shows signs of stabilization, adding downward pressure to the pair.
🔹 Trade Details:
Entry: 1.17572
Take Profit: 1.16946