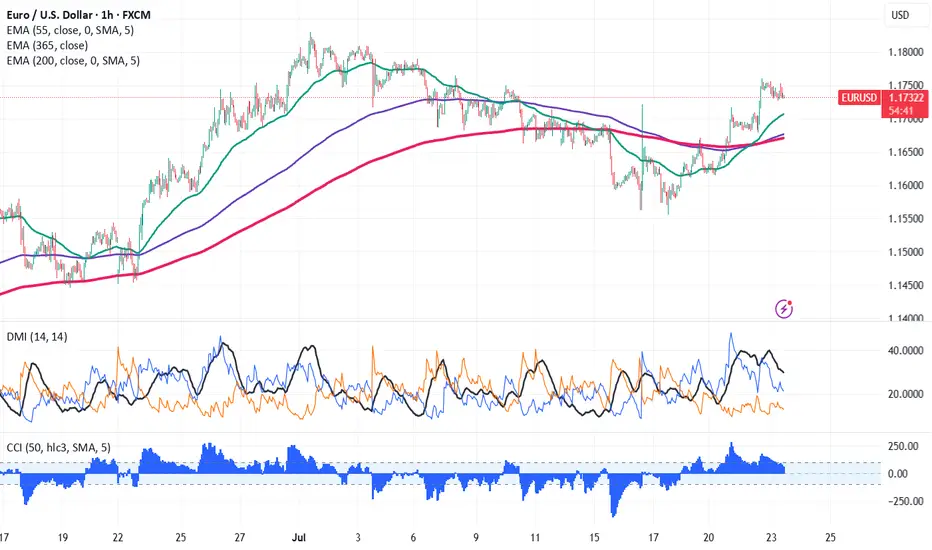
Euro Rallies Past 1.1750—Can the Uptrend Continue? EUR/USD surged above 1.1750 on easing trade tension. It hit an intraday low of 1.17604 and is currently trading around 1.117428. Overall trend remains bullish as long as support 1.1670 holds.
The pair is holding above the 55 EMA,above 200 EMA, and 365 EMA in the 1 -hour chart. Near-term resistance is seen at 1.1765, a break above this may push the pair to targets of 1.1800/1.1835/1.19090/1.1956/1.200. On the downside, support is seen at 1.1700; any violation below will drag the pair to 1.1670/1.1600/1.155.
Market Indicators and Trading Strategy
Commodity Channel Index (CCI)- Bullish
Average Directional Movement Index (ADX) - Neutral
It is good to buy on dips around 1.1720 with a stop-loss at 1.1665 for a target price of 1.1835.
EURUSD trade ideas
EURUSD Breaks Bullish Structure – Here’s My Trade Plan📍 Watching EURUSD closely—it's recently broken bullish (market structure) on the daily timeframe 📈.
I’m now waiting for a retrace into a fair value gap, watching for the rebalance and a possible support zone touch before the next leg up 🔄🟢.
🎥 In this idea, I walk you through:
🔍 Price action
🧱 Market structure
📊 Trend direction
📋 And my personal trade plan for this setup
Not financial advice ❌💼

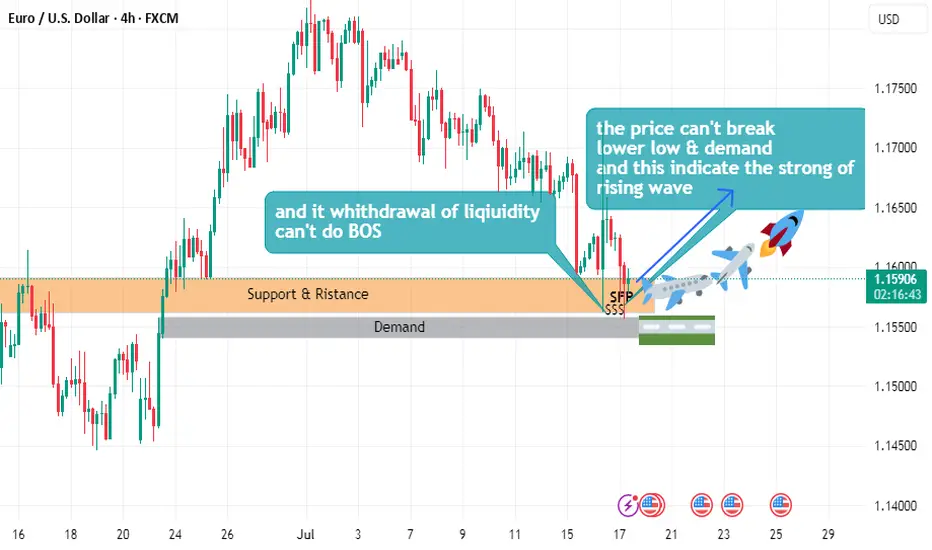
EURUSD buy plane Setuphello
the price can't break lower low
and can't demand
and this indicate the strong of uptrend wave
and it withdrawal of liquidity
and can't do beak of structure
I'm optymist. 1.183-1.185 In front us3 year channel saying that we should to touch it.
Yellow line.
Before us
In my opinion before us is level. 1.18-1.20 before bigger correction until 1.12 even.
Then in few month i see 1.4-1.6

EURUSD – The Comeback is Real! After weeks trapped in a descending channel, EURUSD has broken out in style, launching into a clean bullish channel. Price is now carving a staircase of FVG zones, with momentum clearly favoring the bulls.
What’s fueling the fire?
Flash Manufacturing PMI from Europe beat forecasts
Eurozone consumer confidence improved
Markets pricing in dovish Fed as jobless claims dropped but inflation expectations stall
As long as price stays above 1.1750 and respects the ascending channel, the 1.1850 zone is well within reach.
Strategy: Buy the dips inside the bullish channel. FVGs act as stepping stones for further upside.


Buy Entry EURUSD🎯 Suggested Trade Setup — Bullish Bias Scalping Opportunity
✅ Buy Entry (Aggressive Intra-Day Play)
📍 Entry Zone: Between 1.17430 and 1.17470 (just above SSL and EQL zones)
🎯 Target: 1.17550 (Day High / minor resistance), with potential extension to 1.17600
🛡️ Stop Loss: Below 1.17410 or the lowest OB (~10-15 pips risk)
🔁 Risk-to-Reward Ratio: Aim for at least 1:2 to 1:3
💡 Why this works: You're buying near liquidity pools with minimal downside. If the breaker block holds and momentum picks up, this could be a swift move.

EUR/USD Possible scenarios weekly/daily/4h chart.Possible scenario for EUR/USD based on Weekly-Daily-4h technical and fundamental analyses.

EURUSD on the riseYesterday, EURUSD broke through the 1,1720 resistance level with strong momentum.
This confirms the uptrend and opens up opportunities for buying.
The ECB is set to announce interest rates tomorrow, which could trigger increased market volatility.
Keep an eye out for higher lows and signs of the uptrend continuing.

EUR/USD long: The Fed Chair debacle is getting spicyHello traders
My previous EUR/USD long did not pan out but I am swinging again. My entry order at 1.0563 was filled by the skinny skin of my teeth but so far so good. I'll use a trailing stop for this trade.
The pressure on Fed Chair Powell is being ramped up by Trump's attack dogs with allegations of mismanaging Federal funds(gasp :) ) during the FOMC headquarters.
We all saw the result of the rumor that Powell was fired/is considering resigning yesterday and as much as I am sure it pained DJT, he had to refute the rumor, no doubt on advice from Bessent.
In addition, FOMC board member Waller publicly dissented today and suggested a rate cut at the July meeting.
On the economic calendar we have the ECB rate decision, JOLTS, ADP and finally FOMC over the next two weeks.
This is purely a technical play but I am keeping a close eye on the bond markets, the
CME FedWatch tool and as for trade and tariffs, who cares...
I mentioned the Federal Court of Appeals case regarding the IEEPA court decision starting on 7/31/2025. For anyone interested in the court's decision,
www.cafc.uscourts.gov
More importantly, you can sign up for a notification at courtlistener.com which is a free service.
I have used it in the past and not only is it free but I also received the notification in a very timely manner.
www.courtlistener.com
Best of luck.

CHECK EURUSD SIGNAL READ THE CAPTAINEntry Point: Around 1.16700 1.16530
Stop Loss: Around 1.16000
🎯 Target Levels
Take Profit 1:
1.17100
Take Profit 2:
1.17600
last target
1.18300

EURUSD Analysis week 30🌐Fundamental Analysis
The USD rose after June retail sales beat expectations and initial jobless claims fell to 221,000. However, the USD's gains were limited as US stocks rebounded late in the session.
On Friday morning, US stock index futures rose 0.2%, indicating that risk sentiment remains dominant. If this trend continues, EUR/USD could hold support.
The next focus is on the Consumer Sentiment and Inflation Expectations Index data from the University of Michigan. If the data is positive, the USD could regain support and put pressure on EUR/USD.
🕯Technical Analysis
EURUSD is in a corrective downtrend towards the 1.145 support. If this support zone is broken, the EURUSD trend will turn to a Downtrend. Currently, the main trading strategy will be to look for SELL points. After price reacted at EMA and trendline and headed to temporary bottom 1.156 and hit important support soon.
📈📉Trading Signals
SELL EURUSD 1.17500-1.17700 Stoploss 1.18000
BUY EURUSD 1.14500-1.14300 Stoploss 1.14000

eurusdin this week for eurusd
its break down the line and pullback to it successfully.
now it can goes down to the 1.14550 zoon and if it happens we can wait for head and shoulder pattern .

EUR/USD Bearish Reversal Confirmed – Smart Money Distribution Ne📅 Posted July 18, 2025 | 🔍 VolanX Protocol Insight
📉 Market Outlook:
The EUR/USD pair has rejected the premium supply zone (1.17–1.18) after failing to maintain structure above the red trendline. Price is now breaking down with bearish pressure building toward equilibrium at 1.09544.
📊 VolanX DSS Breakdown:
🔴 Premium Rejection confirms distribution by institutional players.
📈 Trendline Violation + SMC BOS = Shift to markdown phase.
🧠 VolanX Signal Score: Neutral → Bearish
→ Favoring short plays targeting deeper liquidity blocks.
🌐 Macro Narrative (Q3 2025):
🇺🇸 USD Strength: Driven by sticky inflation and delayed Fed cuts (Q4 expected).
🇪🇺 Eurozone Softness: Germany's PMI fell below 50; ECB’s cautious tone continues.
🏦 Rate Divergence Play: US-EU real yield gap widening → capital flowing into USD.
🎯 Probabilistic Target Path (Yellow Line):
✅ 1.1500: First liquidity gap
✅ 1.1150: Midblock retrace
🎯 1.09544: Equilibrium & High-Confidence Institutional Re-entry Zone
🛡️ VolanX Protocol Note:
This forecast is part of the WaverVanir Smart Futures Playbook. All trades are structured with AI-defined probability zones, institutional positioning layers, and macro-event syncing. The VolanX engine will reassess upon retest of the 1.1500 mid-zone.
#EURUSD #Forex #SmartMoney #MacroFX #VolanX #WaverVanir #LiquidityZones #InstitutionalTrading #TechnicalAnalysis #ForexSignals #DXY #Eurozone #FED #ECB #OptionsFlow

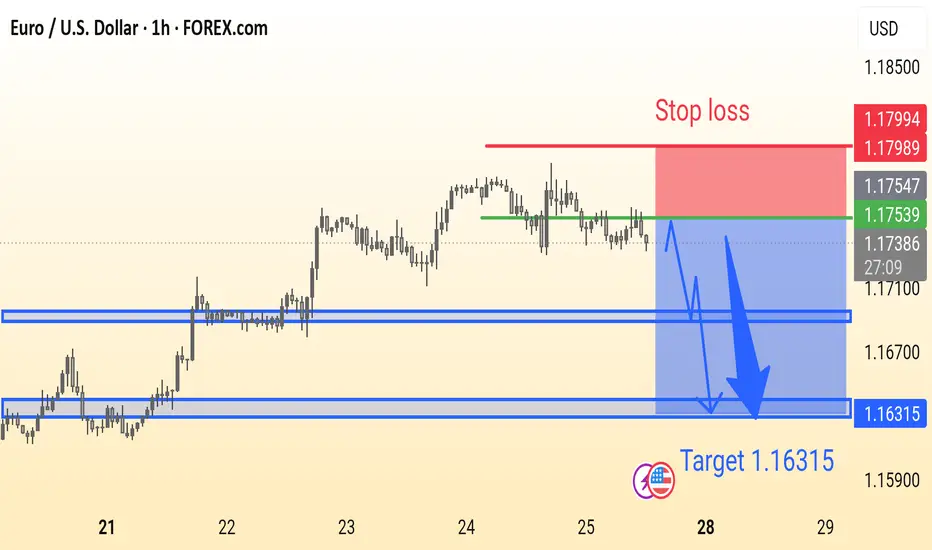
EURUSD Analysis is ReadyEUR/USD Trade Idea (1H Chart):
Price is ranging below resistance with a potential bearish breakout. Suggested Sell near 1.1753 with Stop Loss at 1.1799 and Target at 1.16315. Strong support zones marked for possible reaction.
Eurousd techinical analysis.Eurousd techinical analysis next move posibale at h1 time frame not finchinal advice.

Trading balanceTrading balance The price of the asset has rebounded from the balance zone. With the prospect of growth into the resistance zone.

EURUSD SHORT IDEAFrom my POV theres a high probability for EUR/USD for short as we can look there is market structre shifted already on M30 and H1 which is our confluence for this setup . Our risk to reward is 1 to 4 so its very good for intraday and swing trading . Trade calm , trade safe stick to your plan !

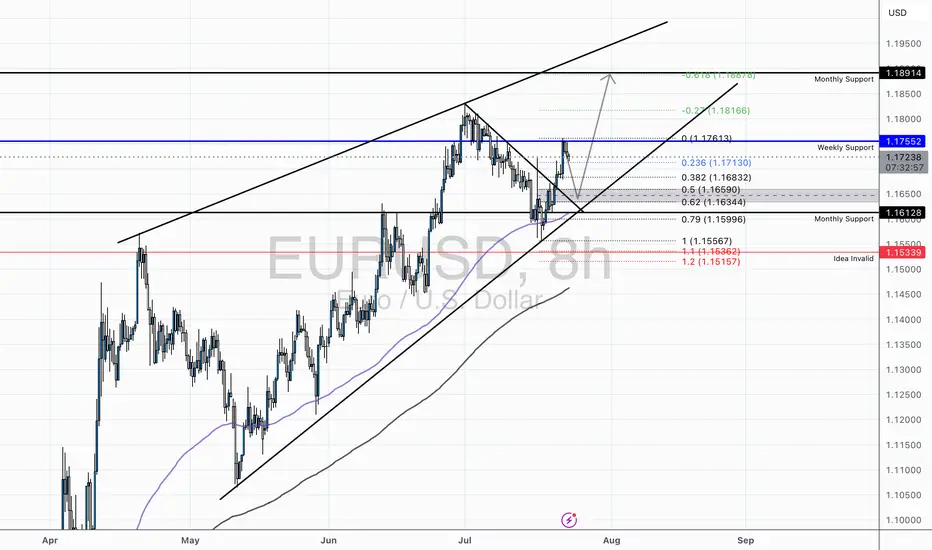
EUR/USD - Holding Bullish Structure Above Key Fibs and TrendlineTechnical Overview:
EUR/USD continues to respect its ascending channel structure, currently rebounding from the lower trendline support while trading above the 50 EMA and 200 EMA. After a healthy retracement to the monthly support (1.16128), the pair has shown strong buying interest, supported by bullish RSI divergence from oversold conditions on the 8H chart.
Key Levels:
Support Zone: 1.1613 – 1.1634 (Fib Cluster + Channel Support + Monthly Support)
Resistance Zone: 1.1755 (Weekly Resistance) followed by 1.1816 (0.27 Fib Extension) and 1.1887 (0.618 Extension)
Invalidation Level: Below 1.1533 (1.272 Fib + Structural Breakdown)
Confluences:
Price broke above a descending correctional trendline, indicating a potential bullish continuation.
Multiple Fibonacci levels (0.382, 0.5, 0.618) have stacked around the previous consolidation area, increasing probability of a sustained move.
RSI bounce from below 40 suggests short-term momentum reversal.
Trade Idea:
We may see a minor pullback into the 1.16344–1.1659 area before a potential continuation higher. Conservative bulls may wait for a retest of this zone with a bullish engulfing or pin bar confirmation before entering long.
Targets:
First target at 1.1755 (prior weekly resistance)
Second target at 1.1816 (Fib extension)
Final target near 1.1887 (major resistance / upper channel boundary)
Risk Management:
A break and close below 1.1533 would invalidate the bullish setup and signal potential bearish pressure returning to the pair.

EURUSD M30 I Bearish Drop Based on the M30 chart analysis, we can see that the price is testing our sell entry at 1.1736, which is an overlap resistance.
Our take profit will be at 1.1712 a pullback support level.
The stop loss will be placed at 1.1768, which is above a swing high resistance level.
High Risk Investment Warning
Trading Forex/CFDs on margin carries a high level of risk and may not be suitable for all investors. Leverage can work against you.
Stratos Markets Limited (tradu.com ):
CFDs are complex instruments and come with a high risk of losing money rapidly due to leverage. 66% of retail investor accounts lose money when trading CFDs with this provider. You should consider whether you understand how CFDs work and whether you can afford to take the high risk of losing your money.
Stratos Europe Ltd (tradu.com ):
CFDs are complex instruments and come with a high risk of losing money rapidly due to leverage. 66% of retail investor accounts lose money when trading CFDs with this provider. You should consider whether you understand how CFDs work and whether you can afford to take the high risk of losing your money.
Stratos Global LLC (tradu.com ):
Losses can exceed deposits.
Please be advised that the information presented on TradingView is provided to Tradu (‘Company’, ‘we’) by a third-party provider (‘TFA Global Pte Ltd’). Please be reminded that you are solely responsible for the trading decisions on your account. There is a very high degree of risk involved in trading. Any information and/or content is intended entirely for research, educational and informational purposes only and does not constitute investment or consultation advice or investment strategy. The information is not tailored to the investment needs of any specific person and therefore does not involve a consideration of any of the investment objectives, financial situation or needs of any viewer that may receive it. Kindly also note that past performance is not a reliable indicator of future results. Actual results may differ materially from those anticipated in forward-looking or past performance statements. We assume no liability as to the accuracy or completeness of any of the information and/or content provided herein and the Company cannot be held responsible for any omission, mistake nor for any loss or damage including without limitation to any loss of profit which may arise from reliance on any information supplied by TFA Global Pte Ltd.
The speaker(s) is neither an employee, agent nor representative of Tradu and is therefore acting independently. The opinions given are their own, constitute general market commentary, and do not constitute the opinion or advice of Tradu or any form of personal or investment advice. Tradu neither endorses nor guarantees offerings of third-party speakers, nor is Tradu responsible for the content, veracity or opinions of third-party speakers, presenters or participants.


EUR-USDKeep an eye on it for buying, be careful if it is on the support level of demand, it has a long
