EUR/USD 1H Analysis – Bullish Reversal Setup
After a strong bearish push from the 1.16000 supply zone, price tapped into a high-probability demand zone (highlighted in grey) near the 1.15000 psychological level. The price action shows multiple bullish rejections from this zone, suggesting the presence of institutional buying interest.
Key observations:
Bullish Order Block: Price respected a bullish order block within the demand zone.
Liquidity Sweep: Sell-side liquidity was taken just below the recent lows, indicating a potential manipulation before a move higher.
Market Structure: Although the immediate structure is bearish, the reaction from demand shows early signs of a possible bullish reversal.
Entry Concept: A long setup is anticipated from the current zone with potential continuation toward the previous high at 1.16000 (marked target).
Risk Management: Stops can be placed just below the demand zone, targeting the imbalance and previous supply zone above.
The dotted red arrow reflects the projected bullish move based on the smart money concept—buying from demand after liquidity sweep and targeting inefficiencies.
This setup aligns with a smart money concept (SMC) approach: demand zone respect, liquidity grab, and a potential BOS (break of structure) forming.
Would you like me to generate hashtags and a short caption for posting as well?
📈 EUR/USD 1H – Smart Money Precision Entry
Liquidity swept ✅
Tapped into demand ✅
Institutional footprints spotted ✅
Now waiting for that bullish reversal to send us flying to 1.16000 🚀
#SmartMoneyConcepts #SMC #EURUSD #ForexTrading #OrderBlock #LiquidityGrab #PriceAction #FXTradingClub #MarketStructure #ReversalSetup #ForexSniper #TradingView #ForexAnalysis
EURUSD_W trade ideas

EURUSD - Current long positionVideo analysis of EURUSD
Hopefully we will get some bullish momentum however its not looking great

EU Daily Chart AnalysisEU Daily Chart Analysis
In D1 Chart, clearly the break out candle is huge and waiting to retest the area to Buy opportunity again

EURUSD, GBPUSD & EURGBP analysisHere's my outlook on the 3 pairs mentioned in the title. Looking for more upside momentum after we have some sort of pullback into the premium discount prices.
Once we get some15min bearish internal orderflow on the lower Time Frames I will look to enter short term sell positions before looking to take longer term buys on the way back up.
Again, if I can be of any assistance please do let me know and I will be happy to help where I can.

Important EURUSD UpdateYesterday, EURUSD continued to move sideways, with the market waiting for key news.
Today at 1:30 p.m. (London time), U.S. inflation data will be released.
This report has a strong impact and is likely to determine the next major move.
It is advisable not to open any new positions before the news is published.

EURUSD ALL THE WAY UPUS DOLLAR fundamentally is weak. If anything changes, fundamentally from big to low time frames CMCMARKETS:EURUSD has been bullish for the past months. Price currently sitting in a strong H4 DEMAND ZONE and can aim to the PWL previous weekly high/previous weekly high in the upcoming sessions

EURUSD_1DEurodollar Analysis
Daily Time Frame Medium and Long Term
Elliott Wave Analysis Style
The market is in 5 waves of ascent, which is expected to be in wave 5, which can move towards the target of 1.1717 by maintaining the price above 1.1280 and after completing 5 Elliott waves, enter a decline towards 1.0660
Important short-term number and for this week 1.1414

eur/usd TRADE 5 just a quick one to have a look at the market on where eur/usd will go i belive is going short to a level of support, to then reach a new high we see where it goes

EUR/USD - continue with the UptrendOn EUR/USD , it's nice to see a strong buying reaction at the price of 1.14390.
There's a significant accumulation of contracts in this area, indicating strong buyer interest. I believe that buyers who entered at this level will defend their long positions. If the price returns to this area, strong buyers will likely push the market up again.
Uptrend and high volume cluster are the main reasons for my decision to go long on this trade.
Happy trading
Dale

10 ARX Lessons for Precision in Trading📘 10 ARX Lessons for Precision in Trading
A reminder that trading isn’t about prediction it’s about execution.
Structure, timing, and mindset create consistency.
Which one of these lessons do you need to hear today?

The best indicator //@version=5
strategy("EMA-RSI-Bollinger Strategy", overlay=true, default_qty_type=strategy.percent_of_equity, default_qty_value=10)
// === Indicatori ===
ema20 = ta.ema(close, 20)
ema50 = ta.ema(close, 50)
rsi = ta.rsi(close, 14)
basis = ta.sma(close, 20)
dev = 2 * ta.stdev(close, 20)
upperBB = basis + dev
lowerBB = basis - dev
// === Condiții pentru Buy ===
longTrend = ema20 > ema50
longPullback = close <= ema20 and close <= lowerBB
longRSI = rsi < 50 and rsi > 30
longSignal = longTrend and longPullback and longRSI
// === Condiții pentru Sell ===
shortTrend = ema20 < ema50
shortPullback = close >= ema20 and close >= upperBB
shortRSI = rsi > 50 and rsi < 70
shortSignal = shortTrend and shortPullback and shortRSI
// === Semnale & Tranzacții ===
if (longSignal)
strategy.entry("Buy", strategy.long)
if (shortSignal)
strategy.entry("Sell", strat

EURUSD TRADE SETUPWait for retest the entry level and bullish momentum candle then take a trade for Buy otherwise skip this setup

EURUSD Buy indicationThe setup for Euro usd looks quiet strong where the fundamentals and technicals also give it a chance to follow the upside wave.

EUR/USD Daily Chart Analysis For Week of June 13, 2025Technical Analysis and Outlook:
During the current trading session, the Eurodollar has exhibited notable volatility, mirroring patterns observed in the preceding week. The currency has surpassed both the Mean Resistance level of 1.145 and the Key Resistance level of 1.151, subsequently retesting the significant completed Outer Currency Rally level at 1.157.
Recent analyses indicate that the Euro is likely to revisit both the Key Resistance and the completed Outer Currency Rally and expand further to the next Outer Currency Rally of 1.177 in the forthcoming trading session(s). However, there exists a potential for a continuation of the downward trend from the current level, which could lead to the price action targeting the Mean Support level at 1.149 and possibly a further extension to the Mean Support level at 1.140.

EURUSD topped? This Elliott wave count says YES!In our previous analysis, we were EURUSD bearish, and although we are trading about 2 cents higher now than when that analysis was published, we are still convinced that these high hills are shortable.
The pair, in our opinion, has finished a complete 5-wave Elliott formation earlier this week, and we prefer the short, with 2 targets that seem particularly interesting:
1. The flat correction target around 1.1065
2. The bottom of wave 4 of a lesser degree, at 1.0733, which is equal to, exactly & down to the pip, to the 61.8% retracement for the whole 5-wave sequence!
We will continue to be bearish for as long as 1.1704 is not clearly penetrated.
Whether the price penetrates 1.1704 & we give up, or, the market moves into our profit zone, we will post updates every week or so. Stay tuned!

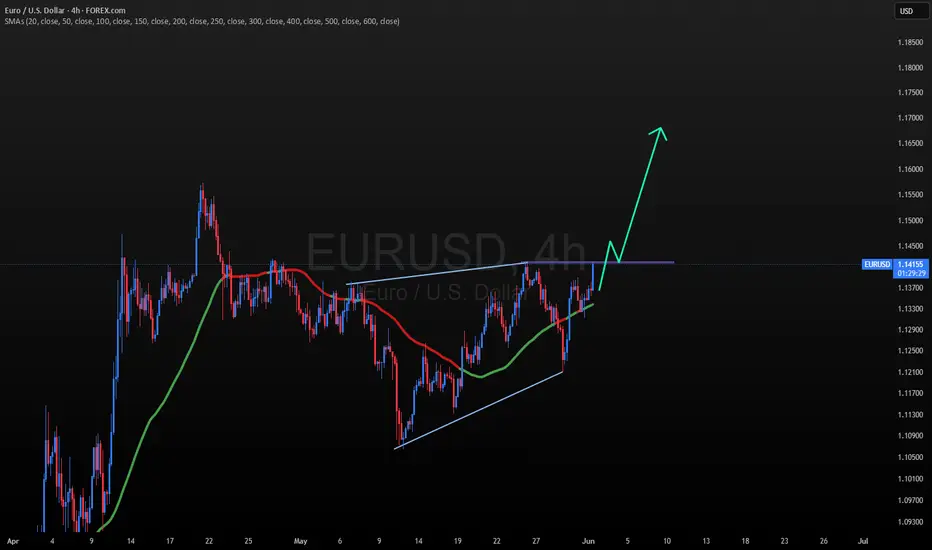
EURUSAD 4hr Chart Analaysis If EUR/USD breaks above the 1.14218 level, the next bullish target would be 1.16710.
This level marks a potential continuation of the uptrend, suggesting strong bullish momentum. A clean breakout above 1.14218 would likely confirm buyer dominance, possibly driven by improving eurozone fundamentals or broad USD weakness. The 1.16710 zone could act as a medium-term resistance level, aligning with historical price action and potential Fibonacci extensions.
Traders should monitor price behavior closely near 1.14218 for confirmation of a breakout, such as high volume and sustained closes above the level.
EUR/USD AccumulationOn the 5-minute timeframe, buying activity initiates, signaling the potential end of the downtrend. The first indication of upward momentum appears following the formation of a range and a subsequent liquidity sweep. Price then retests the prior low with diminished volume but fails to break below it, suggesting that selling pressure is being absorbed by buyers. This behavior reflects accumulation by informed participants positioning for a move higher. As demand begins to outweigh supply, clear signs of strength emerge
Entry: 1.15765
Take Profit: 1.16279
Stop Loss: 1.15621

EURUSD expectation 1HWe should be in for new heights after price comes down its previous support (because we are in a retracement) then it will travel back to the top. Buyers will be happy to note this. #BuyTheBull


Nice textbook Gartley Pattern setupThis is a very nice looking Gartley pattern setup for a continuation to the downside in the Euro...
we must hit at least a 11740-50 area to count complete

EURUSD SHORTDollar strength this week and month looks promising we have had some good meetings with China this week and there’s a lot of optimism around the dollar . However there’s a many stop losses above as we have many sell positions so i belive we will see a rally up and a big rejection and this trade could happen quickly .
We already had a successful setup with this thought process yesterday and i caught a long and a short however the real moves should kick in today .

$EU (EURUSD) 1H AnalysisBias: Bearish after liquidity grab at 1.14392
Setup: Wait for the sweep ➤ BOS ➤ Enter short
Target: 1.13600
Price is forming a range-bound consolidation, but the internal structure shows liquidity building below and above.
The market seems poised to run the 1.14392 high, grabbing buy stops above the short-term high.
After that sweep,i see a rejection and shift in order flow, setting up a bearish leg.
Key POIs :
Sweep Zone: 1.14392 (Buy-side liquidity)
Sell Target: 1.13600 zone – a clear sell-side liquidity draw
The red line marks an untapped liquidity pool, aligning with a previous support level.
Trade Idea (Short Bias) :
Let price sweep the 1.14392 high, form a bearish shift (change of character).
Ideal entry after confirmation of rejection.
Target: 1.13600
Invalidation: Clean break and close above 1.14500

