$EU (EURUSD) 1H AnalysisBias: Bearish after liquidity grab at 1.14392
Setup: Wait for the sweep ➤ BOS ➤ Enter short
Target: 1.13600
Price is forming a range-bound consolidation, but the internal structure shows liquidity building below and above.
The market seems poised to run the 1.14392 high, grabbing buy stops above the short-term high.
After that sweep,i see a rejection and shift in order flow, setting up a bearish leg.
Key POIs :
Sweep Zone: 1.14392 (Buy-side liquidity)
Sell Target: 1.13600 zone – a clear sell-side liquidity draw
The red line marks an untapped liquidity pool, aligning with a previous support level.
Trade Idea (Short Bias) :
Let price sweep the 1.14392 high, form a bearish shift (change of character).
Ideal entry after confirmation of rejection.
Target: 1.13600
Invalidation: Clean break and close above 1.14500
EURUSD_W trade ideas


eur/usd TRADE 5 just a quick one to have a look at the market on where eur/usd will go i belive is going short to a level of support, to then reach a new high we see where it goes

ECB’s De Guindos Sees Balanced Inflation RisksEuropean Central Bank Vice President Luis de Guindos said Monday that the EUR/USD at 1.15 does not hinder the ECB’s inflation goal, noting the euro’s gradual rise and stable volatility.
He stated inflation risks are balanced, with little chance of falling short of the target, and that markets have clearly understood the ECB’s recent policy signals. De Guindos reaffirmed the ECB is close to its inflation objective
Looking ahead, he warned that tariffs could slow growth and inflation in the medium term but expressed confidence in the Fed maintaining swap line arrangements. He also confirmed there have been no discussions about repatriating gold reserves from New York.
At the time, EUR/USD was down 0.09%, trading near 1.1537.
Resistance is located at 1.1580, while support is seen at 1.1460.

EURUSD June 16 Trade ExecutedEURUSD
June 16 Trade Executed
Parent Bias Bull
Fridays delivery to build a narrative for Monday
*Asia to London price expanded to seek lowwr prices take sell side liquidity in London
*Note Friday was a reversal of Thursday
*Prices expansion wicks to equilibrium
*Reversed to take minor buy side in NY AM
*NY PM Retraced AM rally
*NY closes in a FVG-Note bodies staying above the CE of the FVG
June 16 Framework for suspected buy day
*Asia opened in a premium previous session
*I was expecting a long consolidation after Sundays delivery
*
*Equal lows as a target to trigger a expansion coming into mid night opening
*22:00 price wicks to create a wall of equal lows
*23:15 Price takes minor buy side liquidity
*20:00 price immediately expanded
*20:09 entered
*First target buy stops 1.15693
*Second target 1.15848
Took partials here and now letting it ride.
Patience waiting for clues to the bias I was suspecting. Buying the mid night opening price with the bias is allowing me to get in when I suspect a expansion cycle is in play.
Asia expansion trade for the win.

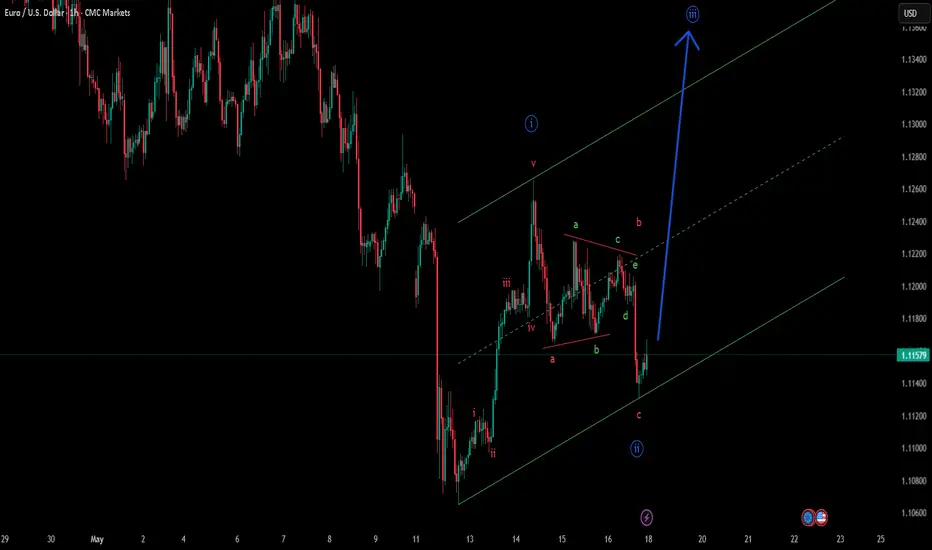
EURUSD in bullish trendprice action seems quite bullish on bigger TFs which gives opportunity to earn decent RR, with latest bullish divergence it seems that trend will likely mark new HH as on 30 min TF trend is following bullish Dow theory. There can be 2 bullish setups which i have also opened on the chart.
Beware of Mon gaps!!!

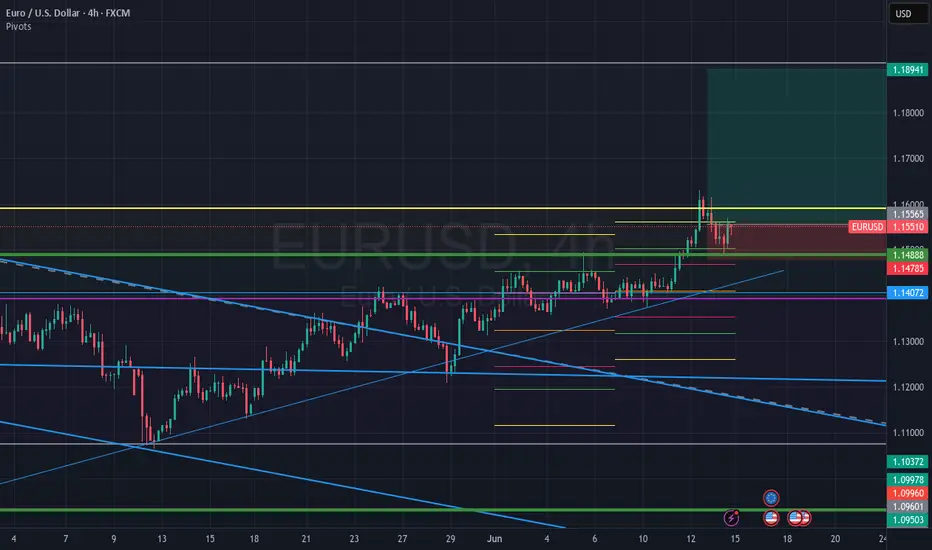
EURUSD ANALYSIS - LONGPrice has successfully broken out of the falling wedge on both the daily and weekly charts, signaling strong bullish momentum. After hitting resistance around 1.1555 (61.8% Fib), we’re seeing a healthy pullback towards 1.1500-1.1488 support. As long as bulls defend 1.1400, I’m looking for continuation towards 1.1555 and 1.1894 swing targets. Watching price action closely at the current pullback zone for potential long entries.
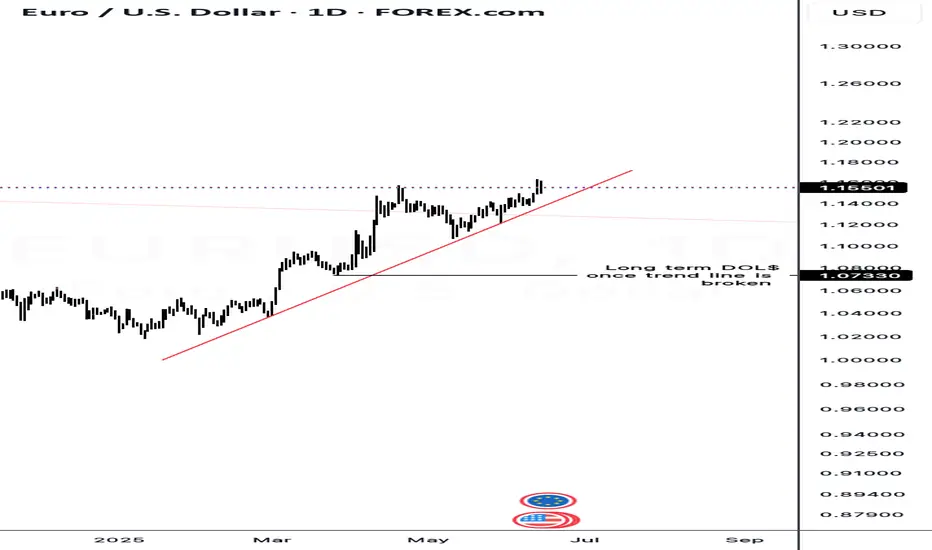
Waiting liquidity once trend line is broken.Once the daily trend line is broken, price will move to take out the long term sell side liquidity waiting below to continue the uptrend.
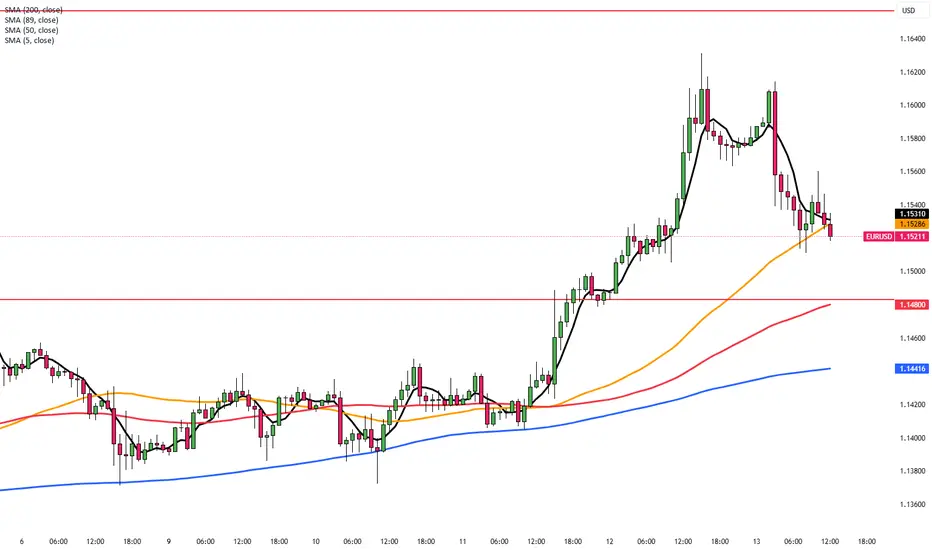
EURUSD ANALYSISOn Eurusd, we're in on a bullish market. we're looking at for a pullback to fibonacci levels, from anywhere between 71% to 100% for a continuation to the upside

EUR/USD Slips on Geopolitical TensionsEUR/USD dropped to around 1.1530 on Friday, ending a four-day rally, as safe-haven demand lifted the US Dollar amid rising Middle East tensions.
Israel struck Iranian targets to weaken its nuclear program, prompting emergency measures. The US denied involvement but warned Iran not to target its assets.
Trump’s plan to expand steel tariffs from June 23 added trade uncertainty, while soft US inflation data kept Fed rate cut hopes alive.
Markets now await the US Michigan Sentiment report for further signals.
Resistance is located at 1.1580, while support is seen at 1.1460.
#AN007: Israel Attacks Iran, What's Happening? in Forex
Hello, I'm Forex Trader Andrea Russo, creator of the SwipeUP Elite FX Method, which allows me to analyze and operate in the Forex world as if I were a Hedge Fund or an Investment Bank. Today I want to talk to you about the relevant news of the last few hours, namely Israel's attack on Iran.
⚠️ What happened
Israel launched a massive preemptive air strike on numerous nuclear and military installations in Iran, including sites in Tehran and Natanz. Among the victims were key figures such as Revolutionary Guard commander Hossein Salami and several high-profile nuclear scientists.
The operation was completely "unilateral", with no direct involvement of the United States, according to official sources
reuters.com. However, it was previously coordinated with Washington, which received notification before the attack.
Iran has responded by announcing that it will respond “hard and decisively” and has begun planning missile and drone strikes against Israeli targets, with a response that could come as early as the next few days.
🌍 Global reactions
Australia, New Zealand, Japan and the UN have expressed alarm and called for maximum restraint.
Oil prices have reacted with a surge: WTI +9% due to fears of supply disruptions.
💱 Impact on Forex
↑ Oil prices → Strengthens CAD, NOK, and commodity currencies in general.
Global risk-off mode → Benefits safe haven currencies such as JPY, CHF, and temporarily also USD.
Rising geopolitical risk → USD may have swings: drops in risk-off phases, but bounces as a safe-haven.
EUR under pressure due to general risk aversion and physical demand for USD, CHF, JPY.
Finally, emerging markets (BRL, MXN, INR) could suffer high volatility: outflows towards safer assets.
🧩 Operational focus for Forex traders
Monitor oil and US yield bonds: rising signals could push commodity currencies.
Follow movements on USD/JPY and USD/CHF: potential breakouts in case of escalation.
Watch out for volatility on EUR/USD: the geopolitical crisis rewards USD and CHF.
Stay ready for emerging currencies to react: possible flash crashes or speculative rebounds.
To receive other news or other analyses, continue to follow me.

EUR/USD tests three-year ceiling Aside from a brief spike in April, EUR/USD has remained below 1.1500 for over three years.
Sellers again have had to defend the zone following the weaker-than-expected US CPI release. The main resistance zone potentially spans all the way up to 1.1573 (the April high).
Some indicators suggest potential room for further upside. The Relative Strength Index (RSI) has not yet reached overbought territory, and the Daily Moving Average is positively sloped. A break below the 4-hour Moving Average could trigger more selling pressure and a potential correction.

Long position on the EURUSDRecent news state that "Moody’s strips US of top-notch triple-A credit rating". What does this mean for the dollar?
Could this zig-zag on the EURUSD egde the bears to push the price to 1.2?
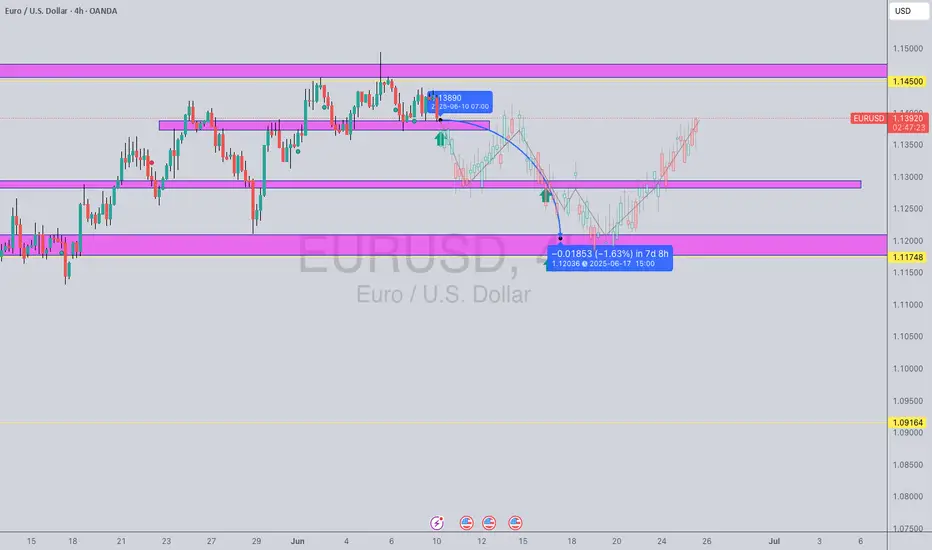
Based on the provided EURUSD 4-hour chart, here's a simple tradeCurrent Situation:
The price is currently at 1.13869, trading within a resistance zone (indicated by the pink shaded area around 1.13700 - 1.14000).
Previously, the price reacted strongly to this area, leading to a significant drop.
There's a clear upward trend leading into this resistance zone.
Potential Trade Scenarios:
1. Short Entry (Bearish Reversal):
Rationale : The price is at a significant resistance level that has caused a strong bearish reaction in the past. If this resistance holds, we could see a repeat of the previous downtrend.
Entry Signal: Look for clear bearish candlestick patterns (e.g., engulfing pattern, pin bar, or rejection candle) forming within or just below the resistance zone (around 1.13700 - 1.14000) . A break and retest of the lower boundary of this resistance could also be an entry.
Target: The next major support zone appears to be around 1.11748 - 1.12000.
Stop Loss: Place the stop loss just above the current resistance zone, perhaps around 1.14200 - 1.14500 , to account for potential false breakouts.
2. Long Entry (Bullish Breakout Continuation):
Rationale: If the current bullish momentum is strong enough to break through this resistance, it could signal a continuation of the upward trend.
Entry Signal: Wait for a confirmed breakout above the resistance zone (e.g., a 4-hour candle closing clearly above 1.14000 - 1.14200). A retest of the broken resistance as new support would offer a higher-probability entry.
Target: The next major resistance level is not immediately visible on this chart, but you would look for the next supply zone or previous swing highs.
Stop Loss: Place the stop loss below the broken resistance, which would now act as support, perhaps around 1.13500.
Key Considerations Before Entry:
Confirmation: Do not enter solely based on the price reaching the zone. Always wait for a clear candlestick confirmation or a break and retest.
Volume (if available): Higher volume on a breakout or rejection can add conviction to the move.
News Events: Be aware of any upcoming high-impact news events that could affect EURUSD.
Risk Management: Always define your stop loss and position size before entering any trade.
EURUSD: Local Bullish Bias! Long!
My dear friends,
Today we will analyse EURUSD together☺️
The recent price action suggests a shift in mid-term momentum. A break above the current local range around 1.14158 will confirm the new direction upwards with the target being the next key level of 1.14327 and a reconvened placement of a stop-loss beyond the range.
❤️Sending you lots of Love and Hugs❤️

CHECK EURUSD SIGNALS READ CAPTAIN EURUSD Buy Limit Zone
TRADE
entry point 1.13722
Take profit Target 1.14783
Stop loss 1.13425
Follow money Menagment

EUR/USD | Distribution in Play – Short Bias Active After completing a textbook Wave 5, price entered a premium supply zone and executed a clean liquidity sweep.
🔹 Confirmed Change of Character (ChoCh) signals the shift from bullish to bearish order flow.
🔹 Price is respecting the SMC structure:
📍 Liquidity grab
📍 Mitigation of bearish order block
📍 Distribution phase after impulsive rally
📉 Short-Term Bias: Bearish
🎯 Targeting the demand zone below near 1.1275–1.1292, where we may expect accumulation to begin again.
📌 Plan:
1. Short entries valid below 1.1439 supply.
2. Monitoring reaction at the blue zone for possible reversal next week.
⚙️ Strategy used:
SMC + Wyckoff Distribution + Elliott Wave (Top-down)

Week of 6/8/25: EU AnalysisPrice has reached the extreme of daily bearish structure and we can see a rejection of the 4h latest push to make another high. We're following 1h internal bearish structure to at least take out the weak low, thus making 1h structure bearish and following that to the 4h extreme swing low.
Major news:
Core CPI - Wednesday

Bearish drop?EUR/USD is rising towards the resistance level which is a pullback resistance that lines up with the 23.6% Fibonacci retracement and could drop from this level to our take profit.
Entry: 1.1406
Why we like it:
There is a pullback resistance level that lines up with the 23.6% Fibonacci retracement.
Stop loss: 1.1433
Why we like it:
There is a pullback resistance level that lines up with the 50% Fibonacci retracement.
Take profit: 1.1358
Why we like it:
There is a pullback support level that aligns with the 50% Fibonacci retracement.
Enjoying your TradingView experience? Review us!
Please be advised that the information presented on TradingView is provided to Vantage (‘Vantage Global Limited’, ‘we’) by a third-party provider (‘Everest Fortune Group’). Please be reminded that you are solely responsible for the trading decisions on your account. There is a very high degree of risk involved in trading. Any information and/or content is intended entirely for research, educational and informational purposes only and does not constitute investment or consultation advice or investment strategy. The information is not tailored to the investment needs of any specific person and therefore does not involve a consideration of any of the investment objectives, financial situation or needs of any viewer that may receive it. Kindly also note that past performance is not a reliable indicator of future results. Actual results may differ materially from those anticipated in forward-looking or past performance statements. We assume no liability as to the accuracy or completeness of any of the information and/or content provided herein and the Company cannot be held responsible for any omission, mistake nor for any loss or damage including without limitation to any loss of profit which may arise from reliance on any information supplied by Everest Fortune Group.

EURUSD Trade Plan 08/06/2025📉 EUR/USD Technical Analysis – June 8, 2025
EUR/USD is showing signs of weakness after rejecting the resistance zone around 1.1475 (Fib 0.618 level). The pair broke below the ascending trendline, suggesting that bullish momentum is fading.
🔻 Scenario:
We may see a corrective pullback to retest the broken trendline (around 1.1450–1.1460). If this retest holds as resistance, the pair is likely to continue its decline.
🎯 Bearish Targets:
First target: 1.1303
Second target zone: 1.1253 – 1.1220
📌 Invalidation Level: A daily close above 1.1577 would invalidate this bearish scenario.
RSI is also turning lower from mid-levels, supporting a potential downside move.
⚠️ Trade with proper risk management and monitor price action around the key levels.
if you enjoyed this forecast, please show your support with a like and comment. Your feedback is what drives me to keep creating valuable content."
Regards,
Alireza

EURUSD: Support & Resistance Analysis For Next Week 🇪🇺🇺🇸
Here is my latest structure analysis
and important supports and resistances for EURUSD
for next week.
Consider these structures for pullback/breakout trading.
❤️Please, support my work with like, thank you!❤️
I am part of Trade Nation's Influencer program and receive a monthly fee for using their TradingView charts in my analysis.

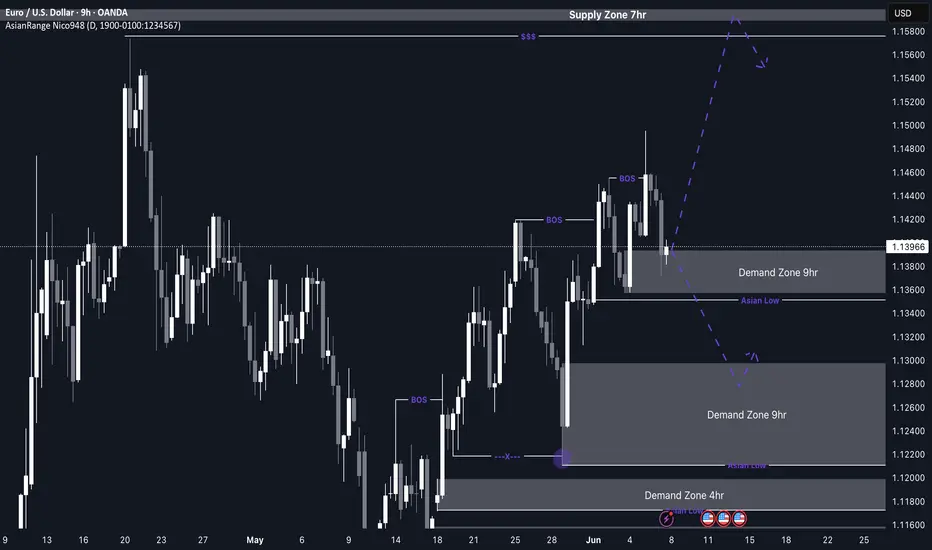
EUR/USD Potential buys from current zone or 1.12800My outlook for EU this week closely aligns with GU — both pairs are showing similar structure and direction. Price continues to form higher highs and higher lows, maintaining its bullish momentum.
Following the most recent break of structure to the upside, EU has now entered a 9H demand zone, where I’ll be watching for signs of accumulation and potential entry as the market opens on Monday.
If this current zone fails to hold, there’s a more discounted 9H demand zone just below, which could offer a cleaner long opportunity. Either way, both scenarios follow the pro trend, which adds conviction to the buy idea.
Confluences for EU Buys:
Price has broken structure to the upside and entered a clean 9H demand zone
There’s another refined 9H demand zone just below for additional confirmation
Plenty of upside liquidity remains untouched
Structure remains bullish on the higher timeframes, making this a pro trend setup
P.S. If price reacts well and continues pushing higher, I’ll be keeping an eye on the 7H supply zone above for any possible short-term bearish reaction.
Wishing everyone a successful and disciplined trading week ahead!
EURUSD: Technical Bearish Outlook EURUSD: Technical Bearish Outlook
EURUSD displays a Head & Shoulders pattern, which is typically a bearish reversal signal.
Lately the price created a deep correction by showig a potential WXZXY pattern, suggesting a potential corrective structure before further downside.
Bearish Targets:
1.1230 – First major support level
1.1100 – Possible second target
1.1000 – A deeper correction point
1.0900 – Strong structural support
Fundamental Impact:
The main focus should be on the Trump administration, which wants countries to offer their best offer for trade negotiations by Wednesday. This will create a real mess for better or worse and should bring high market volatility.
You may find more details in the chart!
Thank you and Good Luck!
❤️PS: Please support with a like or comment if you find this analysis useful for your trading day❤️
Disclosure: I am part of Trade Nation's Influencer program and receive a monthly fee for using their TradingView charts in my analysis.
