Trading Signals for EUR/USD buy above 1.1393 (200 EMA - 6/8 Early in the European session, the euro is trading around 1.1422, undergoing a technical correction after reaching the psychological level of 1.15.
The US Non-Farm Payrolls dat will be released in the American session, and strong volatility will hit the market. If the market reacts favorably to the US dollar, it could continue to pressure the EUR/USD pair.
On the other hand, if the data comes out negative for the US dollar, we could expect the to recover and could reach the 7/8 Murray level at 1.1596.
The indicator is showing a negative signal, so we believe that if the euro falls below the 6/8 Murray level in the coming hours, it will be seen as an opportunity to sell, with targets at the 200 EMA around 1.1290.
In the past, 1.1470 has acted as strong resistance, so we believe a technical correction could occur below this area this time. Therefor, we should be alert to see if the price consolidates below this level in order to sell.
EURUSD_W trade ideas

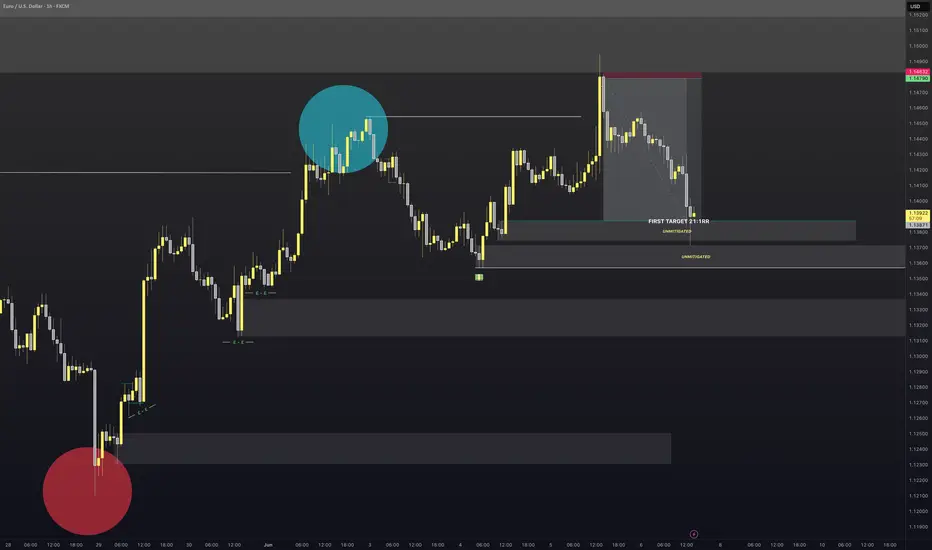
EURUSDVery important area now for EURUSD
Will the unmitigated OB's on the 1H stand strong or, will we continue lower. due to the HTF area of value.
Took a nice short on the 5min TF for a 1:21 RR.
Now lets see how this plays out should be really interesting
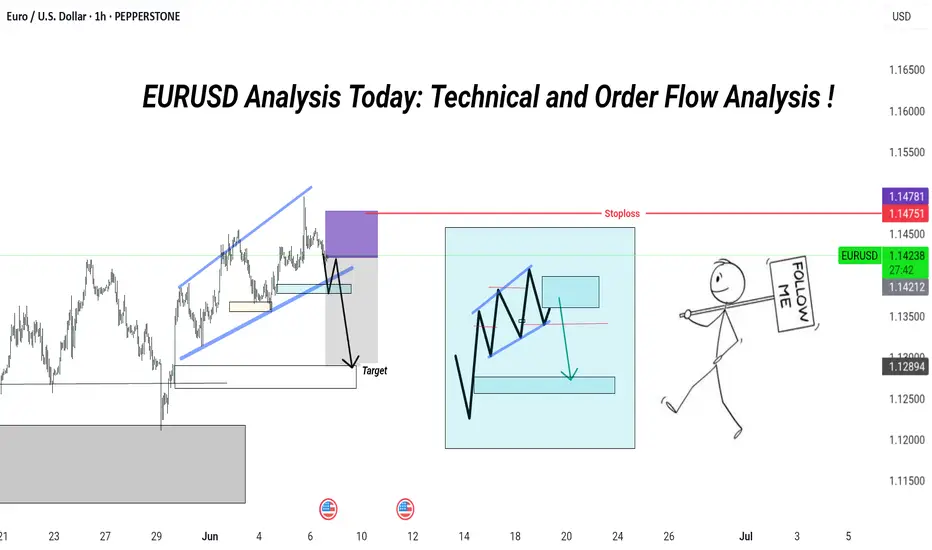
EURUSD Analysis Today: Technical and Order Flow Analysis !Technical Breakdown:
Rising Wedge Pattern ✅
Price was moving inside a rising channel (blue lines).
This is often a bearish reversal pattern.
Break of Structure 💥
Price broke the lower trendline + support zone — confirming potential downside momentum.
Short Entry Zone 🟪
Purple box marks a premium entry zone (Order Block / Supply Zone) — where sellers are likely positioned.
Stop Loss: 1.14781 🔺 (Above last high)
Target: Key demand zone below (highlighted in grey) 🎯
---
📦 Order Flow Perspective:
Internal structure shows lower highs and lower lows forming.
Expecting price to retest lower blue trendline, then drop to fill imbalance and hit demand zone below.
---
🗓️ Upcoming Events:
Watch out for USD-related news near June 10 & June 14 — it may increase volatility 📊
---
🧠 Summary:
This is a classic bearish continuation setup.
Entry after pullback = higher R:R potential.
Patience and proper risk management are key 🔑
---
Not Every Candle Needs a Reaction — I Know I’ve GrownThere was a time I thought I needed to react to every move.
A clean candle? I’d enter.
A minor imbalance? I’d take the risk.
A zone that “looked okay”? I’d justify it.
Why? Because I was chasing something.
Chasing certainty .
Chasing profit .
Chasing control .
But here’s the thing I didn’t understand back then:
Not every candle needs a reaction. And not every move is my move.
🧠 Overtrading Wasn’t a Strategy. It Was a Symptom.
It was a symptom of fear — fear of missing out (FOMO).
It was a symptom of insecurity — not trusting my own process.
It was a symptom of impatience — not letting the market come to me.
I confused activity with progress. I thought being busy on the charts meant I was becoming better. But most of the time, I was just bleeding my edge.
💡 The Turning Point
Growth didn’t happen because I learned a new indicator. It happened the moment I started asking myself:
Is this my setup? Or am I just bored, hopeful, or triggered?
When you define a clear trading plan, with criteria you believe in, the real test isn’t finding setups...it’s waiting for the right ones. Today, I can watch the market move beautifully without me and feel absolutely nothing.
That’s freedom.
That’s growth.
That’s power.
🧘🏽♂️ From Reactive to Intentional
Now, I focus on:
Waiting for my specific SMC criteria to line up
Sticking to my CRT model (PDL/PWH sweep → BOS → FVG)
Trusting that missing one trade means nothing if I stay consistent
Letting the market come to me
I’m no longer in the game to prove something. I’m here to play my edge , manage my risk , and protect my mind.
📌 Final Words
Growth in trading isn't loud. It doesn’t scream from a winning streak. It shows up quietly:
in the trades you didn’t take.
in the silence between setups.
in the patience to do nothing until it’s time.
So if you’re not constantly in a trade, that’s not weakness that’s wisdom.

EURO-USD BUY STRONG 1. "EUR/USD Strong Buy Alert 🚀 | Key support zone holding firm – bulls eyeing the next leg up!"
2. "Strong Buy Zone ✅ | EUR/USD showing bullish momentum from this support level – eyes on 1.09+"
3. "EUR/USD Reversal Zone 💥 | Buyers stepping in strong – potential rally ahead!"
4. "Watch this zone! EUR/USD strong buy setup forming – bullish confirmation underway 📈"
5. "EUR/USD bouncing from key demand zone 🔥 | Technicals align for a strong buy signal!"

Bearish drop?The Fiber (EUR/USD) has reacted off the pivot and could drop to the 1st support.
Pivot: 1.1471
1st Support: 1.1376
1st Resistance: 1.1573
Risk Warning:
Trading Forex and CFDs carries a high level of risk to your capital and you should only trade with money you can afford to lose. Trading Forex and CFDs may not be suitable for all investors, so please ensure that you fully understand the risks involved and seek independent advice if necessary.
Disclaimer:
The above opinions given constitute general market commentary, and do not constitute the opinion or advice of IC Markets or any form of personal or investment advice.
Any opinions, news, research, analyses, prices, other information, or links to third-party sites contained on this website are provided on an "as-is" basis, are intended only to be informative, is not an advice nor a recommendation, nor research, or a record of our trading prices, or an offer of, or solicitation for a transaction in any financial instrument and thus should not be treated as such. The information provided does not involve any specific investment objectives, financial situation and needs of any specific person who may receive it. Please be aware, that past performance is not a reliable indicator of future performance and/or results. Past Performance or Forward-looking scenarios based upon the reasonable beliefs of the third-party provider are not a guarantee of future performance. Actual results may differ materially from those anticipated in forward-looking or past performance statements. IC Markets makes no representation or warranty and assumes no liability as to the accuracy or completeness of the information provided, nor any loss arising from any investment based on a recommendation, forecast or any information supplied by any third-party.

Bearish drop for the Fiber?The price is reacting off the resistance level which is a pullback resistance and could drop from this level to our take profit.
Entry: 1.1452
Why we like it:
There is a pullback resistance level.
Stop loss: 1.1495
Why we like it:
There is a pullback resistance level.
Take profit: 1.1375
Why we like it:
There is an overlap support level that is slightly below the 38.2% Fibonacci retracement.
Enjoying your TradingView experience? Review us!
Please be advised that the information presented on TradingView is provided to Vantage (‘Vantage Global Limited’, ‘we’) by a third-party provider (‘Everest Fortune Group’). Please be reminded that you are solely responsible for the trading decisions on your account. There is a very high degree of risk involved in trading. Any information and/or content is intended entirely for research, educational and informational purposes only and does not constitute investment or consultation advice or investment strategy. The information is not tailored to the investment needs of any specific person and therefore does not involve a consideration of any of the investment objectives, financial situation or needs of any viewer that may receive it. Kindly also note that past performance is not a reliable indicator of future results. Actual results may differ materially from those anticipated in forward-looking or past performance statements. We assume no liability as to the accuracy or completeness of any of the information and/or content provided herein and the Company cannot be held responsible for any omission, mistake nor for any loss or damage including without limitation to any loss of profit which may arise from reliance on any information supplied by Everest Fortune Group.

EUR/USD TECHNICALS INTACT AS ECB AND U.S. DATA SET STAGE FOR VOLWith just minutes to go before the European Central Bank (ECB) announces its highly anticipated rate decision, market participants are maintaining a cautious stance. The EUR/USD pair remains relatively calm, reflecting a wait-and-see approach ahead of the official release.
According to broad market consensus, the ECB is expected to implement a 25-basis point rate cut. This move would bring the key deposit rate down to 2.00% and 2.15% main refinancing rate, in response to the eurozone's recent disinflation trend.
Following the rate announcement, ECB President Christine Lagarde is scheduled to hold a press conference, during which she is expected to provide detailed insights into the reasons behind the committee’s decision. Investors and analysts alike will closely scrutinize her statement for forward guidance particularly any indication of whether today’s cut is a one-off adjustment or part of a broader easing strategy going into the second half of 2025.
On the other hand, U.S job report would be on the wire tomorrow by 4:30PM GMT +4, this data point also has the tendency to cause market volatility and as such, traders are advised to pay close attention.
The pair has been trending upward on the 4-hour timeframe, forming a series of higher highs and higher lows while consistently respecting its ascending trendline and above EMA 50. Price is currently facing resistance around 1.1439, as traders await the next major catalyst, the ECB rate decision.
LEVELS TO WATCH OUT:
If the bullish momentum continues, a brake above 1.1439 would potentially target 1.1481 and 1.1547 according to analyst. On the flipside, if sellers’ step in and pushes prices down, a break below 1.1411, would potentially target towards 1.1367 which would have served as break of the trendline and then potentially tank to 1.1229 according to analyst. Breakout of these levels are not ruled out.

EURUSD: Twin Channel Up structure aims for 1.14950.EURUSD is bullish on its 1D technical outlook (RSI = 59.016, MACD = 0.005, ADX = 22.852) as it maintains a bullish structure consisting of successive Channel Up patterns. We are currently on the 2nd, with the price supported by both the 30m MA50 and MA200. The 1st Channel Up peaked after a +1.29% rise. We remain bullish, aiming for a similar rise, TP = 1.14950.
See how our prior idea has worked out:
## If you like our free content follow our profile to get more daily ideas. ##
## Comments and likes are greatly appreciated. ##

EURUSD 15 MIN Long📊 EUR/USD Smart Money Concept Trade Idea – 15-Minute Chart
This setup highlights a textbook example of how market structure, liquidity grabs, and Fibonacci confluence can provide high-probability trade setups.
🔍 Breakdown:
Support Respected (Left Side)
Price previously respected a key support zone, leading to a strong bullish impulse.
Previous Support → Resistance Flip
Once price revisited this zone (marked in red), it failed to hold, indicating a shift in sentiment. This became a liquidity zone where early buyers got trapped.
Liquidity Grab (Red Line)
Notice how price dipped below the previous swing low, triggering stop-losses from buyers. This is a liquidity grab, a classic smart money move to fuel large buy orders.
Structure Shift (Green Label)
After the liquidity grab, price formed a higher high, indicating a potential shift in market structure from bearish to bullish.
50% Fibonacci Level (Green Line)
The price then retraced perfectly to the 50% Fibonacci level of the bullish leg post-liquidity grab – a golden zone often used by institutions for entries.
Re-Entry After Pullback
The retracement to the 50 FIB level after the structure shift provided a low-risk, high-reward long opportunity, targeting the previous liquidity zone (blue line) as take-profit.
Target & Stop Placement
Entry: Around the 50 FIB level
Stop: Below the liquidity grab low
Take Profit: Near the previous liquidity zone (marked in blue), where many sell-side stops likely sit

EURUSD showing signs of a false breakoutEUR/USD Analysis: Potential Downside Correction After False Breakout
EUR/USD currently showing signs of a false breakout from a strong resistance level. Although the broader market condition remains bullish, the recent price action suggests that the breakout may not sustain. This could trigger a downside correction.
The U.S. Dollar (USD) is approaching a key support level, which might provide some strength to the dollar and put downward pressure on EUR/USD.
Resistance zone 1.14000
Support Level 1.13500 / 1.13000
you may find more detail in the chart Ps Support with like and comments for more analysis.

Stronger U.S. JOLTS Data Pressures EURUSD!!!EURUSD ( FX:EURUSD ) failed to break the Resistance zone($1.1487-$1.1424) and started to fall again , breaking the Support lines .
In terms of Elliott Wave theory , it seems that EURUSD has managed to complete the main wave X of the Double Three Correction(WXY) structure .
Just moments ago, the U.S. JOLTS Job Openings data was released.
-------------------------------
Actual: 7.39M
Forecast: 7.11M
Previous: 7.19M
The stronger-than-expected JOLTS figure at 7.39 million signals a resilient labor market. This reduces recession fears and increases the likelihood that the Federal Reserve may keep interest rates elevated for longer.
Bullish for the U.S. Dollar( TVC:DXY )
Bearish pressure could hit EURUSD, especially if it's approaching the key resistance zone.
-------------------------------
I expect EURUSD to start to fall again after the pullback to the Support lines and to fall to the targets I have specified on the chart.
Note: If EURUSD touches $1.14580(Stop Loss(SL)), we can expect a failure of the Resistance zone($1.1487-$1.1424).
Please respect each other's ideas and express them politely if you agree or disagree.
Euro/U.S. Dollar Analyze (EURUSD), 1-hour time frame.
Be sure to follow the updated ideas.
Do not forget to put a Stop loss for your positions (For every position you want to open).
Please follow your strategy and updates; this is just my Idea, and I will gladly see your ideas in this post.
Please do not forget the ✅' like '✅ button 🙏😊 & Share it with your friends; thanks, and Trade safe.

Eurusd Buyprice is bullish on the Daily and 4hr tf. on the 1hr it is exiting the Daily demand zone and recently bounced off the 1hr trendline. price is currently around 4hr poi which may help give us fuel to move to the 1hr poi and above targeting next Daily key level.

EURUSD BEAR - H1I have given out everything you see here for free.... Plus everything can be verified easily (TradingView Profile / Bio is all I am allowed to say).
I do have a higher bear if you saw the rules... keep an eye on the solid swing (levels)
Plus I do have a breakout BULL waiting if the bear structure fails.
I have made this very simple. I trade the wicks every time. That's why I can roll stops to entry after TP 1 (Fixed at 1:1 +35P)
All my levels have a tolerance of 15 PIPS... just like the banks. BUT I will not be adding more day trade levels (white bordered)
(Intraday levels are dashed)

Trade Recap CW23Quick and easy breakdown of my EUR/USD position from last week where I miss-managed the entry.

EUR/USD - Sweeping the highs, retracement following?The EUR/USD has experienced a steep and aggressive bullish run today, showing strong upward momentum across multiple timeframes. This impulsive move has led to a sweep of the recent highs, taking out key liquidity levels that were resting above previous swing points. In the context of smart money concepts and institutional trading models, such a move typically signifies the activation of buy-side liquidity, where stop-loss orders and breakout entries are triggered above a well-defined high. This behavior is often engineered by larger market participants to fulfill liquidity objectives before potentially reversing or retracing.
During this strong bullish leg, the EUR/USD left behind a noticeable imbalance, commonly referred to as a Fair Value Gap (FVG), on the lower timeframes. This imbalance reflects an area where price moved too rapidly, leaving behind unfilled orders and creating a price inefficiency. Specifically, an FVG remains open around the 1.13700 level, a zone that was bypassed during the impulsive rally and now stands as a likely magnet for price in the near term. These imbalances are significant because price tends to revisit them to seek equilibrium and fill in the inefficient areas, especially after a major liquidity grab.
The sweep of the highs was a classic liquidity-taking event. When price runs above a prominent high, especially one that's visible on higher timeframes like the 4H or daily, it often signals that buy stops (retail breakout entries or protective stops) have been targeted. Once these stops are taken, there is typically a shift in market behavior. The aggressive buyers have been filled, and institutional players may look to reverse or retrace price toward areas of unfilled orders, such as the aforementioned FVG. The market often transitions from a state of expansion (impulse move) to a state of rebalancing or consolidation, which opens the door for a pullback.
Given that the liquidity above the highs has been taken and that the 1.13700 gap remains unmitigated, it becomes increasingly likely that EUR/USD will begin a retracement. This corrective move would serve to rebalance the price, revisit the inefficiency, and potentially test the validity of any newly-formed demand zones. From a technical standpoint, this area is crucial, not only because of the gap itself but also due to its positioning in relation to prior market structure.
In summary, today’s bullish extension in EUR/USD accomplished a major liquidity objective by sweeping the highs. However, the move left behind a significant imbalance at 1.13700, suggesting that the pair could be due for a corrective pullback to fill the gap. Traders should monitor lower timeframes for signs of distribution, potential shifts in market structure, or bearish order blocks forming after the sweep. All of these could provide clues that the market is preparing to return to the gap and restore price efficiency.
Thanks for your support.
- Make sure to follow me so you don't miss out on the next analysis!
- Drop a like and leave a comment!

Trading Signals for EUR/USD sell below 1.1432 (21 SMA-6/8 MurrayEUR/USD is trading around 1.1410, below the Murray 6/8 level and within the uptrend channel formed on May 9.
The instrument has an area where buyers have found it easier to take profits around 1.1476. This level could be a barrier for the euro, and from there we could expect a technical correction.
If the bullish force prevails, the euro could reach the top of the uptrend channel around 1.1474 and even the psychological level of 1.1500.
Technically, we observe that the euro is overbought and there could be a technical correction in the coming days, as crucial data from the United States will be released later this week, which could generate strong volatility in the market.
The indicator is showing a negative signal, so if an additional upward movement occurs above the current price, we could consider selling as long as the instrument consolidates below 1.1500.

My Thoughts #014The pair seems to have still maintained its bullish trend.
Since the market is making a new higher high.
As you can see the fractal low is still holding so anything can happen
I see that pair has a potential to buy and move higher since it's been In a strong trend to the upside.
The pair could just change and sell at any point
So let's use proper risk management
And let's do the most

EUR USD Daily TF Bearish MovementBased on Weekly Time Frame it's time to EURUSD for bearish movement after weekly candlestick reject on Weekly OB after making Buy side Liquidity.

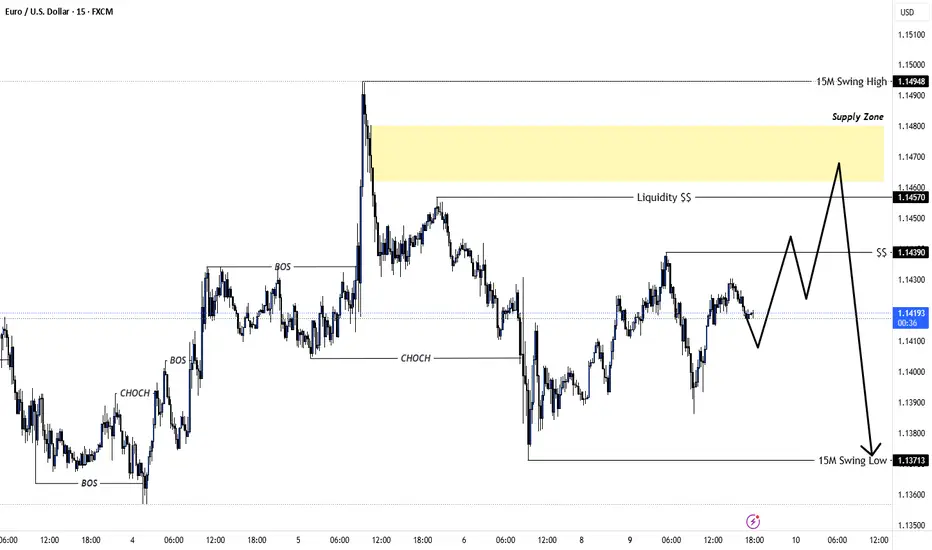
EUR/USD | 15M TF Analysis Here is what I will be looking for on the 15M timeframe. We broke structure to the downside. I will want to see price come up and take out the built up liquidity, tap into the supply zone I marked out, drop down to the lower time frame and see if it offers an entry to sell back down to the swing low.
If you like this analysis, please hit that like and follow button! Trade Safe! -Remzy
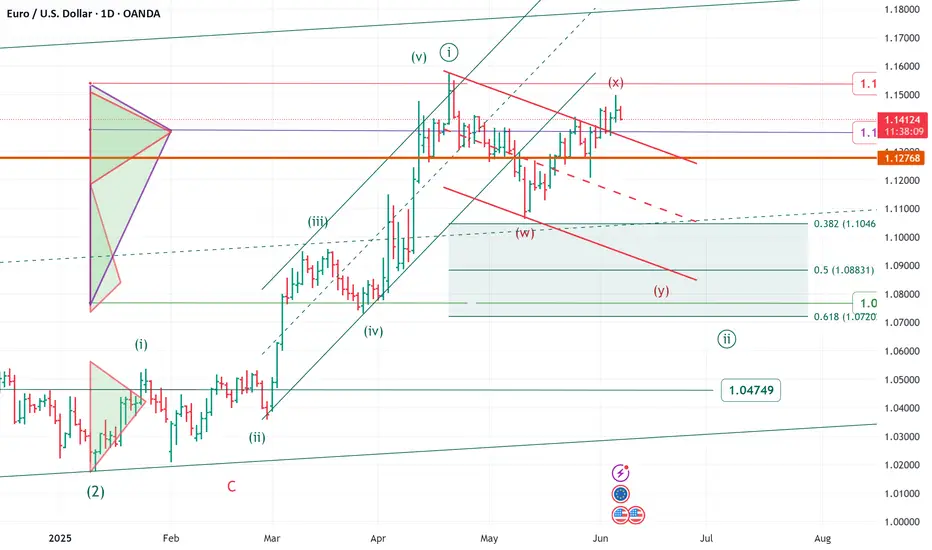
Elliott wave daily EURUSD update
Elliott wave daily EURUSD update
The price movement of the last few weeks requires a change
and update of the wave count
______________________________________
upward movement from area 1.018/genuary 2025 to area 1.1580/april 2025
looks impulsive - minute wave ((i)).
we are now in a corrective minute wave ((ii))
zigzag or flat or any double
target area 1.1040/1.0800 area
in the very short term level to monitor 1.1500 area
over 1.1500 area a flat correction more likely ( to area 1.1570)
note
FX option expiries for 6 June 10am New York cut
1.1500 (EUR 3.19bn)
1.1400 (EUR 2.38bn)
1.1300 (EUR 1.28bn)
FOREXLIVE
possibility of uptrendIt is expected that the upward trend will continue to the specified resistance levels.
If the price can break through the support range, the continuation of the downward trend will be likely.

EURUSD: Short Trade Explained
EURUSD
- Classic bearish pattern
- Our team expects retracement
SUGGESTED TRADE:
Swing Trade
Sell EURUSD
Entry - 1.1398
Stop - 1.1449
Take - 1.1303
Our Risk - 1%
Start protection of your profits from lower levels
Disclosure: I am part of Trade Nation's Influencer program and receive a monthly fee for using their TradingView charts in my analysis.
❤️ Please, support our work with like & comment! ❤️
