SNATCH & RUN: EUR/USD Long Setup (High-Risk Loot Zone)🔥 EUR/USD Heist: Bullish Loot Before the Trap! (Thief Trading Strategy) 🔥
🌟 Hi! Hola! Ola! Bonjour! Hallo! Marhaba! 🌟
Attention, Money Makers & Market Robbers! 🤑💰💸✈️
Based on the 🔥Thief Trading Style🔥, here’s our master plan to loot the EUR/USD "The Fiber" Forex Market! Follow the strategy on the chart—Long Entry is key. We’re targeting the high-risk Red Zone: overbought, consolidating, and primed for a reversal. Beware the trap—bulls must strike fast before bears ambush! 🏆💸
"Take the profit and treat yourself, trader. You deserve this heist!" 💪🎉
🚪 Entry Point (The Vault is Open!)
📈 "Swipe the bullish loot at any price—the heist is LIVE!"
Pro Tip: Use Buy Limit orders within a 15-30 min timeframe (recent swing low/high). ALERTS ARE A MUST!
🛑 Stop Loss (Escape Route)
Thief SL at nearest swing low (1.12500) on the 3H timeframe (Day/Swing trade).
Adjust based on your risk, lot size, and multiple orders.
🎯 Target (Loot & Scoot!)
🎯 1.17200 (or escape earlier if the cops show up!)
⚡ Scalpers’ Quick Grab
👀 Only scalp LONG!
Big wallets? Raid straight in.
Small stacks? Join swing traders for the robbery.
Use Trailing SL to protect your stolen cash! 💰
📢 Why This Heist? (EUR/USD Bullish Momentum)
"The Fiber" is heating up! Key drivers:
Fundamentals (COT Reports, Macro Data)
Sentiment & Intermarket Trends
Future Targets & Score Outlook
🔗 Want the full intel? Check our bio0 for linkks! 👉👉
⚠️ Trading Alert: News = Danger! 📰🚨
News releases = volatility spikes! Protect your loot:
❌ Avoid new trades during news.
🔒 Use Trailing SL to lock profits.
💖 Support the Heist Crew!
💥 Smash the Boost Button! 💥
More boosts = easier money steals!
Strengthen our robbery squad!
Every day is a heist—profit with Thief Trading Style! 🏆🚀
Stay tuned for the next robbery plan! 🤑🐱👤🤩
EURUSD_W trade ideas

EURUSD - Where to next?I managed to catch a nice 1:21 RR on EU
I am now triggered into a long position taking price back up to the previous highs and potentially beyond.
Price is at a very key area on the HTF and we are at a key area of Supply.
As price sits I'm still expecting it to continue higher, however, if we break the 4HR orderflow to the downside there is a strong possibility price will move lower.
We will keep an eye on this one this week!

EURUSDEURUSD getting ready for another push up, it needs some more correction before heading for the top.
Disclosure: We are part of Trade Nation's Influencer program and receive a monthly fee for using their TradingView charts in our analysis.

EURUSD : Dips Below 1.1400 The EUR/USD pair is currently hovering around 1.141, reflecting a clear lack of buying interest. As Friday's U.S. session unfolded, the pair lost momentum and slipped below the 1.1400 mark—an important psychological level that had previously offered support.
This decline came on the back of stronger-than-expected U.S. nonfarm payrolls data for May, which surprised markets and reignited confidence in the resilience of the American labor market. As a result, the U.S. dollar gained significant strength, bolstered by the growing probability that the Federal Reserve will hold interest rates steady through the next two policy meetings.

EURUSD - TECH. 2Hello Traders! It's Nika.
In this technical work, as we see here, there is a few things happening at the same moment.
First thing to focus on is that we have formatting double double-head acceding triangle.
We need wait or also go short for that with small time period. After that my prediction is the price will enter that channel in price range 1.13917 - 1.13247. So, after that we can wait for the market price confirmation and only after going Buy or Sell.
After all, what we got here is two good options.
1. Open short when market will open until the price will hit "Double-head acceding triangle" bottom.
2. Go into the position after a few days, when the price will enter & left channel range 1.13917 - 1.13247.
In long time period sell and buy probability, there is price marks on chart! So, you can use it as your TP.
Thank you!
Have a profitable day. :)

EUR/USD💰Symbol: { EUR/USD }
🟩Price: { 1.14044 & 1.14555 }
🟥Stop: { 1.14490 & 1.15124 }
1️⃣profit: { 1.14054 }
2️⃣profit: { 1.13646 }
3️⃣profit: { 1.13242 }
4️⃣profit: { 1.12725 }
5️⃣profit: { 1.12360 }
📊Check your chart before entering.
🚨Check before use to make sure there is no important news.🚨

EURUSD:Sharing of the Trading Strategy for Next WeekAll the trading signals this week have resulted in profits!!! Check it!!!👉👉👉
Fundamental Analysis:
Easing EU-U.S. trade tensions have provided support for the euro, though the stability of the eurozone's economic recovery remains uncertain—subsequent economic data will influence EUR dynamics. Markets are closely monitoring U.S. economic indicators and Federal Reserve policy: weak data or dovish signals could weaken the USD, benefiting EUR/USD.
Technical Analysis (4-Hour Chart):
MACD: Positive histogram shrinking, indicating diminishing bullish momentum and a non-trending market environment.
Price-Volume Divergence: Rising prices accompanied by declining trading volumes signal insufficient upward momentum.
KDJ: Reading of 95 suggests overbought conditions.
Key Levels: Resistance at 1.1461 (upper Bollinger Band), support at 1.1300.
Trading Recommendation:
Consider light long positions near 1.1350 on price retracement.
Trading Strategy:
buy@1.13500-1.13550
TP:1.14500-1.15000
Share accurate trading signals daily—transform your life starting now!
👇 👇 👇 Obtain signals👉👉👉

EURUSD Potential Long then ShortEUR/USD looking to trade around a key supply zone between 1.1450–1.1500. We’re watching for signs of bearish rejection to build a short bias from this area. No trade unless price confirms.
Main Setup:
If price retests upper zone (~1.1450–1.1500) and shows clear bearish price action, I’ll be looking to enter short.
Ideal signs: rejection wicks, SFPs, bearish engulfing, lower timeframe structure shift.
Break & Retest Option:
If price breaks below 1.1390, a clean bearish retest could offer a continuation short setup.
Structure break confirmation is key here.
This is a forecast, and trades will be dependent on live PA.
If we don’t get confirmation, we don’t force it. Patience is key.
DXY Outlook:
The Dollar Index looks bearish overall but is currently in a small corrective bounce. A short-term DXY pullback would support a push into EUR/USD’s supply zone — lining up nicely with our plan. If DXY flips back to bullish, that strengthens our short setup.

EURUSD SHORTAccording to natural market structure theory, I observed a gradual increase in volume starting from May 29, which led to a rebound around June 5. However, the uptrend has since lost momentum.
The recent price action has approached the zero line of the descending Fibonacci retracement. This movement, combined with a possible liquidity grab, suggests that the market may shift downward. The target price area is near the 0.5 Fibonacci level, but further observation is needed to confirm this scenario. OANDA:EURUSD

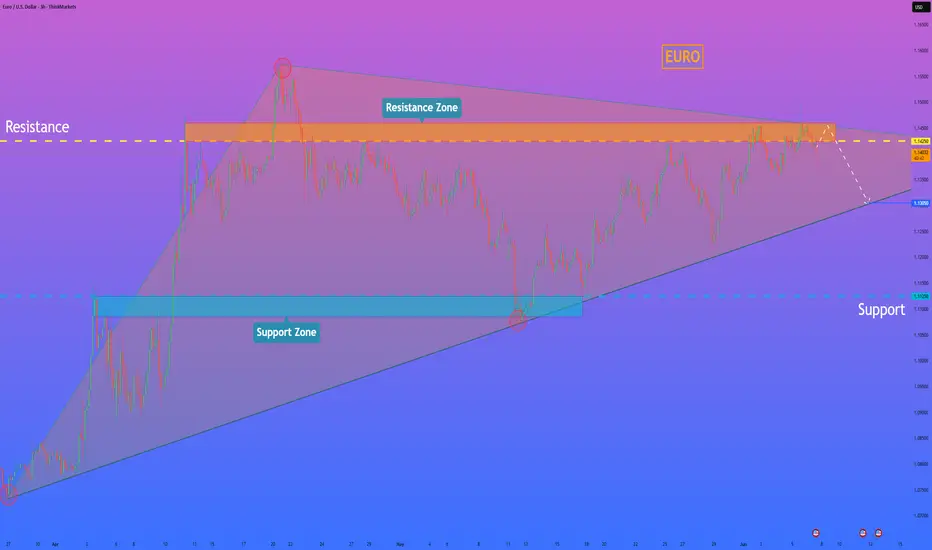
HelenP. I Euro may continue to decline to trend lineHi folks today I'm prepared for you Euro analytics. In this chart, we can see how the price reached the trend line and then started to grow inside a triangle pattern. Price some time traded near the trend line and then made an impulse up to the support level, which coincided with the support zone, and then made a correction, after which it turned around and made an impulse up one more time, breaking the support level. The euro reached the resistance level, which coincided with the resistance zone, and then made a small correction, after which it continued to move up and rose to the resistance line of the triangle. But then the Euro dropped below the resistance level, breaking it, and then continued to decline, after a retest. Price fell to the support zone, where it rebounded from the trend line, which is the support line of the triangle as well, and then started to grow. The euro has grown to a resistance zone, but recently it started to fall and now trades below the 1.1425 resistance level. So, I think that EURUSD will enter to resistance zone one more time and then continue to fall to the trend line. For this case, I set my goal at 1.1305 points, which coincided with this line. If you like my analytics you may support me with your like/comment ❤️
Disclaimer: As part of ThinkMarkets’ Influencer Program, I am sponsored to share and publish their charts in my analysis.
EURUSD TRADE INSIGHT Price has been bullish for a long time now, there was a temporary retracement into a mitigation zone, there's a bounce off and price is giving clear upwards shift in market structure, with the current bullish market structure, we have a confirmation for a buy next week.
But currently, price is ready to fall into our buy order block, so we'll be selling on Monday with market Open.
Check the charts, if it aligns with your system, then we've got to make money together on Monday morning.
Good morning traders and have a beautiful trading week ahead
Follow for more insights like this


EURUSD Expected Growth! BUY!
My dear followers,
I analysed this chart on EURUSD and concluded the following:
The market is trading on 1.1395 pivot level.
Bias - Bullish
Technical Indicators: Both Super Trend & Pivot HL indicate a highly probable Bullish continuation.
Target - 1.1419
About Used Indicators:
A super-trend indicator is plotted on either above or below the closing price to signal a buy or sell. The indicator changes color, based on whether or not you should be buying. If the super-trend indicator moves below the closing price, the indicator turns green, and it signals an entry point or points to buy.
Disclosure: I am part of Trade Nation's Influencer program and receive a monthly fee for using their TradingView charts in my analysis.
———————————
WISH YOU ALL LUCK

EURUSD Interim Short Active, Looking for the LongInterim short active from our analysis posted last night, rejected off the lower end of the supply zone highlighted. Looking for the trade to trade down to a good Demand level to then take this trade up to the higher levels of the supply zone. Targeting the 1.1500 region. This will be all dependent on price action. If price moves to plan and 1.1500 is achieved we then can look for the original short position highlighted in last nights analysis.

DeGRAM | EURUSD formed a bullish takeover📊 Technical Analysis
● A bullish engulfing on the grey 1.135-1.139 demand band reclaimed the inner trend-median and confirmed the base of the rising 2-month channel.
● The pull-back has just retested the broken wedge top (~1.140) as support; pattern height projects a grind to the channel mid-rail / horizontal cluster at 1.1565.
💡 Fundamental Analysis
● Ahead of the ECB’s expected “one-and-pause” 25 bp cut, EZ core CPI stayed stuck at 2.9 % y/y while soft US job-openings and lower T-bill yields narrowed the 2-yr spread, helping bids return to the euro.
✨ Summary
Long 1.137-1.140; hold above 1.135 seeks 1.156 ➜ 1.160. Invalidate on H4 close < 1.126.
-------------------
Share your opinion in the comments and support the idea with like. Thanks for your support!

EUR/USD 4H – Potential Quasimodo + Bearish Divergence SetupCurrently monitoring EUR/USD for a potential sell setup based on several strong technical confluences:
⸻
🧠 Price Structure: Possible Quasimodo (QM) Pattern
• The chart is showing early signs of a Quasimodo pattern (QM) formation.
• Left Shoulder and Right Shoulder are developing, with a higher high (false break) between them.
• The recent Dominant Break above 1.14948 could be a liquidity grab — classic in QM setups.
• Price appears to be retesting the right shoulder area, signaling potential for a bearish reversal.
⸻
📉 AO Indicator: Bearish Divergence as Confirmation
• Clear bearish divergence between price action and the Awesome Oscillator (AO):
• Price made a higher high, but AO printed a lower high.
• This signals weakening bullish momentum — a powerful confluence for a potential drop.
⸻
⚠️ Confluences for Sell Setup:
1. ✅ Potential QM Pattern forming
2. ✅ Dominant Break followed by a potential right shoulder retest
3. ✅ Strong bearish divergence on AO
4. ✅ Price failing to break and close strongly above recent high (~1.1494)
⸻
📍 Sell Trade Plan (if confirms):
• Entry Zone: Around 1.14400–1.14600 (right shoulder zone)
• Stop Loss: Above previous high (~1.15000)
• Take-Profit Options:
• TP1: Previous structure support around 1.13600
• TP2: Deeper support zone ~1.13000–1.12700
• TP3 (Aggressive): Full QM target near 1.12100 (as marked on the chart)
⸻
⏳ Wait For:
• Bearish rejection or momentum candle on 4H or 1H
• AO to cross below 0 or accelerate red bars for extra confirmation
⸻
💡 Conclusion:
EUR/USD is showing signs of a bearish reversal with a textbook QM setup supported by AO divergence. If the right shoulder holds and bearish momentum kicks in, this could offer a high-probability short opportunity.

EURUSD TRADING IN BULLISH TREND EURUSD TRADING IN BULLISH TREND.
Price is currently forming higher high and higher low formation.
Market was trading in secondary trend from lest few sessions.
Recently market shows interest of buyers by bullish engulfing candle.
Market may end this secondary trend and can start moving in primary trend.
Market is expected to remain bullish in upcoming trading sessions.
On lower side, 1.12200 is key support level.
On higher side market may hit the target levels of 1.15600.

EUR/USD Long📍 Entry (Buy Limit):
1.1085
This is just above the 1.1000 psychological level but below previous minor structure at 1.1100.
Captures a shallow retest without risking being front-run by liquidity sweeps.
🛑 Stop Loss (SL):
1.0910
Below consolidation zone and wicks around 1.10
Provides enough space beneath the major breakout level while staying tight for R:R
🎯 Take Profit Targets:
TP1: 1.1500 (Previous weekly resistance, already tested but not broken)
TP2: 1.2000 (Next clean monthly structure level)
TP3 (macro): 1.2400 (Upper range of long-term channel, highly reactive zone)
⚖️ Risk/Reward:
Risk: ~175 pips
Reward:
• TP1: ~415 pips
• TP2: ~915 pips
• TP3: ~1,315 pips
R:R = 2.4 to 1, 5.2 to 1, 7.5 to 1

EURUSD - Look for Short (SWING) 1:2.5!Price has formed an ascending channel on the higher time frame, currently consolidating before potentially entering a distribution phase. A breakout could occur in either direction, but if the chart pattern plays out as expected, we may see a break below the key support level. Let’s aim for at least TP1.
Disclaimer:
This is simply my personal technical analysis, and you're free to consider it as a reference or disregard it. No obligation! Emphasizing the importance of proper risk management—it can make a significant difference. Wishing you a successful and happy trading experience!


The surge in the euro was expected
💡Message Strategy
Since the beginning of this trading week, a number of economic data released by the United States have been weak. Following the decline in the manufacturing PMI, the ISM service PMI for May released on Wednesday fell to 49.9, the first contraction in nearly a year. In addition, the ADP employment data was also far below expectations, with only 37,000 new jobs, far below the expected 115,000, which strengthened the market's concerns about the risk of a US recession, thereby dragging down the US dollar.
At the same time, risk aversion and uncertainty in the United States have not improved significantly, and trade tensions, debt prospects and weak US bond yields have put pressure on the US dollar. Obviously, in the game between eurozone monetary policy and US economic data, the euro wins.
📊Technical aspects
From the daily chart, the exchange rate has maintained a strong oscillation pattern since mid-April, and has generally been running between the middle and upper tracks of the Bollinger Bands. The upper track of the Bollinger Bands is currently at 1.1471, and the lower track is at 1.1118. The Bollinger Bands are slightly open, indicating a rebound in volatility.
The MACD indicator shows that the double lines form a golden cross, and the bar chart turns from green to red, suggesting that the downward momentum is weakening; the RSI indicator remains near 57, slightly in the neutral to bullish area, and has not yet reached the overbought level. The overall technical pattern tends to fluctuate upward. If it breaks through the 1.1500 area, it will continue to rise.
At present, the main idea is still to do more on the callback, and do not blindly chase the short.
Long Position: 1.14450-1.14650


