lower moves expected after raid of liquidityMonday should seek liquidity higher from previous sessions then a move lower will be expected. this is also seen by the dollar move lower first to go higher
EURUSD_W trade ideas

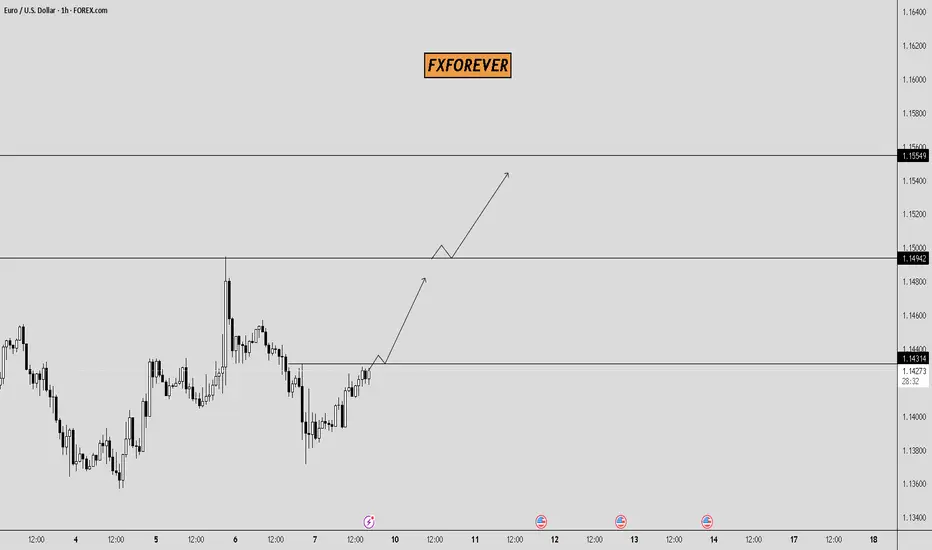
EUR/USD – Bullish Outlook (1H Chart)📈 EUR/USD – Bullish Outlook (1H Chart)
The pair is forming higher lows and pushing toward key breakout levels. Current structure supports a bullish scenario with clean targets ahead:
🔹 Key Breakout Zone: 1.14314
🔹 Next Target: 1.14942
🔹 Final Target: 1.15549
📍 Price is showing bullish momentum after reclaiming structure — if 1.14314 holds as support, we may see continuation toward the upper liquidity zones.
⚠️ Wait for confirmation on retest zones before entry.
#EURUSD #ForexForecast #FXFOREVER #PriceAction #BreakoutTrading #MarketStructure #BullishBias
EURUSD – Upper Boundary Holds Firm, Watch for a PullbackEURUSD remains well-contained within its ascending channel, but price has repeatedly been rejected near the upper boundary around the 1.14790 zone. This highlights that profit-taking pressure near the previous high remains significant.
The current bounce from the lower boundary is unconvincing, as the recent highs are not surpassing the previous ones. While EMA34 and EMA89 are still offering support, if price moves toward 1.14790 but fails to break through, a “minor double top” pattern may emerge—raising the risk of a short-term correction.
A notable scenario would be a rejection at 1.14790, followed by a pullback toward the lower channel boundary around 1.13870. A break below this level could temporarily invalidate the short-term uptrend.
At this stage, buyers should remain patient and only look to re-enter near clear support zones. Avoid chasing entries near major resistance areas.

EURUSD | 29.05.2025SELL 1.13800 | STOP 1.14650 | TAKE 1.12650 | Technically, we consider the option of decline inside the upper local channel to the target level of 1.12650.

Correction on EURUSDAfter Friday’s news, EURUSD reached 1,1368.
Make a note of the news candle and wait for a breakout.
If the retracement continues, the next key support level is 1,1317.
Important USD-related news is expected this Wednesday.
Watch for potential trend continuation setups and avoid rushing into new trades.

EURUSD Reversal Play Inside a Mean-Reverting Trend?EURUSD has already made its bullish push — but now it's flashing mixed signals. While the trend suggests continuation, forex's mean-reverting nature says otherwise. This low-probability idea targets a drop to the 4H range lows, then a rebound to retest the highs. Caution: we’re trading the chop here, not the trend.

eurusd about to make it boom again eurusd about to go long by completing the fifth wave and pulling a strong bullish move. what do you think?


EURUSD Trade Setup: Heres My Trade Plan!📈 EUR/USD Trade Outlook: Bullish Trend in Focus 🇪🇺💵
I'm currently watching EUR/USD, and it’s holding a strong bullish trend — with clear higher highs and higher lows across the board 🔁. On the 4-hour timeframe, price has pulled back into equilibrium, and I’m eyeing a potential buy opportunity if the structure continues to hold 🛒.
📚 Looking at historical price action, this setup has played out reliably in the past. That said, it's important to acknowledge that deeper pullbacks can occur — often sweeping liquidity below previous lows before resuming the trend 💧.
⚠️ This is a real risk, so consider conservative position sizing and always manage your risk appropriately.
💬 Drop a comment below if you're watching this setup too — I’d love to hear your take!
❗️Disclaimer: This is not financial advice. The content shared is for educational and informational purposes only. Please do your own analysis and trade responsibly.

EURUSD Wave Analysis – 6 June 2025
- EURUSD reversed from the resistance zone
- Likely to fall to support level 1.1350
EURUSD currency pair recently reversed down from the resistance zone located between the key resistance level 1.1475 (which has been reversing the price from the start of April) and the upper daily Bollinger Band.
The downward reversal from this resistance zone created the daily Japanese candlesticks reversal pattern Shooting Star,
Given the overbought daily Stochastic, EURUSD currency pair can be expected to fall to the next support level 1.1350.

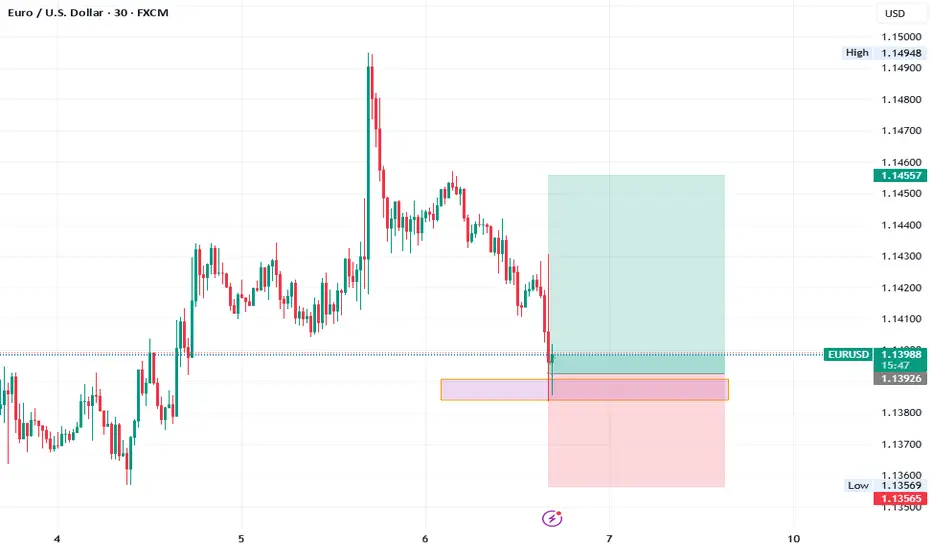
SHORT | EUR/USD | 1DMacro: Dollar strength likely as uncertainty grows from USD economic data; ECB expected to trim dovish tone next week.
Structure: In consolidation after reaching envelope top (~1.1494); forecasting downside to 1.1387–1.1400.
Trigger & Execution:
• Entry: Short on break below 1.1380
• Stop: 1.14678
• Target: 1.12344
• R:R: ~1:2.36
Rationale: Profit-taking above envelope top supports pullback; structural risk limit remains.

Are the Bulls Ready Yet?On the higher timeframes of the weekly, daily, and 4-hour charts, we can see that the market is bullish. The same bullishness is imminent on the 1-hour chart.
On the 1-hour chart, the trend is bullish. We see that the market is currently retracing bearish inside the bullish swing. We have 2 possible options here:
Scenario A:
We look to see a bullish reversal, which will indicate the end of the retracement and the commencement of an extension for higher prices. Where this happens, we will be targeting prices above the 1.15000 level.
We are already seeing near signs of bullishness as the current hour candle is bullish. If this bullishness holds to give us a bullish candle that engulfs the previous bearish candle(s), then we will commence our trade plan, using the Panzy Pips Bullish trade entry setup
In the event that we do not have scenario A play out, then we will look to scenario B
Scenario B:
Price is expected to continue the bearish retracement all the way down to our marked-out PB (PanzyPips Block), which has been refined to a tiny little area. Where that happens, we will look to see signs of a bullish reversal within our zone.
The moment price is in our zone and the reversal signs are clear, price will be said to be in a bullish extension, and we will expect to see price begin to rally all the way from that zone to our extension targets of regions above 1.150.
There is a second side to Scenario B, though. Let's call it scenario C.
Scenario C:
Prices can go all the way to our zone and not give us the expected bullish reversal. Instead of giving the reversal, price can take out our zone. (This is the least unlikely of the 3 scenarios, though.)
Where this happens, that is to say that price goes into our zone and fails to give us the needed reversal, we do NOTHING. If we do not see signs of a bullish reversal, as in Scenario B, we stay on the sidelines and wait.
NOTE: It is only when price gives us that reversal that we bring forth our PanzyPips Traders Checklist and look to catch the bullish move all the way to our expected target of above 1.15000.

EURUSD What Next? SELL!
My dear subscribers,
My technical analysis for EURUSD is below:
The price is coiling around a solid key level - 1.1401
Bias - Bearish
Technical Indicators: Pivot Points Low anticipates a potential price reversal.
Super trend shows a clear sell, giving a perfect indicators' convergence.
Goal - 1.1380
About Used Indicators:
By the very nature of the supertrend indicator, it offers firm support and resistance levels for traders to enter and exit trades. Additionally, it also provides signals for setting stop losses
Disclosure: I am part of Trade Nation's Influencer program and receive a monthly fee for using their TradingView charts in my analysis.
———————————
WISH YOU ALL LUCK

Euro will correct a little and then continue to move up nextHello traders, I want share with you my opinion about Euro. Observing this chart, we can see how the price entered to upward channel, where it at once dropped from the resistance line to the support line and then started to grow. In a short time price rose to the 1.1210 level, broke it, and even rose a little more, but soon turned around and declined to the support line of the channel. Then the Euro made an upward impulse, and then broke the 1.1210 level one more time and continued to grow inside the channel. Later price reached the resistance line of the channel and then corrected, after which, in a short time rose to the support area, breaking the 1.1400 level. But soon the price turned around and dropped to the 1.1210 level, thereby exiting from channel. Next, Euro continued to grow inside the wedge, where it rose to the current support level and soon broke it. After this, the price rose to the resistance line of the wedge and then corrected, after which it made an upward impulse. Price exited from the wedge, and now I think that the Euro can make a correction, after the rise, and then continue to grow next. That's why I set my TP at 1.1560 points. Please share this idea with your friends and click Boost 🚀
Disclaimer: As part of ThinkMarkets’ Influencer Program, I am sponsored to share and publish their charts in my analysis.

EUR/USD Reversal Imminent? 5 Powerful ReasonsEUR/USD – Tactical Bearish Outlook Ahead of Key Reversal
EUR/USD is approaching a critical inflection point where multiple technical and fundamental signals are aligning to suggest a potential short-term reversal.
📉 1. Price Action & Technical Structure (1W / 1D)
The pair recently completed a clean bullish structure inside an ascending channel, originating from the 1.0600 demand zone and reaching into the key supply area between 1.1400–1.1550.
Recent price behavior indicates:
A weekly candle with a strong upper wick, signaling institutional rejection.
A visible RSI bearish divergence, showing weakening momentum.
The most recent daily candle broke below the channel, suggesting a potential swing high.
Implication: A short-term reversal is likely, targeting the 1.1180 zone, with an extended move potentially reaching the 1.1050–1.1000 area.
🧠 2. COT Data – Institutional Positioning
USD Index:
Non-Commercials increased longs (+823) and slightly increased shorts (+363) — net bias still bullish USD.
Commercials also added to longs, further confirming institutional accumulation.
→ USD strength building.
EUR Futures:
Non-Commercials reduced longs (-1,716) and added shorts (+6,737).
The net long position in EUR continues to weaken.
→ Increasing risk of EUR retracement.
📅 3. Seasonality – EUR/USD in June
EUR/USD tends to be neutral to bearish in June.
The 5- and 10-year averages show consistent early-month declines, supporting a short bias in the first two weeks.
📊 4. Retail Sentiment
Sentiment is currently evenly split (50/50).
However, more volume is positioned long — a potential contrarian signal.
→ A break in this balance may trigger volatility and directionality.
🧭 5. Macro Context
Eurozone is facing stagnation, with falling inflation and weak growth.
U.S. data remains stronger, supporting the Fed’s “higher for longer” narrative.
→ This divergence favors a stronger USD in the near term.
✅ Trading Outlook
📉 Current Bias: Bearish (corrective)
📌 Short-Term Target: 1.1180
📌 Mid-Term Target: 1.1050–1.1000
❌ Invalidation: Weekly close above 1.1460
🎯 Strategy: Look for intraday rejection confirmations and sell pullbacks, in alignment with HTF structure and institutional flows.

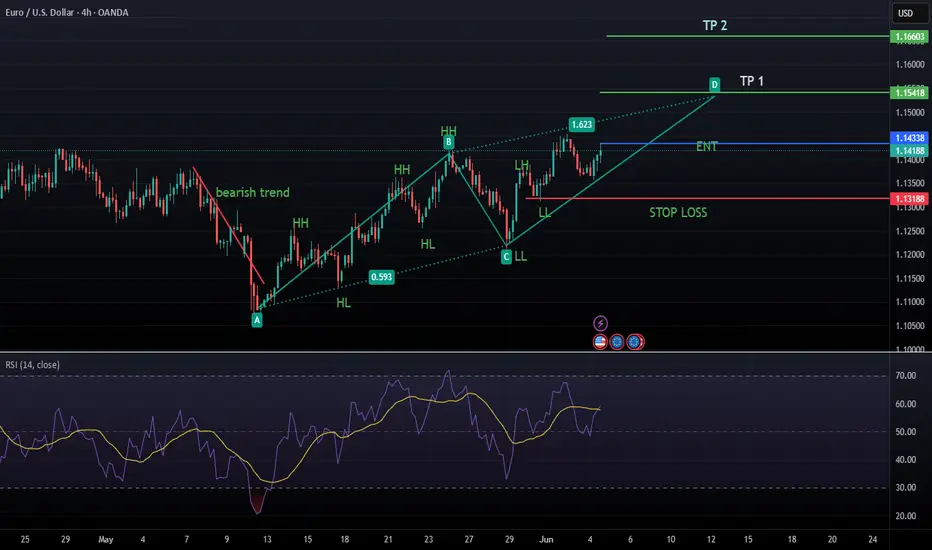
EUR/USD - 4H Analysis - High Probability Trade Setup🔍 Bias: Bullish continuation (Wave 5 setup)
📌 Key Confluences:
Wave (4) is retracing into a key demand zone with strong volume support.
Price is approaching the 71% Fibonacci retracement, a proven institutional entry level.
Ichimoku cloud is holding as dynamic support.
Wave (5) projection targets 1.1550–1.1600 zone (Swing Range).
🎯 Trade Idea:
Buy EUR/USD between 1.1280 – 1.1320
Stop Loss: Below 1.1220 (invalidates wave count)
Take Profit: 1.1550 (1:3+ RR)
⚠️ Risk Note: Confirmation via bullish engulfing candle or volume spike would increase the entry's conviction.
This setup offers strong confluence for a wave 5 rally, making it a high-probability long trade toward the upper swing range.
Follow along for more setups

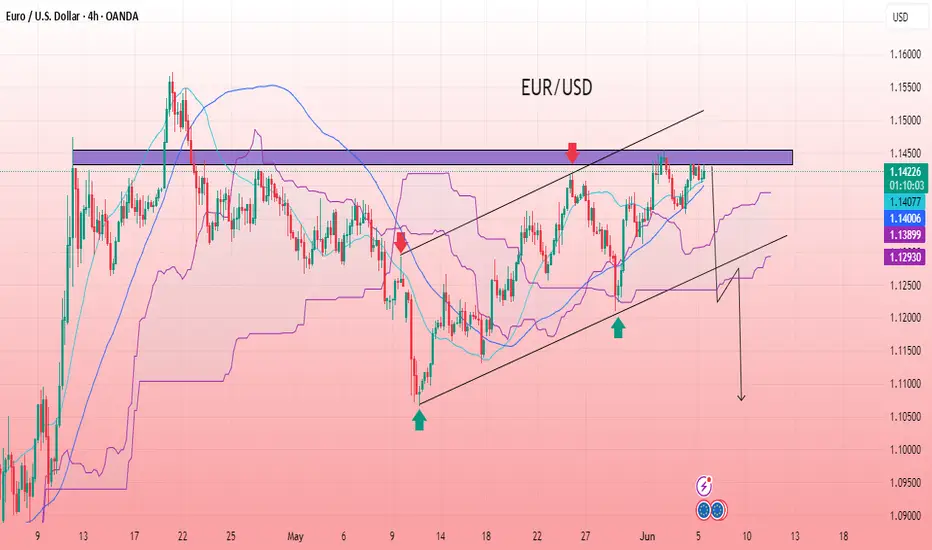
EUR/USD BEARISH SETUPEUR/USD is approaching a major resistance zone within a rising channel, showing signs of exhaustion after multiple failed attempts to break higher. The price action indicates a potential bearish reversal, especially with the presence of long upper wicks and weakening bullish momentum near the upper boundary. The Ichimoku cloud is thinning, and a break below the channel support could trigger a sharp drop. If sellers step in with volume confirmation, a downside move could unfold swiftly. This setup presents a high-probability short opportunity with strong risk-to-reward potential, ideal for trend reversal traders watching for structure breaks.
Entry: 1.14250
Target 1: 1.12230
Target 2: 1.10730
If you found this analysis helpful, don’t forget to drop a like and comment . Your support keeps quality ideas flowing—let’s grow and win together! 💪📈
EUR/USD – Bearish OutlookThe market showed its hand.
After weeks of climbing, EUR/USD pierced into the 1.14500–1.15000 battlefield, a zone defended by historical resistance and heavy liquidity. Like a sword through fog, it grabbed the stops – and reversed with fury. A textbook liquidity sweep.
On the daily timeframe, the signs are clear: a rejection candle forged in volatility and imbalance. On the weekly, a long upper wick whispers the truth – bulls were ambushed, and now the pullback begins.
🔥 My Path Is Written:
Retest complete.
Liquidity taken.
Now, the descent begins.
Targets:
1.1220 – 1.1050: First support fortress.
If broken, deeper raids toward 1.0940 and below.
Fundamentals align:
The ECB weakens its stance, while the Fed waits in silence, watching the data. NFP is today – and should it favor the dollar, the fire will be lit.
⚔️ Strategy:
I stand with the bears.
I do not chase – I prepare. I strike with patience and precision.
Let the weak follow price.
Let the strong follow purpose.
📉 EUR/USD – Bearish until proven otherwise.

EURUSD BUYAs the price reaches the specified location, it appears that a good opportunity exists to buy up to the specified area.

ECB rate announcement in focusthe European Central Bank (ECB) will be in focus today at 12:15 pm GMT and is anticipated to reduce rates amid recent CPI inflation (Consumer Price Index) softening by more-than-expected in May to 1.9% at the headline year-on-year (YY) level from 2.2% in April. YY core inflation – a measure that excludes volatile energy, food, alcohol, and tobacco prices – also softened to 2.3% in May from 2.7% in April.
I believe the last thing the ECB wants to do is shock the markets today, so I would be very surprised if they maintained rates at current levels. The decision, however, will be far from unanimous, with divisions among the 26 members who make up the ECB’s decision-making body. Markets expect the central bank to reduce all three benchmark rates by 25 bps, which would lower the deposit facility rate to 2.00% and the refinancing rate to 2.15%. If the ECB proceeds with another rate cut, this would mark the eighth reduction since the central bank commenced its easing cycle in mid-2024.
With a rate cut already baked in, I think the question top of mind among investors is what comes next. The ECB will likely want to signal a pause following today's cut, albeit a ‘dovish pause’. In the ECB’s macroeconomic projections, analysts are also expecting notable downward revisions to inflation and growth. Therefore, it will be interesting to see how they convey this via language in their rate statement and in ECB President Christine Lagarde’s press conference.
However, I find it very unlikely that forward guidance will provide a clear path, and the central bank is likely to remain in a data-dependent mode.
While a dovish cut from the ECB could send the EUR/USD southbound today, I expect it to be short-lived if US employment data comes in lower than expected on Friday.
Despite a temporary push lower potentially unfolding in the pair today, I remain bullish EUR/USD. As shown on the chart, the pair is shaking hands with monthly resistance from US$1.1457. Those who regularly follow my research will know that I am not enthusiastic about this level, given the inability of price to push through monthly support at US$1.1134 in May. Should follow-through buying emerge and US$1.1457 bids are consumed, I will be watching monthly resistance as far north as US$1.2028-US$1.1930.
Written by FP Markets Chief Market Analyst Aaron Hill

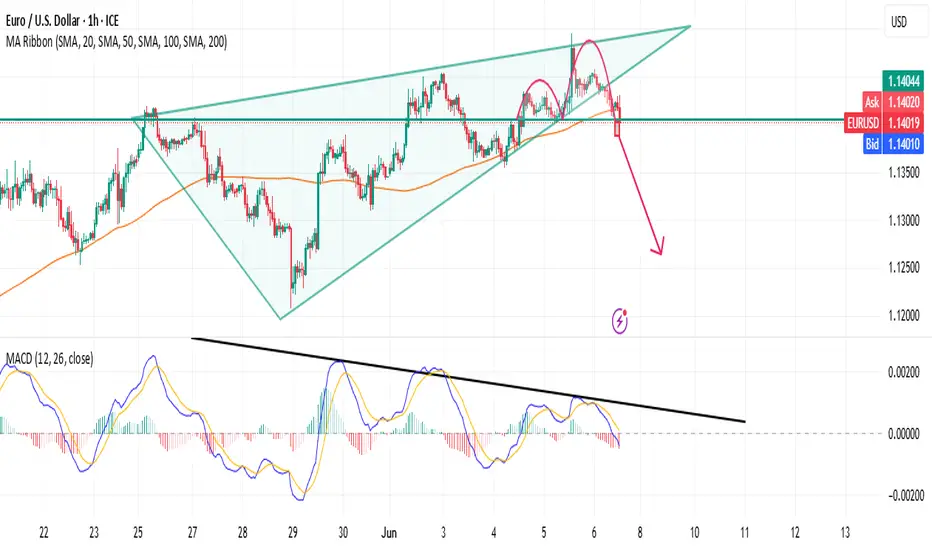
EURUSD vs USDCAD: Mirror Reversal Wedgesand FRL ConfirmationsTwo major FX pairs — EURUSD and USDCAD — are currently forming highly symmetrical, yet opposite structures across multiple timeframes. Each pair reflects the logic of the Fractal Reversal Law (FRL), where every phase of market movement is concluded by a reversal figure, and the neckline of that figure aligns precisely with the MA100.
EURUSD:
– Rising wedge on the H4 timeframe
– Bearish divergence on MACD
– Multiple double tops detected, necklines aligning with MA100 on H1 and H4
– Potential targets: 1.1355, 1.1300
– FRL context: structure of the uptrend is completing, neckline is acting as a phase boundary — possible reversal to the downside
USDCAD:
– Falling wedge visible on H1, H4, and D1
– Bullish divergence on MACD across all timeframes
– At least 3 nested double bottoms, with necklines exactly matching MA100
– Potential targets: 1.3750, 1.3860, 1.4020
– FRL context: the bearish phase is structurally complete; price is testing the neckline — signaling a likely reversal upward
Why this setup is special:
This is a rare mirror formation. Both pairs are building reversal figures that “rhyme” across timeframes, validated by strong divergence and neckline confluence with MA100. According to FRL, this kind of structure often marks the start of a new phase — and when mirrored across instruments, the probability increases dramatically.
Conclusion:
This setup illustrates the core of the FRL framework: price doesn’t reverse randomly — it completes a structure, prints a reversal figure, and challenges a horizontal neckline (often aligned with MA100). If confirmed, these trades could be textbook examples of structural phase shifts in the market.
Short summary (optional for the top of the idea):
EURUSD and USDCAD form opposite wedge patterns, with clear divergences and neckline-MA100 alignment across H1–D1. Textbook FRL symmetry — high probability of reversal on both ends.