EURUSD_W trade ideas

EURUSD vs USDCAD: Mirror Reversal Wedgesand FRL ConfirmationsTwo major FX pairs — EURUSD and USDCAD — are currently forming highly symmetrical, yet opposite structures across multiple timeframes. Each pair reflects the logic of the Fractal Reversal Law (FRL), where every phase of market movement is concluded by a reversal figure, and the neckline of that figure aligns precisely with the MA100.
EURUSD:
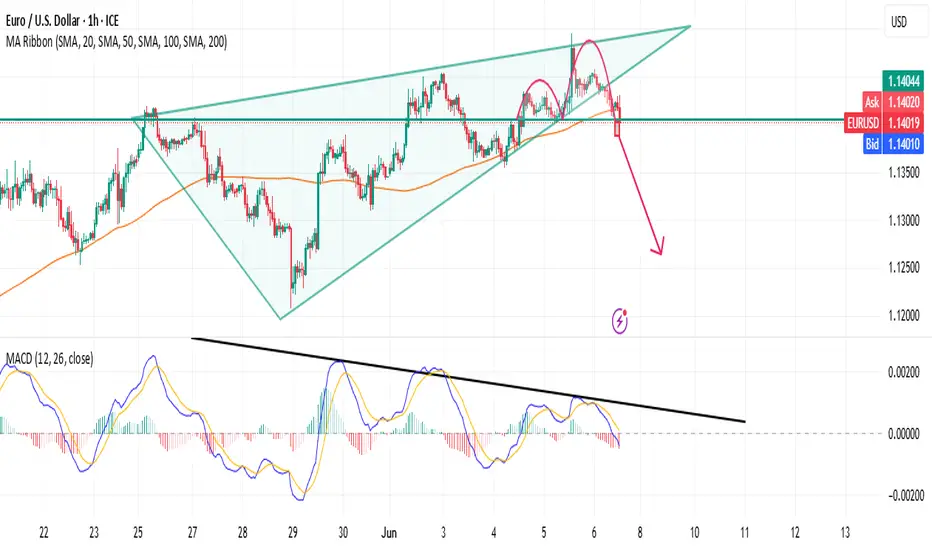
– Rising wedge on the H4 timeframe
– Bearish divergence on MACD
– Multiple double tops detected, necklines aligning with MA100 on H1 and H4
– Potential targets: 1.1355, 1.1300
– FRL context: structure of the uptrend is completing, neckline is acting as a phase boundary — possible reversal to the downside
USDCAD:
– Falling wedge visible on H1, H4, and D1
– Bullish divergence on MACD across all timeframes
– At least 3 nested double bottoms, with necklines exactly matching MA100
– Potential targets: 1.3750, 1.3860, 1.4020
– FRL context: the bearish phase is structurally complete; price is testing the neckline — signaling a likely reversal upward
Why this setup is special:
This is a rare mirror formation. Both pairs are building reversal figures that “rhyme” across timeframes, validated by strong divergence and neckline confluence with MA100. According to FRL, this kind of structure often marks the start of a new phase — and when mirrored across instruments, the probability increases dramatically.
Conclusion:
This setup illustrates the core of the FRL framework: price doesn’t reverse randomly — it completes a structure, prints a reversal figure, and challenges a horizontal neckline (often aligned with MA100). If confirmed, these trades could be textbook examples of structural phase shifts in the market.
Short summary (optional for the top of the idea):
EURUSD and USDCAD form opposite wedge patterns, with clear divergences and neckline-MA100 alignment across H1–D1. Textbook FRL symmetry — high probability of reversal on both ends.
ECB rate announcement in focusthe European Central Bank (ECB) will be in focus today at 12:15 pm GMT and is anticipated to reduce rates amid recent CPI inflation (Consumer Price Index) softening by more-than-expected in May to 1.9% at the headline year-on-year (YY) level from 2.2% in April. YY core inflation – a measure that excludes volatile energy, food, alcohol, and tobacco prices – also softened to 2.3% in May from 2.7% in April.
I believe the last thing the ECB wants to do is shock the markets today, so I would be very surprised if they maintained rates at current levels. The decision, however, will be far from unanimous, with divisions among the 26 members who make up the ECB’s decision-making body. Markets expect the central bank to reduce all three benchmark rates by 25 bps, which would lower the deposit facility rate to 2.00% and the refinancing rate to 2.15%. If the ECB proceeds with another rate cut, this would mark the eighth reduction since the central bank commenced its easing cycle in mid-2024.
With a rate cut already baked in, I think the question top of mind among investors is what comes next. The ECB will likely want to signal a pause following today's cut, albeit a ‘dovish pause’. In the ECB’s macroeconomic projections, analysts are also expecting notable downward revisions to inflation and growth. Therefore, it will be interesting to see how they convey this via language in their rate statement and in ECB President Christine Lagarde’s press conference.
However, I find it very unlikely that forward guidance will provide a clear path, and the central bank is likely to remain in a data-dependent mode.
While a dovish cut from the ECB could send the EUR/USD southbound today, I expect it to be short-lived if US employment data comes in lower than expected on Friday.
Despite a temporary push lower potentially unfolding in the pair today, I remain bullish EUR/USD. As shown on the chart, the pair is shaking hands with monthly resistance from US$1.1457. Those who regularly follow my research will know that I am not enthusiastic about this level, given the inability of price to push through monthly support at US$1.1134 in May. Should follow-through buying emerge and US$1.1457 bids are consumed, I will be watching monthly resistance as far north as US$1.2028-US$1.1930.
Written by FP Markets Chief Market Analyst Aaron Hill

EUR/USD | Smart Money is Watching This Level |Major Drop LoadingPrice entered a major institutional sell zone (blue shaded area) and got rejected hard. Classic sign of smart money distribution.
🔻 Short Bias activated while price trades below 1.14994.
---
🎯 Targets:
📉 TP1: 1.12325 – Previous structural support
📉 TP2: 1.09023 – Strong demand zone (orange area)
---
🧠 Why This Matters:
This move looks like a liquidity sweep above the highs, followed by a return to premium for smart money to short. Now price is compressing under resistance – possible redistribution in play.
---
🚨 High-Impact Events Coming:
3 major USD news releases are lined up around June 11.
This could be the catalyst to send EUR/USD plummeting toward demand.
---
✅ Trading Plan:
🔍 Watch for a bearish confirmation pattern (e.g. break of structure + lower high)
❌ No buys in the supply zone
🛑 Stop loss: Above 1.1500 (wick trap area)
✅ Sell setup is valid below that level
---
💬 Agree or Disagree?
Comment below 👇 with your view:
🔴 Bearish like me?
🟢 Or are you expecting a breakout?
📌 Don’t forget to LIKE ❤️ & FOLLOW for more institutional setups!
#EURUSD #SmartMoney #SupplyAndDemand #PriceAction #LuxAlgo #ForexAnalysis #SwingTrade #BearishBias #LiquiditySweep #ForexSignals

Fixed below MA100. Going lower.The euro failed to develop a growing movement last week, and the hourly chart closed below 100 periods of the moving average.
There is a high probability of a decline to the imbalance zone of 1.13100. There is also a local minimum here.
RR of a possible deal 4-5.

EURUSD ahead of NFPYesterday, the ECB cut interest rates, and EURUSD climbed to 1,1495.
Today, the U.S. jobs data (NFP) will be released.
This news comes out on the first Friday of every month at 1:30 PM London time and tends to have a significant impact on the market.
It's advisable to reduce risk on open positions and avoid rushing into new trades before the news is released.
Watch how the price reacts around key levels and whether it has the strength to continue the trend.

EURUSD H1 I Bearish Reversal Based on the H1 chart analysis, we can see that the price is rising toward our sell entry at 1.1433, which is a pullback resistance aligning with a 50% Fibo retracement.
Our take profit will be at 1.1386, an overlap support level.
The stop loss will be placed at 1.1457, a swing-high resistance level.
High Risk Investment Warning
Trading Forex/CFDs on margin carries a high level of risk and may not be suitable for all investors. Leverage can work against you.
Stratos Markets Limited (tradu.com/uk ):
CFDs are complex instruments and come with a high risk of losing money rapidly due to leverage. 63% of retail investor accounts lose money when trading CFDs with this provider. You should consider whether you understand how CFDs work and whether you can afford to take the high risk of losing your money.
Stratos Europe Ltd (tradu.com/eu ):
CFDs are complex instruments and come with a high risk of losing money rapidly due to leverage. 63% of retail investor accounts lose money when trading CFDs with this provider. You should consider whether you understand how CFDs work and whether you can afford to take the high risk of losing your money.
Stratos Global LLC (tradu.com/en ):
Losses can exceed deposits.
Please be advised that the information presented on TradingView is provided to Tradu (‘Company’, ‘we’) by a third-party provider (‘TFA Global Pte Ltd’). Please be reminded that you are solely responsible for the trading decisions on your account. There is a very high degree of risk involved in trading. Any information and/or content is intended entirely for research, educational and informational purposes only and does not constitute investment or consultation advice or investment strategy. The information is not tailored to the investment needs of any specific person and therefore does not involve a consideration of any of the investment objectives, financial situation or needs of any viewer that may receive it. Kindly also note that past performance is not a reliable indicator of future results. Actual results may differ materially from those anticipated in forward-looking or past performance statements. We assume no liability as to the accuracy or completeness of any of the information and/or content provided herein and the Company cannot be held responsible for any omission, mistake nor for any loss or damage including without limitation to any loss of profit which may arise from reliance on any information supplied by TFA Global Pte Ltd.
The speaker(s) is neither an employee, agent nor representative of Tradu and is therefore acting independently. The opinions given are their own, constitute general market commentary, and do not constitute the opinion or advice of Tradu or any form of personal or investment advice. Tradu neither endorses nor guarantees offerings of third-party speakers, nor is Tradu responsible for the content, veracity or opinions of third-party speakers, presenters or participants.

Despite some difficulties, EUR is still in an uptrendThe European Central Bank cut interest rates by 25 basis points as expected and said inflation was close to its medium-term target of 2%. Trump's tariff policies have loosened financial conditions, suggesting further easing is likely.
This dovish stance has put some pressure on the euro. Preliminary eurozone CPI data for May showed that inflationary pressures slowed more than expected, dragging the euro down. Germany’s manufacturing PMI for May was weaker than expected, suggesting further contraction in the manufacturing sector; France’s services PMI was better than expected, but still in contraction territory. Eurozone economic data has been mixed. European Central Bank President Lagarde said the monetary easing cycle was coming to an end, boosting market confidence in the euro over the medium term.
But caution will still be needed about the impact of Trump’s tariff policies on the global economy. While the ECB believes trade tensions have eased, the eurozone is not completely out of the woods. If future economic data remains weak, the euro could face downward pressure.
On the daily chart of OANDA:EURUSD after receiving support from the 0.236% Fibonacci retracement level with horizontal support at 1.12038, the recovery momentum has created a significant increase. Specifically, the increase has tested the levels of 1.14744 and 1.14212, please note that in the previous publication about EUR/USD, these levels are also the nearest resistance at present.
However, in terms of the overall technical picture, EUR/USD is still in a bullish trend with a break above 1.14744 opening the door for a new bullish cycle with a short-term target of 1.15720.
Intraday, the bullish outlook for EUR/USD will be highlighted again by the following price points.
Support: 1.13788 – 1.12422
Resistance: 1.14212 – 1.14744

EUR/USD – Bullish Smart Money SetupAfter a clean break of structure to the upside (BOS), EUR/USD is expected to retrace into the unmitigated demand zone before continuing higher.
Liquidity sits above the recent Weak High, making it a prime target for institutions.
📍 Buy Limit: 1.14100
🛑 SL: 1.13870
🎯 TP1: 1.14550
🎯 TP2: 1.14800+
Structure: Bullish ✅
OB Unmitigated: ✅
RSI Neutral-Bullish ✅
Liquidity Above: Yes ✅
"Wait for mitigation and confirmation before execution."

Buy trade on EURUSD Ok. From my strategy stand point, I see a potential buy on EU, reason been that price broke out of my trend line and gives me an abc setup , then I locate my poi, which I s my entry point, so i am in for a buy

EURUSD Analysis todayHello traders, this is a complete multiple timeframe analysis of this pair. We see could find significant trading opportunities as per analysis upon price action confirmation we may take this trade. Smash the like button if you find value in this analysis and drop a comment if you have any questions or let me know which pair to cover in my next analysis.

Weekly technical analysis EURUSDIn the weekly Time-Fractal, price has gathered high liquidity above the weekly range after completing two price moves. If price retraces to the support zone marked in yellow on the chart, and a suitable candlestick setup appears along with increased liquidity, one could consider entering long-term buy trades targeting 1.24000. Please note that this is purely an analysis.

EURUSD LIVE TRADEHello friends
Since the price has reached the specified important resistance, a correction in the price is expected. Therefore, you can enter the position with capital and risk management and move with it to the specified goals.
*Trade safely with us*

EURUSD - SellEntered this earlier on the 1min TF
Target will be the first Order Block which is 21:RR.
The reason I am targeting here is the 4H order flow is still bullish. So if we can hit the target I close 50% of the position and let the rest ride and manage accordingly to price.
Lets see how it plays out

EURUSD Breakout and Potential RetraceHey Traders, in today's trading session we are monitoring EURUSD for a buying opportunity around 1.13700 zone, EURUSD was trading in a downtrend and successfully managed to break it out. Currently is in a correction phase in which it is approaching the retrace area at 1.13700 support and resistance area.
Trade safe, Joe.

Falling towards pullback support?EUR/USD is falling towards the support level which is a pullback support that aligns with the 50% Fibonacci retracement and could bounce from this level to our take profit.
Entry: 1.1325
Why we like it:
There is a pullback support level that lines up with the 50% Fibonacci retracement.
Stop loss: 1.1266
Why we like it:
There is a pullback support level that lines up with the 78.6% Fibonacci retracement.
Take profit: 1.1418
Why we like it:
There is a pullback resistance level.
Enjoying your TradingView experience? Review us!
Please be advised that the information presented on TradingView is provided to Vantage (‘Vantage Global Limited’, ‘we’) by a third-party provider (‘Everest Fortune Group’). Please be reminded that you are solely responsible for the trading decisions on your account. There is a very high degree of risk involved in trading. Any information and/or content is intended entirely for research, educational and informational purposes only and does not constitute investment or consultation advice or investment strategy. The information is not tailored to the investment needs of any specific person and therefore does not involve a consideration of any of the investment objectives, financial situation or needs of any viewer that may receive it. Kindly also note that past performance is not a reliable indicator of future results. Actual results may differ materially from those anticipated in forward-looking or past performance statements. We assume no liability as to the accuracy or completeness of any of the information and/or content provided herein and the Company cannot be held responsible for any omission, mistake nor for any loss or damage including without limitation to any loss of profit which may arise from reliance on any information supplied by Everest Fortune Group.

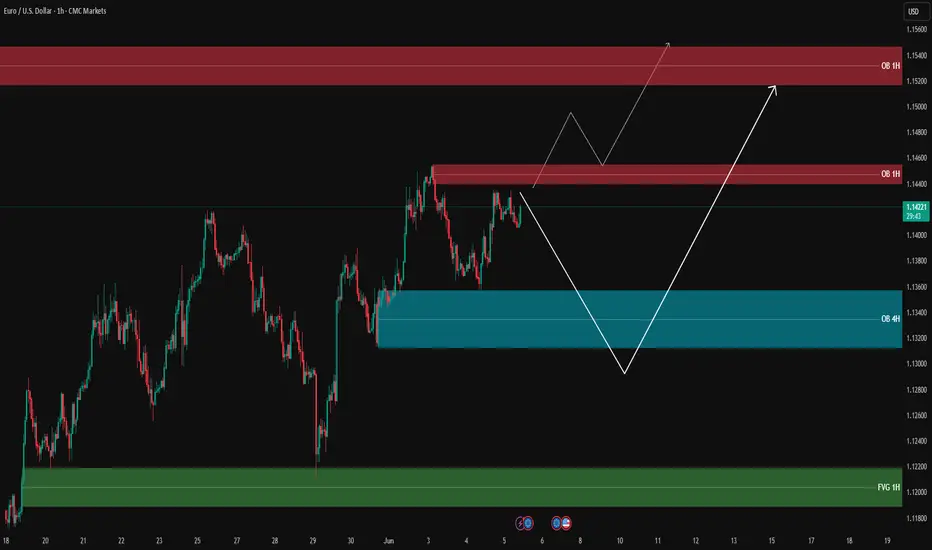
EUR/USD Analysis – Possible Scenarios🔹 Price is currently trading around 1.1421, consolidating between key supply and demand zones.
🔴 Supply Zone (Order Block 1H): 1.14360 – 1.14590
📌 Strong bearish reaction from this resistance area. First scenario: rejection from this OB and a move downward.
🔵 Demand Zone (Order Block 4H): 1.13050 – 1.13430
✅ If price fails to break the resistance, we could see a retracement to this OB. Bullish reaction here may offer long opportunities.
🟢 Fair Value Gap (FVG 1H): 1.11800 – 1.12220
📉 If OB 4H fails to hold, price could drop into this FVG area – a high-liquidity zone for potential reversal.
📊 Possible Scenarios:
1️⃣ Break and hold above OB 1H → price may extend toward next OB zone at 1.15150 – 1.15400
2️⃣ Rejection from OB 1H → pullback to OB 4H → possible long setup if confirmed
3️⃣ Break below OB 4H → deeper move into FVG 1H
‼️ Avoid premature entries – wait for valid confirmations.
🔍 Insight by ProfitaminFX
If this outlook aligns with your bias, or if you see it differently, feel free to share your perspective in the comments. Let’s grow together 📈
EURO - Price can drop to $1.1280, breaking support levelHi guys, this is my overview for EURO, feel free to check it and write your feedback in comments👊
A few days ago price broke $1.1375 level and then entered to triangle pattern, where it at once dropped from resistance line.
Price fell to $1.1375 level, where it some time traded between and then continued to decline to $1.1220 level.
When Euro declined to this level, it at once broke this level and fell to support line of a triangle pattern.
Next, price turned around and in a short time rose higher than $1.1220 level, breaking it and continued to grow next.
Euro rose to resistance line and then corrected, after which it made an upward impulse, thereby exiting from triangle.
Now, price traded inside resistance area, near $1.1375 level, and I think EUR can drop to $1.1280
If this post is useful to you, you can support me with like/boost and advice in comments❤️
Disclaimer: As part of ThinkMarkets’ Influencer Program, I am sponsored to share and publish their charts in my analysis.

EURUSDEURUSD euro was not good last week dxy shift to bullish expecting this week for the continuation of usd pushing higher eurusd should continue the bearish trend zone to watch 1.13000/1.12500

EURUSD bullish for a double top?Eurusd broke and retested the triangle so we could see some upward movement to test the previous highs around the 1.1550 area.

EUR/USD is about to clarify its trend direction
💡Message Strategy
The recent trend of the euro is affected by the resonance of multiple macroeconomic factors. First, the eurozone CPI data for May showed that the overall annual rate dropped sharply from 2.2% to 1.9%, and the core CPI annual rate also fell to 2.3%, hitting a one-year low, which suppressed the market demand for the euro. This cooling trend of inflation has significantly strengthened the market's expectations that the European Central Bank will further cut interest rates. The current market has fully taken into account the possibility of a 25 basis point rate cut on Thursday, and even expectations of further rate cuts in July have fermented.
At the same time, US economic data is still weak. The ISM manufacturing PMI fell to 48.5, which has been in the contraction range for several consecutive months. In addition, the JOLTS job vacancies may hit a new low, which makes the dollar bulls lack support. In general, the euro is facing a tug-of-war between the eurozone's easing expectations and the weakness of the US dollar, and the market is generally optimistic about the trend.
📊Technical aspects
From the K-line pattern, the long and short sides are stuck near 1.1400, and a unilateral trend has not yet formed. It is worth noting that the high point of 1.1572 in mid-April has formed an obvious resistance band so far, and the upper 1.1500 is a psychological integer mark, and it is also the previous high, forming the first key resistance line. If it breaks through this level, it may usher in further upward space.
In terms of MACD indicators, the bar chart is currently oscillating near the zero axis, and the fast and slow lines are above the zero axis, indicating that the bullish momentum is dominant. RSI remains at 57.94, which is in the neutral to strong range, but has not entered the overbought area, and there is still potential for short-term growth.
💰 Strategy Package
Long Position:1.13750-1.13850

EURUSD: Bullish Continuation is Expected! Here is Why:
Our strategy, polished by years of trial and error has helped us identify what seems to be a great trading opportunity and we are here to share it with you as the time is ripe for us to buy EURUSD.
Disclosure: I am part of Trade Nation's Influencer program and receive a monthly fee for using their TradingView charts in my analysis.
❤️ Please, support our work with like & comment! ❤️

EURUSD Analysis | Potential Breakdown AheadHello Traders
The pair has been respecting a rising parallel channel after breaking out from a consolidation zone earlier this month.
🔹 Current Price: 1.1409
🔹 Trend: Uptrend within a rising channel
🔹 Key Observation: Price is testing the upper range but showing signs of weakness.
🔍 Technical Breakdown:
Price recently failed to make a new high, showing signs of exhaustion.
A break below the channel support could trigger a sharp move downward.
Two strong support levels are in focus:
1.12308 (short-term target)
1.10812 (major target)
📉 Bearish Scenario:
If we get a confirmed break below the channel, I’ll be looking for short opportunities with the first target at 1.1230, and if momentum continues, down to 1.1080.
⚠ Watch for rejection candles or a strong bearish close below the channel support to confirm the move.
💬 What’s your bias on EUR/USD? Are you trading this potential setup?
#EURUSD #Forex #TechnicalAnalysis #PriceAction #TradingView #ChartAnalysis
