EURUSDEURUSD,the structure is showing a buy trend and traders will have to follower the price action on day to day bases .
EURUSD_W trade ideas

EUR/USD💰Symbol: { EUR/USD }
🟩Price: { 1.14041 }
🟥Stop: { 1.14504 }
1️⃣profit: { 1.13586 }
2️⃣profit: { 1.13226 }
3️⃣profit: { 1.12711 }
📊Check your chart before entering.
🚨Check before use to make sure there is no important news.🚨

EUR/USD – The Setup Has Spoken.Price is pressing against the 0.886 retracement with strength, and all eyes are now on the 1.23268 – 1.24000 Fibonacci extension zone.
We’re not just charting – we’re challenging.
This is a technical battlefield and we dare any trader to play the same game.
If you're still short, you better know something the rest of us don't.
If you're long – load it right and manage risk. 🫡
📍 Key Levels:
Support: 1.11153
Next Major Target: 1.23268
Bullish Confirmation: Daily close above 1.15729
Let’s see who survives the Fibonacci wave.
Call your strategy – but don't say you weren’t warned.
#EURUSD #ForexTrading #Fibonacci #SmartMoney #WaverVanir #DareToTrade #PriceAction #LiquidityGrab

EUR/USD Bulls Fail to Press 1.1500 - Builds Possible Lower-HighFor EUR/USD it's what didn't happen this week...
Despite a seemingly open door for bulls to run a breakout, helped along by a Christine Lagarde that sounded less dovish than usual at Friday's rate cut, the pair put in a hard charge towards the 1.1500 handle but interestingly fell just about 5 pips short of the big figure. That's the same price that helped to bring a pullback back in April but in that instance, bulls were able to force a test above - and this time, it's as if sellers were waiting at the ready - and unwilling to miss the shot to get short. This can be read as bearish anticipation and while it's not an automatic indication of reversal, it can be an attractive first step towards that.
So far there remains bullish potential on the daily chart as the past week has produced both a higher-low and a higher-high. But from the four hour, deeper pullback potential appears as a breach of the 1.1400 level shows a shorter-term lower-low. And that, combined with the failure to test 1.1500, makes EUR/USD an attractive venue if looking for USD-strength. And if looking for USD-weakness it seems that there are more attractive options out there, such as GBP/USD which did set a fresh three-year-high this week even as EUR/USD held at a lower-high. - js

EUR/USD – Daily Chart AnalysisPrice has approached a major resistance zone (1.1415 area), which has previously acted as a strong barrier. A bearish rejection is visible, indicating potential for a downside move if price fails to break above convincingly.
📉 Bearish Scenario in Focus
Resistance Zone: 1.1415 – 1.1450
Target 1: 1.1231
Target 2: 1.1068
Target 3: 1.0746
A clean rejection from the resistance zone may trigger a move toward the marked support levels. Confirmation from candlestick patterns or momentum indicators would strengthen this outlook.
⚠️ This idea is shared for educational purposes only and does not constitute financial advice.

EUR/USD – Bearish OutlookThe trap has been set.
EUR/USD swept the highs — and now the war begins.
This isn’t just price action.
It’s a precision strike based on structure, liquidity, and fundamentals.
ECB cut rates.
The dollar’s ready to fight.
The weekly candle? A sword slash straight through the bulls.
I’m not predicting — I’m preparing.
Watch the zone. Mark the levels.
We trade with vision.
We strike with discipline.

EURUSD Set To Grow! BUY!
My dear friends,
My technical analysis for EURUSD is below:
The market is trading on 1.1420 pivot level.
Bias - Bullish
Technical Indicators: Both Super Trend & Pivot HL indicate a highly probable Bullish continuation.
Target - 1.1439
About Used Indicators:
A pivot point is a technical analysis indicator, or calculations, used to determine the overall trend of the market over different time frames.
Disclosure: I am part of Trade Nation's Influencer program and receive a monthly fee for using their TradingView charts in my analysis.
———————————
WISH YOU ALL LUCK

Why Higher Timeframe Analysis Increases Your WIN-RATE!Many traders focus too heavily on lower timeframes, chasing setups without any real context. But what if the secret to improving your consistency was as simple as zooming out?
In this video, we break down why analyzing higher timeframes—and trading in their direction—can significantly increase your win rate across Forex, crypto, stocks, and futures. This isn’t just a theory. It’s a principle used by institutional traders, prop firms, and consistently profitable independent traders.
✅ Here’s what you’ll learn in this deep-dive:
The real purpose of higher timeframe analysis and how it acts like a GPS for your trading decisions.
How to identify structure, liquidity, and key levels on the daily, 4H, and weekly charts
Why trading against the higher timeframe flow often leads to premature stop-outs or fakeouts
The power of multi-timeframe alignment: how to sync HTF bias with LTF entries
How trading with higher timeframe momentum helps filter noise, reduce overtrading, and increase conviction
A walkthrough example showing how to use HTF context to validate a lower timeframe setup
Whether you're trading ICT concepts, Fibs, RSI, VWAP, or your own system—this principle applies. Trading in alignment with the higher timeframe doesn’t just increase your odds, it adds structure, patience, and confidence to your process.
📌 Key takeaway: When you understand what the market is doing on the higher timeframe, you stop guessing and start positioning yourself with the move—not against it.
🛠️ Helpful for traders using:
Smart money concepts (SMC)
ICT-based models (like AMD, OTE, and NDOG)
Supply and demand strategies
Price action or indicator-based systems
PRACTICALLY ANY TYPE OF STRATEGY OR METHODOLOGY
So, I hope the video was insightful for you. Let me know if you apply higher timeframe analysis, and how it has helped you.
- R2F Trading

EURUSD at Resistance – Pullback Ahead?Hello traders! What’s your take on EURUSD?
EURUSD is currently trading just below a key resistance zone, signaling a potential pullback. A double top pattern may be forming, suggesting the pair could correct before regaining bullish momentum.
We expect a short-term retracement toward the identified support levels before any continuation of the broader uptrend.
Despite this near-term weakness, our long-term outlook remains bullish. This pullback might actually present a better entry opportunity in line with the overall trend.
Do you see it the same way? Drop your thoughts in the comments! 💬

Going Long on EURUSDThis trade setup was stopped out
I have noticed a trend among retail traders/investors. Once they place a trade and if they get stopped out, naturally they are unhappy with the outcome. Worse, they moved on to other pairs or other asset classes to trade.
More often than not, upon closer examination, it could be a situation of placing too tight SL or having the courage to follow up again and LONG again.
It works for me, I dunno about you. Stick to a few pairs or asset classes and after a while, if you add on your winning positions, you soon realised that you and the chart becomes connected (not in a spiritual way) but you straight away know where you are at certain point in the chart and know what decision to take.
I have also revised my strategy a little. One, to have no profit target since if the market is moving in tandem with me then taking profits too early would means I have to get in at higher price each time and a strong retracement could wipe me out.
Next, adding to winning positions has also proven profitable rather than going into a new trade setup which takes time to do research.
By limiting my exposure to fewer asset class, I become more in tune with the market development and know how to react. Diversifying too widely makes my capital allocation spread too wide without the opportunity to go deep into my profits.
Lastly, slowly I am also increasing my position sizing to take advantage of the trend. IF 1 contract yields 1 dollar then 5 contracts would gives me 5 dollars with the same move. This takes courage and conviction which over time, studying the losses and winners helps me to get there , slowly...........
The Day Ahed🇺🇸 United States
May Jobs Report: Expected to show 125,000 new jobs (vs. 177,000 in April); unemployment rate likely steady at 4.2%. Slower hiring may reflect effects of trade tensions.
April Consumer Credit: Will reveal household borrowing trends. "Buy Now, Pay Later" usage is up, especially among younger, wealthier consumers. Consumer stress rising.
🇯🇵 Japan
April Household Spending: Fell 0.1% YoY, below expectations (+1.4%). Inflation outpaced wage growth, curbing spending.
Leading Economic Index: Fell 0.7%, pointing to a potential slowdown due to weak new orders and U.S. trade policy uncertainty.
Coincident Index: Up 0.1% in January, but down 0.4% over six months—indicates stagnating current economic activity.
🇩🇪 Germany
April Industrial Production: Rose 0.3% MoM, rebounding after a sharp March decline. Industrial and mining sectors showed improvement.
Trade Balance: Data awaited. Recent uptick in orders (+0.6% in April) suggests signs of manufacturing recovery.
🇫🇷 France
Trade Balance & Current Account: April data pending. In recent months, the current account deficit narrowed due to reduced goods imports.
Industrial Production: Will provide further insight into economic activity.
🇪🇺 Eurozone
April Retail Sales: Scheduled for release. Will indicate regional consumer spending strength.
🇨🇦 Canada
May Jobs Report: Will offer a snapshot of labor market health amid economic uncertainty.
This communication is for informational purposes only and should not be viewed as any form of recommendation as to a particular course of action or as investment advice. It is not intended as an offer or solicitation for the purchase or sale of any financial instrument or as an official confirmation of any transaction. Opinions, estimates and assumptions expressed herein are made as of the date of this communication and are subject to change without notice. This communication has been prepared based upon information, including market prices, data and other information, believed to be reliable; however, Trade Nation does not warrant its completeness or accuracy. All market prices and market data contained in or attached to this communication are indicative and subject to change without notice.

EURUSD failing to close above a key daily highThis is a quick analysis but we are at a key bearish range that may give a double top on the weekly/daily. If this Daily mother candle abides by Candle Range Theory mechanics, we will see it's low taken out.
We'll see 🎯

EURUSD(20250606) Today's AnalysisMarket news:
The European Central Bank cut three key interest rates by 25 basis points. Lagarde hinted that the rate cut cycle will end, and the market is no longer fully pricing in another 25 basis point rate cut this year.
Technical analysis:
Today's buying and selling boundaries:
1.1447
Support and resistance levels
1.1537
1.1503
1.1481
1.1412
1.1391
1.1357
Trading strategy:
If the price breaks through 1.1447, consider buying, and the first target price is 1.1481
If the price breaks through 1.1412, consider selling, and the first target price is 1.1391

EURUSD Sell Trade IdeaDaily OHLC Concept + Breaker & OB + Fibonacci premium level retracement and liquidity sweep.
B+ Setup

Bearish outlook After previous liquidity taken into a bearish rejection area , I would love to see algorithm head lower for liquidity

EUR/USD Bearish Reversal Setup Analysis EUR/USD Bearish Reversal Setup Analysis 🧠💼
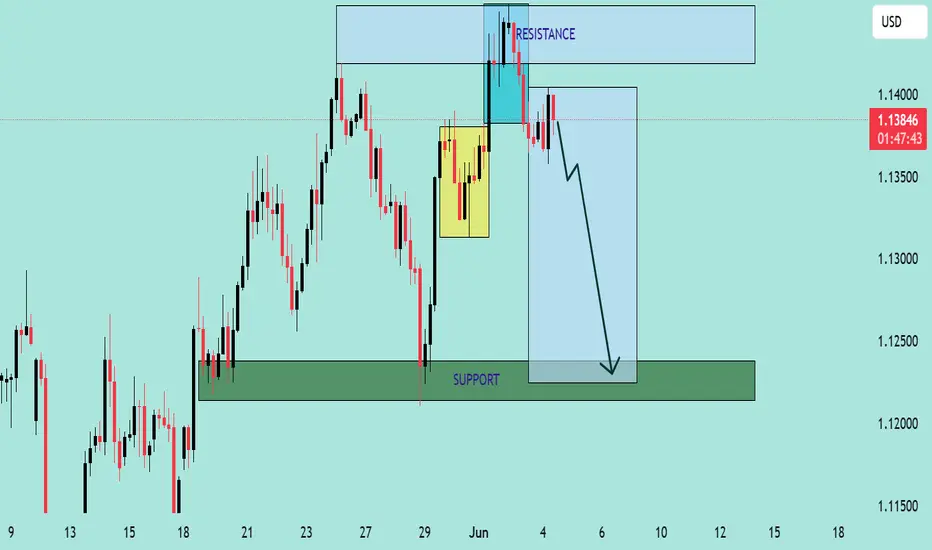
The chart presents a clear bearish outlook on EUR/USD, with well-defined resistance and support zones, along with a projected short-term price trajectory. Here's a professional breakdown:
🔍 Key Technical Highlights
🔵 Resistance Zone (~1.1400 - 1.1430)
Price recently tested this resistance area and formed multiple wicks, signaling strong seller presence.
A bullish liquidity grab is evident in the highlighted cyan box, suggesting a fake breakout before reversal.
🟡 Supply Zone / Order Block
The yellow box marks a previous consolidation area (potential order block), which was revisited and rejected — reinforcing bearish intent.
🔽 Current Price Action
Price is trading around 1.1378, having broken structure and failed to maintain momentum above the resistance.
Sharp rejections and bearish engulfing candles imply strong selling pressure.
🟢 Support Zone (~1.1230 - 1.1260)
This is a previous demand area where price rallied strongly.
The large blue projection box and arrow suggest a bearish continuation targeting this support region.
📉 Bias: Bearish
Structure: Lower highs forming after liquidity grab.
Price Action: Bearish engulfing after resistance rejection.
Market Sentiment: Sellers appear in control after failing bullish breakout attempt.
🎯 Trade Idea
Entry: After confirmed rejection from resistance (~1.1370–1.1385)
TP: Around 1.1240 (support zone)
SL: Above recent highs (~1.1420)
Risk/Reward: Favorable R:R as the setup targets a large swing down.
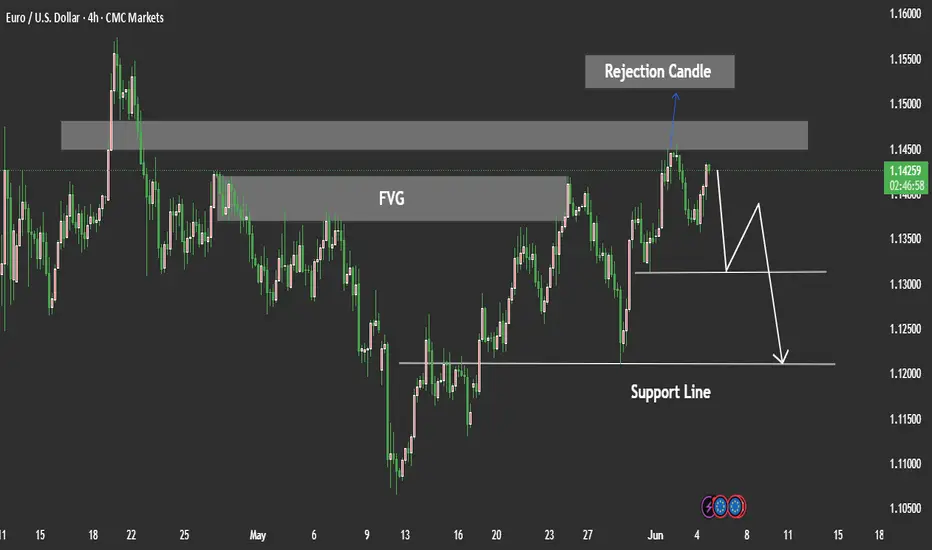
EURUSD Decline Potential Bearish StructureEUR/USD appears to have formed a rejection from a key resistance zone, suggesting a potential move to the downside. The rejection aligns with a 4H Fair Value Gap (FVG) acting as supply A liquidity sweep above recent highs Evidence of pending structure formation, indicating possible internal weakness.
If we see a confirmed close below the marked support zone, this would likely validate a bearish market structure break, paving the way for a clean continuation of the downtrend.
Traders look our idea every day we will share better experience with you we need support from you Guys Thanks For Supporting.
My Send Example of EURUSDHi Dear Mehdi,
This is my second example for Buy Position,
Check it out and let me know your Idea.
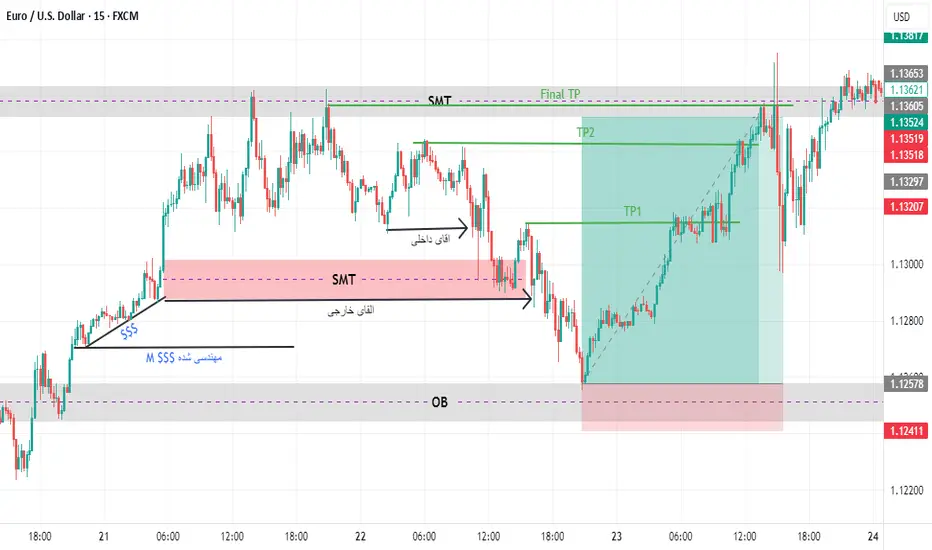
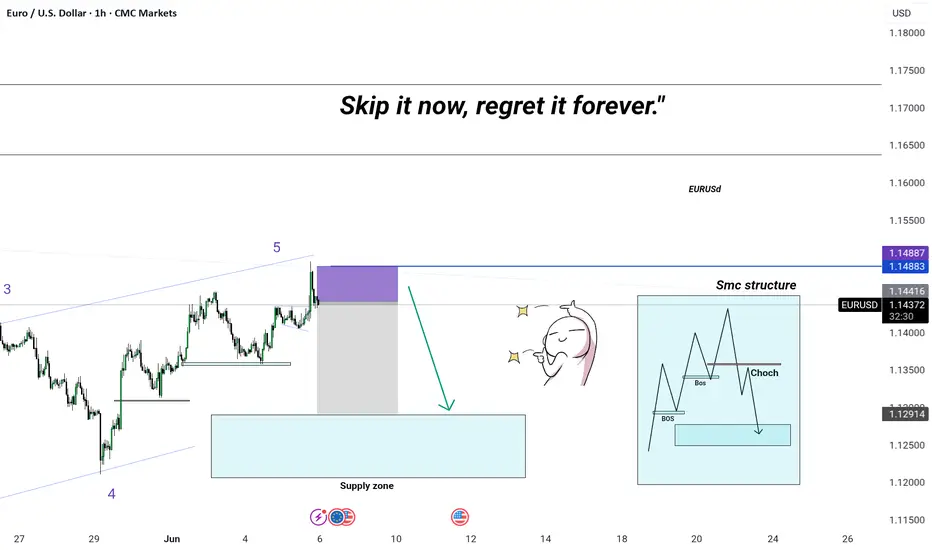
SMC traders know what's next. Wave 5 completed — tapped into premium supply zone
💧 Liquidity swept from previous highs
🔁 Break of Structure (BoS) confirmed
⚠️ Change of Character (ChoCH) forming — bearish intent showing
🧠 Smart Money preparing distribution
📉 Price expected to mitigate into the demand zone below
🕒 Timing is everything — miss this, and you’ll regret it later
THOUGHTS ON EUR/USDEUR/USD 30M - As you can see I am wanting price to trade us down and into the Demand Zone I have marked out for us below. In doing so I am expecting Demand to be introduced and for Supply to be removed.
Due to this happening we can expect a reversal in price, this is because the Demand will begin to outweigh the Supply in the market and we should see price begin appreciating, giving us the opportunity to buy into the next impulsive wave.
We get confirmation of this by waiting for price to trade down and into this area, once it has and the change in hands has taken place, we will expect an influx in value and we should see a relevant protected high break. This gives us the confirmation we need.
Once we have that its then a case of waiting for price to trade us back down initially giving us the opportunity to get involved in this market with a more refined entry, allowing a better risk to reward ratio on the trade we place.

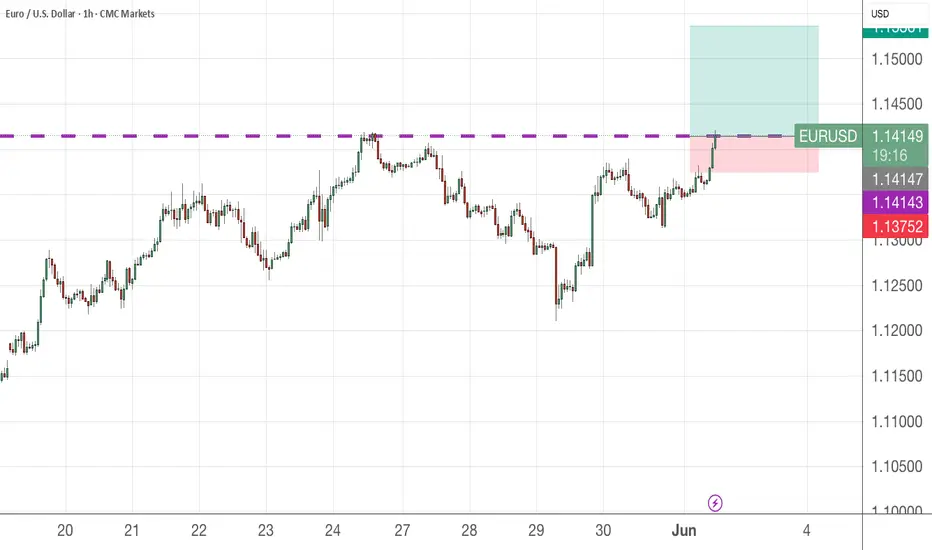
eurusd to the moonnothing is really indicating that eurusd will go down. the news tomorrow would throw it down but thats too much time. its likely that eurusd will return to the previous resistance of 1.14500 as it turns the current area its at from resistance to support. the news will determine if eurusd pushes 1.14500 or gets rejected. please follow because im trying to get popularity points

EURUSD: Will Go Up! Long!
My dear friends,
Today we will analyse EURUSD together☺️
The recent price action suggests a shift in mid-term momentum. A break above the current local range around 1.14403 will confirm the new direction upwards with the target being the next key level of 1.14764 and a reconvened placement of a stop-loss beyond the range.
❤️Sending you lots of Love and Hugs❤️

One-hour technical analysis EURUSDOn the 1hour timeframe, after breaking through both major and minor resistance levels, the price has pulled back downward to gather liquidity and has now reached a high-potential buying zone. Therefore, in the short term, once we observe a structural shift on lower timeframes (such as the 5-minute chart), we can consider buying with a target at the previous price high (resistance).
