BUY EUR/USD Intraday/SwingEUR/USD – Demand Zone Reversal Setup (15-Min)
Timeframe: 15-Minute (Short-Term Intraday)
Trade Type: Demand Zone Reversal / Trend Alignment
Risk/Reward Ratio: 2.13
📍 Trade Setup Overview
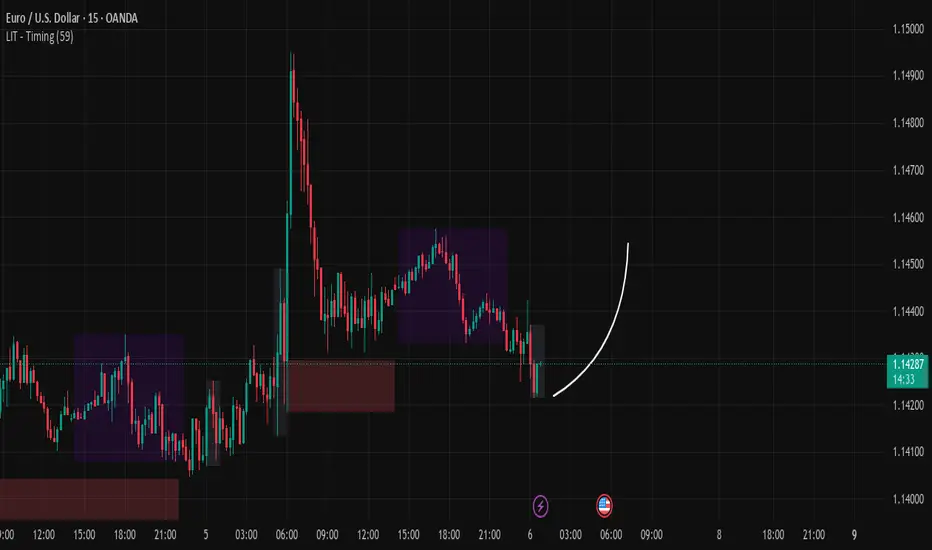
Entry: 1.14255 (Current Market Price)
Stop Loss: 1.14099
Take Profit: 1.14547
Risk: ~14.3 pips (~0.13%)
Reward: ~30.5 pips (~0.27%)
This setup targets a rebound from a validated demand zone with clean structural confluence and early momentum signals.
🔍 Technical Breakdown
🧱 Structure & Trend Context:
Microtrend (M15): Recent corrective pullback following a strong bullish impulse.
Trendline: A descending short-term trendline is nearing a break, suggesting momentum shift in favor of bulls.
Demand Zone: Validated by the Order Block Detector, the 1.1409–1.1420 area has already proven to absorb sell-side pressure during past tests.
📈 Momentum Indicators:
RSI (14): Currently ~46 and curling up — potential bullish divergence building.
MACD (12,26): Histogram showing exhaustion of bearish momentum. Signal lines are converging — early signs of crossover.
EURUSD_W trade ideas

Euro ShortEUR/USD short position. Break out not ready yet. Expecting a retracement back to the demand zone. Low Stop loss of 50 pips. Do your own research.

EURUSD -Long -1.1677EURUSD has shown the potential to move towards the levels of 1.1677.
The Pair can test the levels of 1.1175 or even 1.1050 to bounce back.

ECB Cuts Rates. EUR/USD Spikes to 1.5-Month HighECB Cuts Rates. EUR/USD Spikes to 1.5-Month High
Yesterday, as widely expected, the European Central Bank (ECB) cut interest rates for the eighth time since May 2024. According to ForexFactory, the main refinancing rate was lowered from 2.40% to 2.15% (having stood at 4.50% in May 2024).
According to Reuters:
→ ECB President Christine Lagarde stated that interest rates are now at a “good level”, despite the extremely high uncertainty caused by tariff threats from President Donald Trump.
→ Following the press conference, markets interpreted the message as a sign that the ECB is unlikely to cut rates again at its next meeting in July.
In response to the ECB's decision, the EUR/USD rate jumped to its highest level in a month and a half, but later retreated (as indicated by the arrow) back to previous levels.
Technical Analysis of the EUR/USD Chart
Four days ago, while analysing the EUR/USD chart, we:
→ drew an ascending channel;
→ suggested that bullish momentum could push the EUR/USD rate up to the psychological level of 1.1500 during the current week.
In fact, at yesterday’s peak, the rate came very close to 1.1500. However, a candlestick with a long upper shadow had formed on the EUR/USD chart, by the end of the day. Additionally, this morning, the 1.1450 level has acted as a resistance zone.
This suggests bearish activity, which could pull the rate down towards the lower boundary of the local channel (outlined in black), and possibly even attempt a breakout below it.
This article represents the opinion of the Companies operating under the FXOpen brand only. It is not to be construed as an offer, solicitation, or recommendation with respect to products and services provided by the Companies operating under the FXOpen brand, nor is it to be considered financial advice.

correctionIt is expected that we will see price fluctuation within the current support line, then there is a possibility of a trend change and the start of an uptrend. If the price breaks through the support line, the downtrend will continue to the next support line.

EU potential buyPrice came lower and took out Asia low. Frankfurt only pushed price lower and London open has a mitigation while also inducing structure. Might be able to see Asia high get taken out.
EURUSD - hourly chartTrading idea:
Short to 1.1406 but risk is to high because it could reverse to the 1.1457 very sharp!
Support and resistance:
🔴 Resistance Levels:
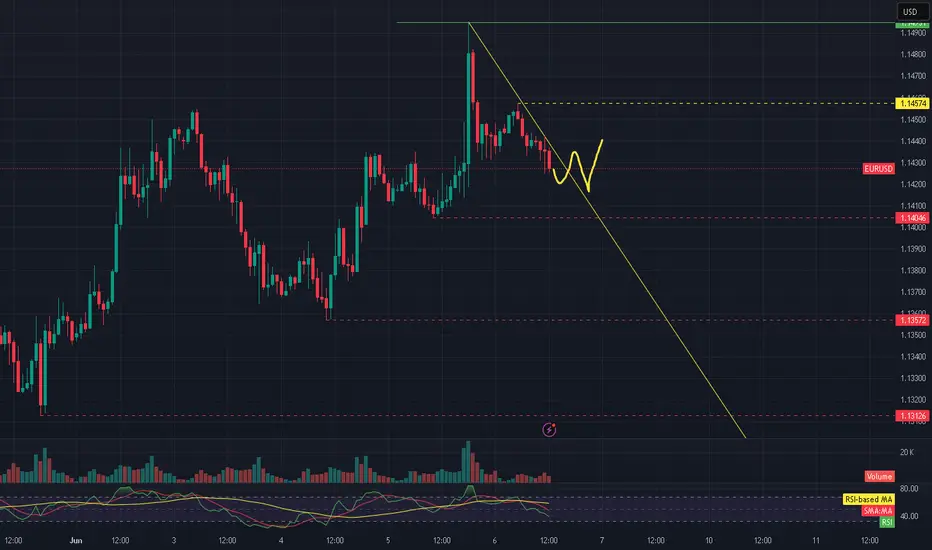
1.14574 — the nearest key resistance level; a previous top and potential barrier for further upward movement.
1.14900 — the upper boundary of the current range; serves as a target if the price breaks above resistance.
🟡 Support Levels:
1.14046 — local support level, coinciding with a previously broken resistance zone; may act as a bounce point.
1.13572 — important support level that previously held back further downside movement.
1.13126 — major support level from which a strong bullish impulse previously started.
🔍 Additional Notes:
Price is currently testing a descending trendline and may form a local consolidation in the 1.142–1.145 area, with a possible breakout attempt.
RSI is pointing downward but still above the oversold zone — no strong reversal signal yet.
Volume has decreased, which may indicate accumulation before the next impulse move.
EUR/USD Outlook – NFP Friday Flow & Liquidity Watch (ARX BreakdoEven though I don't trade NFP days, I always watch how the market behaves especially around key liquidity zones.
In this video, I break down what I expect from EUR/USD today using the ARX method:
• External & internal range liquidity
• Price flow around key zones
• Trap potential before major sessions
• Patience > prediction, even on high-impact days
🎯 This is for observation and structure-building execution always follows discipline.

Third Position in Long PositionHi Dear Mehdi.
This is the third example for this kind of positioning in long waves.
Is it right ?
my idea abut EURUSDHi
This is my idea about EURUSD for the future of it with my strategy/
Please check it
Thanks Mehdi

Market next target 🧨 Disruption Points:
1. Overbought Condition / RSI Divergence
Even though the price is surging (+3.30%), there could be an overbought condition forming.
If RSI or other momentum indicators (not shown here) diverge, it might signal weakness in bullish momentum.
> Disruptive idea: Price may fake the breakout (blue arrow) and then sharply reverse, trapping late buyers.
---
2. False Breakout Trap
The red-box area could be a liquidity zone where smart money might induce a fake breakout before dumping.
> Alternative path: Price breaks above temporarily (as in blue path), but then reverses violently back into the range, forming a “bull trap.”
---
3. Volume Anomaly
The volume appears to be decreasing on recent bullish candles after the initial spike.
This suggests that the uptrend may be losing strength, making the yellow arrow scenario less likely.
> Contrary outlook: Lack of volume confirmation could mean a sideways consolidation or reversal is more probable.
---
4. News/Event Risk (Fundamental Disruption)
The chart shows an upcoming economic event (U.S. flag icon), possibly Non-Farm Payrolls (NFP), interest rate news, or CPI.
These events could cause extreme volatility and invalidate all technical patterns.

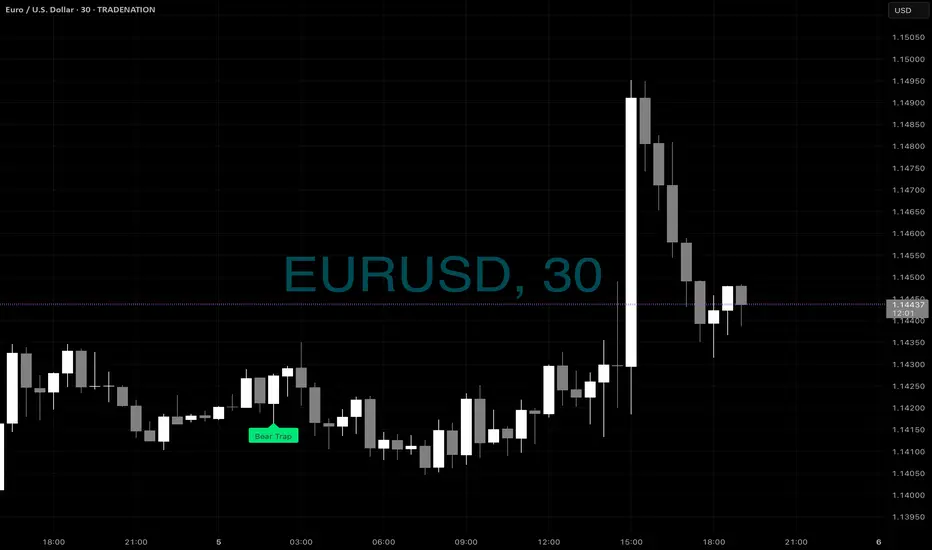
TRAP Warning - EU BuysHere is another example of the Bear Trap Warning - meaning you would only want to look for buy setups after that using your own way of finding entries - be it with SMA’s or RSI or what ever - this is just to keep you on the right side of the coming moves
EURUSD(20250605) Today's AnalysisMarket news:
U.S. economic data-① ADP employment increased by 37,000 in May, far below the expected 110,000 and the previous value of 62,000. ② The U.S. ISM non-manufacturing index in May fell to 49.9, shrinking for the first time in nearly a year, and the expected increase was from 51.6 to 52.
Technical analysis:
Today's buying and selling boundaries:
1.1401
Support and resistance levels:
1.1478
1.1449
1.1431
1.1372
1.1353
1.1324
Trading strategy:
If the price breaks through 1.1431, consider buying, and the first target price is 1.1449
If the price breaks through 1.1401, consider selling, and the first target price is 1.1372

EURUSD | Harmonics ABCDEURUSD is in bullish trend and printing a perfect ABCD pattern,which indicates that it is moving upwards towards potential reversal zone At point D

Aligning With DXY EU is going to be Bearish Day Wednesday.This is My View Analyzing Current Order Flow and Higher Time Frame FVG .. Hybrid ICT. Keep your Eagle Eye on this Chart. I am Bullish On DXY. Today .

EUR/USD Bullish Breakout from Key Demand ZoneStrong bullish reaction from a well-defined demand zone ('zona buy') on EUR/USD. Price broke above resistance with momentum, confirming buyer interest. The RSI shows bullish strength, supporting further upside potential. Watching for continuation towards the 1.1578 target while managing risk below 1.1399 support.

Market next move 🔍 Disruptive Counter-Analysis
1. False Breakout Risk
The current breakout could be a bull trap. Price may break above the resistance level temporarily before reversing sharply.
Volume Analysis: The volume isn't significantly higher at the breakout candle, which may suggest a lack of strong momentum or institutional participation.
2. Resistance Zone Ahead
The 1.14500 to 1.15000 range is historically a supply zone, where sellers may aggressively enter the market.
This makes any upside move vulnerable to a reversal near that zone.
3. Macroeconomic Risk
A red-circled economic event icon appears on the chart (likely an ECB or Fed-related release). This adds uncertainty—news can invalidate technical patterns.
If the event is bearish for the euro (e.g., weak data or dovish ECB comments), the pair could reverse sharply.
4. Overbought Short-Term
A series of green candles without significant pullback suggests short-term overbought conditions.
RSI or other momentum indicators (not shown here) may confirm this. A correction to the previous base is possible.

EURUSD BUY IN NOTICE. I just went live with you all, entering a buy position in EURUSD during an important news release. Actually, it was two buy entries, and I managed them really well.
In the first entry, we reached a 1.3% gain, although I couldn’t close it completely. In the second entry, the price hit exactly the point I mentioned it would likely reach during the news event. I’m managing both entries carefully, and at this moment, I already have a significant percentage in profit.
This is how live trading works — with discipline, management, and solid analysis!

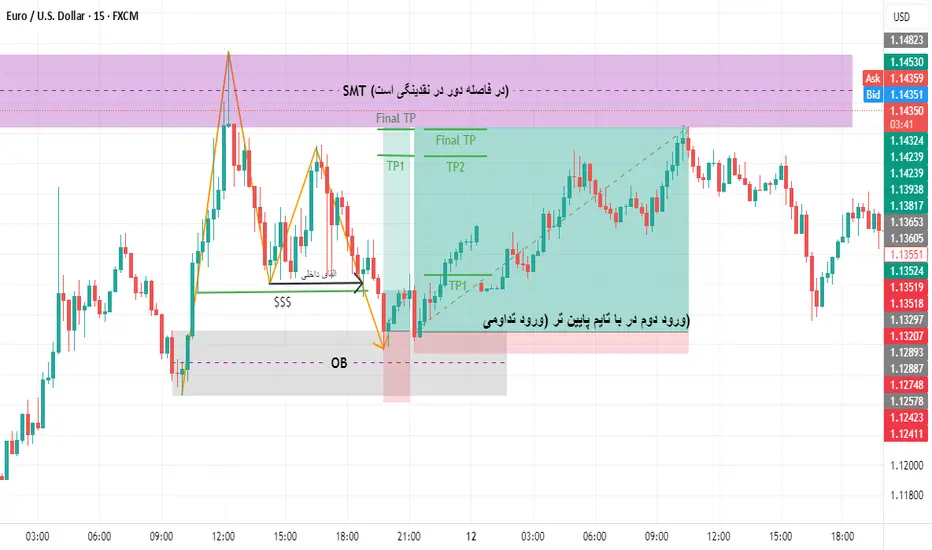
EUR/USD 4H: Bullish Mode - Structure & Key LevelsMarket Context & Structure:
Price initiated a strong bullish impulse from the low at 1.08856 and peaking at 1.15733.
Following this, a corrective phase occurred. The 'MSS' (Market Structure Shift) indicates a return to bullish momentum, breaking the internal bearish structure of the pullback.
Key Levels:
• Resistance (1.15733): The previous swing high and a significant supply zone. The $' above it suggests liquidity targets.
• Support (around 1.1350): The immediate demand zone where buyers are currently active.
• Mitigated Zone (around 1.1250): A previously tested and "filled" demand level, offering potential strong support if retested.
• Fib Retracement Zone (0.618 at 1.11475 to 0.71 at 1.10841): This "sweet spot" for healthy retracements was successfully respected, initiating the current rally. It represents deep, yet still healthy, demand.
Current Outlook:
EUR/USD is clearly in a bullish posture. Price has established higher lows post-MSS and is currently finding support.
Potential Scenario:
We anticipate price to continue its ascent, targeting the primary 'Resistance' zone at 1.15733. A decisive break here would confirm strong bullish continuation.
Invalidation:
The bullish bias would be questioned on a sustained break below the immediate 'Support' zone and fully invalidated with a clear break below the 'Fib Retracement Zone' (below 1.10841).
________________________________________
Disclaimer:
The information provided in this chart is for educational and informational purposes only and should not be considered as investment advice. Trading and investing involve substantial risk and are not suitable for every investor. You should carefully consider your financial situation and consult with a financial advisor before making any investment decisions. The creator of this chart does not guarantee any specific outcome or profit and is not responsible for any losses incurred as a result of using this information. Past performance is not indicative of future results. Use this information at your own risk. This chart has been created for my own improvement in Trading and Investment Analysis. Please do your own analysis before any investments.

Mr. Wave Says... It’s Time for the Last Push!”[ b] EUR/USD is forming a clean Elliott Wave structure — and guess what?
We’re at Wave 4 consolidation, and Wave 5 is about to explode upward!
🔍 Here's what we're seeing:
✅ Wave 1 to 3 already confirmed with solid impulse
✅ Wave 4 found support near previous breakout zone
🎯 Target: Upper supply zone where Wave 5 is likely to terminate
🔔 This isn’t the time to sleep on the charts. Mr. Wave is literally pointing to the target zone — and we’re not ignoring it. 😉
---
🧠 Pro tip:
Use tight risk management, ride the final push of the motive wave, and watch for reversal signals in the supply zone.
---
📌 #GreenFireForex #ElliottWave #Wave5 #ForexTrading #TechnicalAnalysis #EURUSDSetup #ForexReel #WaveTheory #SupplyZone #ForexSignal #SmartTrading


EURUSD FORECAST FY25 TIDES TURNINGi dont usually do forex unless its big yields like this the concerning kind
im bearish on dxy so im going to take the time to call out what i see
i believe the us is in over its head and might jus transition to crypto as their legal tender
to save themselves
global de dollarisation sentiment (geopolitical tensions and sanctions have proven how dollar can be a liability)
national debt cant keep playing jenga with that
inflation might just respike with how they want to print more while cutting interest rates
while still not having dropped it to the 2% target
nations like japan suffered from the covid stimulus nobody will repeat that mistake they will divert their dollar assets into something else like gold not enough tho maybe euros id need to research into their holdings but i wont be suprised if nations dropping dollar instruments its all just strategic for economic resilience looking out for number 1
japan is a loco one they shot rates up 17% from nowhere bro spontaneous

EURUSD Volatility Alert - ECB Rate Decision/US Non-farm PayrollsEURUSD has experienced a choppy start to the week so far. Initially trading from opening levels around 1.1345 up to a 6-week high of 1.1455 early Tuesday morning, before running into profit taking and then bouncing between these two levels in response to various drivers, including updates on US/China trade discussions, Eurozone inflation, US economy ,and constantly changing interest rate differentials.
Looking forward, there may be potential for this type of price action to continue over the next two trading days, as traders first digest the ECB interest rate decision, which is released at 1315 BST later today, then the comments of ECB President Lagarde in the press conference that commences at 1345 BST.
A 25bps (0.25%) interest rate cut from the ECB is fully anticipated, so is unlikely to cause much of a stir. However, comments from Madame Lagarde in the press conference could lead to volatile EURUSD price action, depending on if she outlines whether policymakers remain open to further cuts, as Eurozone inflation (May CPI 1.9% YoY) moves below the central bank’s 2% target, or if now is the time for a pause to assess the potential impact of US tariffs and future European defence/infrastructure spending.
On Friday, the dollar side of the EURUSD currency pair, could be impacted significantly by the outcome of the latest update on the US labour market in the form of the US Non-farm Payrolls release at 1330 BST.
Data out earlier in the week has so far offered a mixed assessment of the US labour market during the on-going trade tariff uncertainty. However this payrolls update is the one that usually grabs the attention of traders and investors and probably holds more significance.
Their focus is likely to be on the direction of the unemployment rate (currently 4.2%) and average hourly earnings, where any large deviation from market expectations may see EURUSD volatility increase into the weekend, especially if it indicates a weakness in the US economy.
Technical Update:
Today’s ECB announcement, followed by payrolls on Friday, has the potential to be the next important EURUSD sentiment driver, with the reaction to these events possibly offering clues to the next path for price activity.
It has already been an impressive recovery in EURUSD since the May 12th session low at 1.1065, a move that has now seen closing breaks above resistance at 1.1425, which is equal to the April 28th last recovery failure high.
However, as we approach the ECB decision and payrolls release, what are the potential support and resistance levels traders may be watching?
Potential Resistance Levels:
Price strength so far this week has been capped by sellers at 1.1455 on June 3rd. As such, this level represents a first possible resistance focus, as having found sellers at this point previously, they may be found again.
While breaks above the 1.1455 high will not guarantee continued price strength, it could open potential for an upside push in price towards the April 21st high 1.1573, possibly further, if this were to give way on a closing basis.
Potential Support Levels:
After a period of price strength, such as that seen since the May 12th low, it is potentially the 38% Fibonacci retracement of the upside move, which in EURUSD stands at 1.1306, that may be viewed as a first support.
As such, if breaks below 1.1306 are seen over coming sessions, it may lead to a deeper decline in price towards 1.1214, which is the 61.8% Fibonacci retracement, possibly further.
The material provided here has not been prepared in accordance with legal requirements designed to promote the independence of investment research and as such is considered to be a marketing communication. Whilst it is not subject to any prohibition on dealing ahead of the dissemination of investment research, we will not seek to take any advantage before providing it to our clients.
Pepperstone doesn’t represent that the material provided here is accurate, current or complete, and therefore shouldn’t be relied upon as such. The information, whether from a third party or not, isn’t to be considered as a recommendation; or an offer to buy or sell; or the solicitation of an offer to buy or sell any security, financial product or instrument; or to participate in any particular trading strategy. It does not take into account readers’ financial situation or investment objectives. We advise any readers of this content to seek their own advice. Without the approval of Pepperstone, reproduction or redistribution of this information isn’t permitted.
