EURUSD swing long idea on 1HOn EURUSD we are currently in up trend market on Daily and all time frames bellow. On 1H we can see 3 moving averages that points to upside and give us more probability to price move higher. We need to buy at lowest price. We want first supportive area touch and then on lower time frame wait to price change direction from bear to bull. Have a nice day!
EURUSD_W trade ideas

Fundamental Market Analysis for June 5, 2025 EURUSDThe EUR/USD pair is trading cautiously, slightly above the key level of 1.14000 during Thursday's Asian trading session. The major currency pair is expected to remain in a sideways trend as investors await the European Central Bank's (ECB) interest rate decision.
The ECB is almost certain to cut its key lending rates by 25 basis points (bps), bringing the deposit rate and the main refinancing rate to 2% and 2.15%, respectively. This will be the ECB's seventh consecutive interest rate cut and the eighth since June last year, when it began its cycle of monetary expansion.
Traders are increasingly confident of a seventh consecutive ECB interest rate cut as deflationary trends persist in the eurozone. Preliminary data from the eurozone's harmonized index of consumer prices (HICP) released on Tuesday showed that inflationary pressure fell below the central bank's 2% target.
With the Fed widely expected to cut interest rates, investors will be watching ECB President Christine Lagarde's press conference closely for clues on likely monetary policy in the second half of the year. Market participants would also like to hear about the progress of trade negotiations with the US.
Meanwhile, the US dollar (USD) is struggling to stay near a six-week low as weak US data has reignited stagflation risks. The ISM Services PMI unexpectedly declined in May, while its components showed that production costs continue to rise rapidly. ADP employment change data, which reflects labor demand in the private sector, showed that 37,000 new jobs were created in May, the lowest figure since February 2021.
Trading recommendation: SELL 1.14100, SL 1.14400, TP 1.13600

EURO/USD significant price move or breakout.1. Support and Supply Zones:
SUPPORT zone is marked in green at the bottom, around the 1.0400–1.0600 level.
SUPPLY zone is labeled and marked slightly above the March price action (mid-chart).
2. CHoCH (Change of Character):
Marked on the chart to indicate a potential trend reversal or significant shift in market sentiment (typically when a previous high/low is broken in the opposite direction).
3. NE (New Entry or New Expansion):
Marked near a price peak, possibly indicating a significant price move or breakout.
4. Channel:
A bullish ascending channel is drawn where the price was moving upward within parallel trendlines.
5. Projected Movement:
A forecast is shown with an arrow pointing upward inside a green and red box:
Green area = Target/Profit zone
Red area = Stop loss zone
The forecast suggests a bullish move after a potential consolidation.
6. Date/Time:
X-axis ends in June and shows historical price movement from early 2025 (around January–April).
Current chart time (bottom right) is 04:51:38 UTC.
Trading Sentiment
The chart indicates a bullish sentiment on EUR/USD, expecting price to:
Hold above the support
Break or continue through CHoCH
Possibly reach the target zone near 1.1600–1.1800

Profit Target/Reverse on EUR/USDOld volume accumulation from April about to be approached at 11463 area. This area should be a natural resistance and a good take profit on buy trades.

Can it stabilize above 1.14?The euro against the US dollar traded in a narrow range during the North American session, with the current exchange rate consolidating near the 1.14 level as the market awaits the European Central Bank's (ECB) interest rate decision this Thursday.
In the US, the ADP employment data far missed expectations, with private sector employment increasing by only 37,000 in May—significantly below the market forecast of 115,000. This weak data triggered a decline in the US dollar, pushing the EUR/USD exchange rate to rebound to the 1.1400 zone. While the exchange rate is expected to continue its rebound momentum, its upside potential remains limited. If the key resistance level of 1.1418 is effectively broken, it could open the door for further upward movement to the 1.1450-1.1480 range.
Humans need to breathe, and perfect trading is like breathing—maintaining flexibility without needing to trade every market swing. The secret to profitable trading lies in implementing simple rules: repeating simple tasks consistently and enforcing them strictly over the long term.

POST NEWS (EUR/USD) 6/4/2025eur news post trading as it hit the upper price we open a long trade ...
.
.
.
Private sector hiring rose by just 37,000 in May, the lowest in more than two years, ADP says
personal views news much negative for usd soo it aligned with the setup we have ...
.
.
.
. good luck !

EURUSD is moving within the 1.13230 - 1.14550 range👉🏼Possible scenario:
The euro (EUR) dropped 0.64% vs. the U.S. dollar (USD) on June 3 after eurozone inflation missed estimates, rising just 1.9% YoY in May vs. the expected 2%. The softer print boosted bets on a 25 bps ECB rate cut this week, likely the last before a pause. The OECD also cut its global growth forecast, citing rising trade tensions and inflation risks. It now sees GDP slowing from 3.3% in 2024 to 2.9% by 2026.
On June 4, EURUSD held steady in early trading. Attention shifts to key U.S. data: ADP Employment (12:15 p.m. UTC) and ISM Services PMI (2:00 p.m. UTC). Strong results may pressure EURUSD lower; weak numbers could push it toward 1.1450.
✅Support and Resistance Levels
Now, the support level is located at 1.13230
Resistance level is located at 1.14550

PROJECTED PRICE ACTION Price is bullish in 4hrs timeframe and 1hr timeframe; it is expected that if bullishness is expected to continue price will move in for liquidity before moving to the highs.


Market Analysis: EUR/USD Trims GainsMarket Analysis: EUR/USD Trims Gains
EUR/USD started a downside correction from the 1.1450 resistance.
Important Takeaways for EUR/USD Analysis Today
- The Euro struggled to clear the 1.1450 resistance and declined against the US Dollar.
- There was a break below a key bullish trend line with support at 1.1395 on the hourly chart of EUR/USD at FXOpen.
EUR/USD Technical Analysis
On the hourly chart of EUR/USD at FXOpen, the pair gained pace for a move above the 1.1300 zone, as mentioned in the previous analysis. The Euro tested the 1.1450 resistance and recently corrected gains against the US Dollar.
The pair dipped below 1.1400. There was a break below a key bullish trend line with support at 1.1395. It even traded below the 23.6% Fib retracement level of the upward move from the 1.1209 swing low to the 1.1454 high.
The pair is showing some bearish signs, and upside potential might remain limited. Immediate resistance is near the 50-hour simple moving average at 1.1395.
The next major resistance is near the 1.1450 zone. An upside break above the 1.1450 level might send the pair toward the 1.1500 resistance. Any more gains might open the doors for a move toward the 1.1550 level.
On the downside, immediate support on the EUR/USD chart is seen near the 50% Fib retracement level of the upward move from the 1.1209 swing low to the 1.1454 high at 1.1330. The next major support is near the 1.1300 level. A downside break below the 1.1300 support could send the pair toward the 1.1210 level.
This article represents the opinion of the Companies operating under the FXOpen brand only. It is not to be construed as an offer, solicitation, or recommendation with respect to products and services provided by the Companies operating under the FXOpen brand, nor is it to be considered financial advice.

EURUSD IDEAHere chart has been analysed and some trading ideas have been placed .
the trades shown are not confirmed trade .
only take trade after confirmation or when i told to take trade in the comment .
wait for the price action to come to our zone and form the structure we hoped for.
Please subscribe and follow to support me . thank you !
EURUSD – June 4, 2025Yesterday saw a deeper-than-expected pullback after price broke above the 1.14149 zone.
Despite the retrace, structure remains bullish with price staying inside the ascending 4H channel.
We’re now reapproaching 1.14149 again — a critical level for direction.
To play it safe, I will only look for buys above yesterday’s high at 1.14443.
Overall target remains 1.16020 and 1.18791 short to mid-term.
Key Buy Zones:
Safe Buys: Above 1.14443
Next target: 1.16020
Long-term target: 1.18791
⚠️ Staying flat if 1.14149 fails.

Euro-dollar might retreat depending on dataThe euro reversed most of Monday’s gains against the dollar after slightly weaker flash inflation than expected at 1.9%, raising further expectations of a single cut by the ECB on 5 June. The ECB’s press conference might give some clues on how the bank perceives potential downside risks to inflation later this year. Friday’s NFP is a key release in the context of a generally resilient job market over the last few months.
The medium-term uptrend on the daily chart seems to be quite mature and volume has dropped significantly compared to the first half of April while the price has remained overbought or close to it from the slow stochastic, so the probability of euro-dollar declining or settling into a sideways trend seems to be higher now. That depends on upcoming news, though. If the ECB seems more hawkish and the NFP is significantly disappointing, there might be another round of gains.
$1.15 is the main area of resistance in focus as April’s highs and just above the 50% monthly Fibonacci retracement. $1.10 will probably be a strong support but before that the interaction of the 50 SMA from Bands and the 61.8% monthly Fibo might challenge further losses. It’s important to monitor the initial reactions to both the ECB and the NFP for a better idea about ongoing direction.
This is my personal opinion, not the opinion of Exness. This is not a recommendation to trade.


EURUSD — Daily & 4H TimeframesThe correction continues on EURUSD.
Both the daily and 4H timeframes show sideways ranges, with seller initiative in control. The boundaries of the sideways ranges are marked with black lines.
However, sellers appear weak — the price has been stuck for several hours inside a buyer attack bar near the upper boundary of the range. Now, sellers are attempting to absorb this buyer bar.
If considering long setups, it's safer to look for patterns near the daily level of 1.13126, or from the lower boundary of the 4H range.
Another option is to wait for a confirmed breakout above the range.
Searching for buys in the upper part of the current range is risky.
This analysis is based on the Initiative Analysis concept (IA).
Wishing you profitable trades!

Euro Pulls Back – Eyes on ECB and Tariff TurmoilCMCMARKETS:EURUSD FX:EURUSD EUR/USD pulled back from a six-week high of 1.1454 to trade near 1.1379, down 0.52% on Tuesday, as strong U.S. labor market data and revived trade tensions lifted the dollar. April JOLTS job openings rose to 7.39M, beating expectations, signaling a resilient U.S. economy despite a 3.7% drop in factory orders.
In parallel, Trump’s announcement to double tariffs on steel and aluminum has reignited trade war concerns. Markets are also watching for a potential Trump–Xi call later this week.
Meanwhile, the Euro lost ground after May HICP inflation in the Eurozone fell to 1.9%, below the ECB’s 2% target. With core inflation slowing as well, markets have priced in a 25 bps rate cut at Thursday’s ECB meeting.
Technically, OANDA:EURUSD EUR/USD is still trading within a rising channel but rejected key minor resistance zone just below the descending trendline. A confirmed breakout above this area could open the path toward monthly resistance near 1.1559. On the downside, Support Zone 1 (around 1.1375) must hold to maintain the bullish bias; further weakness may expose Support Zone 2 (around 1.1338)
Resistance : 1.1445 , 1.1559
Support : 1.1375 , 1.1338

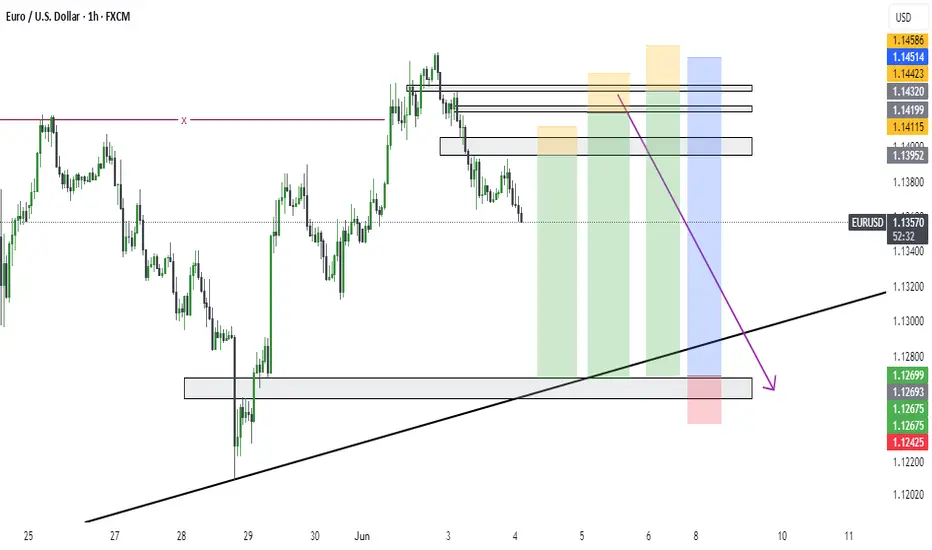
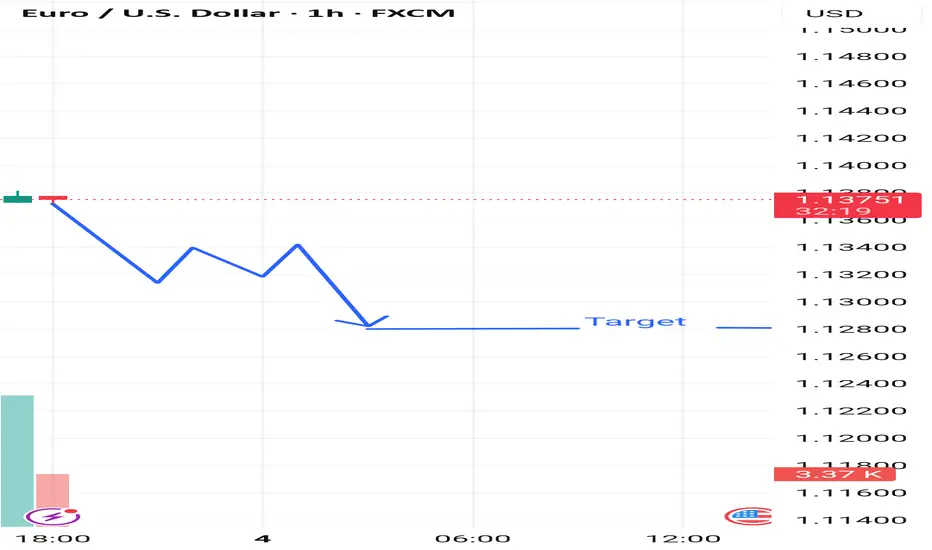
Market next move Disruption of the Downtrend Analysis
The chart currently suggests a bearish breakout with a downside target near 1.12900. Let’s challenge that:
---
🟩 Bullish Reversal Possibility
1. Support Zone Near 1.1370:
Price has shown signs of stabilizing around the 1.1370 level.
Multiple wicks below the candles suggest buyer interest at this level.
2. Low Volume on Recent Red Candles:
A decreasing volume trend on recent red candles can indicate weak bearish momentum.
Bulls may be waiting to enter on a breakout above the 1.1380–1.1390 zone.
3. Potential for Fakeout:
The sharp expected drop might be a bear trap.
If price breaks back above 1.1385 with strong volume, it could invalidate the bearish thesis.
4. RSI/Momentum Divergence (Assumed):
If momentum indicators (not shown) display bullish divergence, this strengthens the case for a reversal
EURUSD Broke support currently retesting target around 1.5-1.51Strong bullish trend: Price has broken above a previous key resistance (~1.1418), which is now acting as support.Bullish breakout structure: Market is making higher highs and higher lows.

EURUSD H1While we have a wonderful bearish divergence on H4, on H1 we find indications that the price would like to increase a little more, probably expecting a double top, what do you think?

EURUSD is looking for price reactionEURUSD is facing the support zone of 1.138. The price reaction of the buyers is jumping into the market, you think this is a nice BUY signal.
You can set up a BUY signal for the pair towards the target of 1.141 in the short term.
In case the h1 candle closes below 1.138, you have to wait for the next BUY zone around 1.134 to be able to BUY and aim for the original target

EURUSD: Expecting a move up after a quick retracement 📈 EURUSD Outlook:
I'm expecting buyers to step in and push price higher on EURUSD.
The broader trend remains bullish, so we're looking for confirmation before entering.

EUR/USD M15 Support & Resistance Levels🚀 Here are some key zones I've identified on the 15m timeframe.
These zones are based on real-time data analysis performed by a custom software I personally developed.
The tool is designed to scan the market continuously and highlight potential areas of interest based on price action behavior and volume dynamics.
Your feedback is welcome!

EURUSD BREAKDOWN THE BULLISH TREND SELL STRONG WATCH THE LEVELSFX:EURUSD Breakdown Alert
The bulls have lost steam — selling pressure is taking over!
📉 Entry Level: 1.13800
🕒 Timeframe: 30 Min
🔻 Technical Targets:
• 1st Target: 1.13200 – Demand Zone
• 2nd Target: 1.12200 – Major Support
The structure shows clear bearish momentum. Watch for confirmations before entering. Stay sharp and trade smart! 💼💥
👇 Like | 💬 Comment | 🔔 Follow for real-time updates & setups
#Forex #EURUSD #TradingSetup #TechnicalAnalysis #PriceAction #DayTrading
