EUR/USD Rises to 4-Week HighEUR/USD Rises to 4-Week High
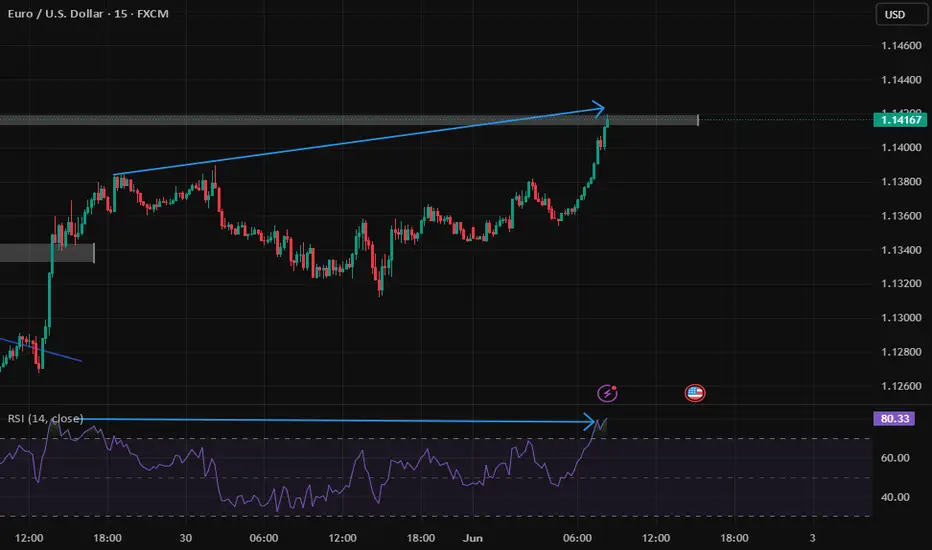
As shown on the EUR/USD chart today, the euro rose to a 4-week high against the US dollar this morning.
The euro's strength relative to the US dollar is supported by traders’ expectations ahead of the ECB's interest rate decision, scheduled for Thursday at 15:15 GMT+3.
This upcoming event is notable not only because the ECB is expected to cut rates from 2.40% to 2.15% (for the seventh consecutive time), but also due to the broader context shaped by ECB President Christine Lagarde’s recent remarks on the euro’s status as a reserve currency.
At the same time, the US dollar is weakening amid growing trade concerns—on Friday, the US President Donald Trump announced plans to double tariffs on steel and aluminum to 50%. He also accused China of breaching the recent trade truce.
Technical Analysis of the EUR/USD Chart
Seven days ago, when analysing the EUR/USD chart, we:
→ observed bullish sentiment;
→ highlighted the importance of the 1.1400 resistance level;
→ suggested that bears might attempt to strike back.
Since then, the price has pulled back from the mentioned level (as indicated by the arrow), but found support at the lower boundary of the ascending channel. The current bullish momentum could push EUR/USD towards the psychological level of 1.1500 during the week ahead.
This article represents the opinion of the Companies operating under the FXOpen brand only. It is not to be construed as an offer, solicitation, or recommendation with respect to products and services provided by the Companies operating under the FXOpen brand, nor is it to be considered financial advice.
EURUSD_W trade ideas

SHORT ON EUR/USDEUR/USD has just swept a previous high and has plenty of liquidity to the downside to capture.
I will be selling EU to the next swing low looking to catch 80-100 pips.

EURUSD Trade Executed June 2 EURUSD Trade Executed
June 2
4 hour chart logic
Last week Price takes sell side Wednesday. Thursday expands to the buy side stepping up from the 70 OTE. Friday was retracement to the 50 level. When price bounced off the 50 in the NY sliver bullet I suspected that we could see higher prices coming into Monday.
Minute chart logic
20:00 Asia expands immediately into a FVG and minor buy side. Admittedly I took a bad short thinking it was going to the equal lows.
*cross referenced DXY after evaluation of the higher time frame range that it would drop to its equal lows, while GBP would also rally to the equal highs
Hunting for an expansion signal
23:20 creates a swing high
23:30 Price swing low and comes back to its opening price of Asia right into a first presented FVG
*Price creates a tiny FVG
*23:55 taps the FVG and takes off
*price goes into a small consolidation
*1:00 price takes off
*1:10 I wanted to enter but froze waited for the next macro
1:50 entered
3:25 exited target of equal highs hit
I really relied on the higher time range that price would seek last Monday’s high to complete the range and for DXY to make its low.
I can see it so clearly on the 1 hour and 4 hour charts price narrative and why ICT coaches to manage bias from here. Hindsight I am desiring to trade the days range and sticking to my bias with understanding the what cycle price is in. EX Friday closes in a consolidation cycle expansion is next. Asia expansion for the win.
To be honest this trade feels like chasing price. Probably cause it is!
To study it feels better than the pips in my account.
*Price was in a premium-rule broken in taken this trade-but narrative was there
*Analysis was built from 4 hour which I m getting used to trusting-narrative was buy side was the target after taking sell side last week
*I expected a pull back from Sundays delivery, did not happen, barely made it to the 50 previous range
*Price pulling back to the 50 on Friday was key to a expansion buy today
4 hour chart is king is todays take away!

EURUSD – The bearish threat is becoming increasingly clearRecently released PMI data shows that the U.S. manufacturing sector is rebounding. This dampens expectations of monetary easing from the Fed. With a stronger U.S. dollar and rising bond yields, USD-denominated assets like EURUSD are facing downward pressure.
On the daily chart, EURUSD is approaching the resistance zone at 1.16438 – an area that has rejected prices before. The recent rebound appears to be losing strength, and the ascending trendline is at risk of breaking.
If the price fails to hold above this trendline as illustrated, a breakout to the downside could drive the market toward the 1.10757 zone – which aligns with a previous strong support level.
In summary: be cautious of a potential trend break. If a pattern of lower highs continues, sellers may soon take control.

EURUSD Will Go Down From Resistance! Short!
Here is our detailed technical review for EURUSD.
Time Frame: 6h
Current Trend: Bearish
Sentiment: Overbought (based on 7-period RSI)
Forecast: Bearish
The market is trading around a solid horizontal structure 1.136.
The above observations make me that the market will inevitably achieve 1.126 level.
P.S
The term oversold refers to a condition where an asset has traded lower in price and has the potential for a price bounce.
Overbought refers to market scenarios where the instrument is traded considerably higher than its fair value. Overvaluation is caused by market sentiments when there is positive news.
Disclosure: I am part of Trade Nation's Influencer program and receive a monthly fee for using their TradingView charts in my analysis.
Like and subscribe and comment my ideas if you enjoy them!

EURO/USD 4H/Daily OutlookStill bullish — just waiting for the 4H BISI to form.
We’ll likely get overlapping price action around the 4H FVG + 0.75 retracement zone.
👉 Once we see displacement from the 50% of the 4H BISI, that’s the green light.
That’s the setup. That’s the "go in HAHAHA" moment 😂
For extra confirmation:
✅ A clean 15min BISI forming after the 4H displacement would seal the deal — ideal entry trigger.
🎯 Stay patient. Let the market build the setup. Precision > Prediction.

EUR/USD Hits Key Supply Zone! Pullback Loading?The bulls just slammed into a strong intraday supply zone (1.1415 – 1.1422), with signs of exhaustion showing near the highs. Liquidity sweep completed — are we set for a reversal?
🔵 Volume Profile shows a high-volume rejection.
📉 Previous aggressive drop from this zone adds confluence.
🔔 Multiple red news events ahead — brace for spikes and volatility.
---
🧠 Smart Money Insight
This price action fits the liquidity grab + reversal pattern we’ve seen often during news-heavy weeks. Institutions may be unloading longs here — setting up for a quick 1.1323 or 1.1227 test.
---
📌 Key Levels to Watch
🔵 Supply Zone (Short-Term): 1.1415 – 1.1422 (Already reacting)
🟦 Mid Support: 1.1323 → Former resistance flip
🟫 Demand Zone (Buy Area): 1.1227 → Deep value zone if bearish move continues
---
🧪 Trade Setup Ideas
> Scalp Short Setup
📍 Entry: 1.1415 – 1.1422
🎯 TP1: 1.1323
🎯 TP2: 1.1227
❌ SL: 1.1435
> Aggressive Buy Plan (if price drops fast)
📍 Entry: 1.1230 – 1.1250
🎯 TP: 1.1320 – 1.1350
❌ SL: 1.1205
---
📰 Event Watch
📌 EUR & USD have back-to-back high-impact events over the next 48 hours. Expect rapid moves — stay nimble or wait for confirmation candles.

EURUSD → False breakout of resistance. Correction?FX:EURUSD is strengthening amid a decline in the dollar, but the currency pair is encountering strong resistance and forming a false breakout, which could trigger a correction.
EURUSD is testing the resistance range as part of a distribution and forming a false breakout. The market structure is bullish, with the price breaking through local resistance and updating its high. The inability to continue growth and price consolidation below 1.1418 may trigger a correction. The dollar is also hitting support and may form a small correction, which will put pressure on EURUSD
Resistance levels: 1.14246, 1.1418
Support levels: 1.1384, 1.1343
If the currency pair fails to consolidate above 1.14246 during the resistance retest in order to continue its growth, then we can expect price consolidation below this level to open a short position. The correction may reach the specified support zones before continuing its growth.
Best regards, R. Linda!

Eurusd That is a 4hr timeframe , I think if price will likely go down and take that liquidity level it will be a good boost for it to go up and claim that major level on 4hr tf and daily tf

DeGRAM | EURUSD retest of the support📊 Technical Analysis
● Price rebounded off the flag base (1.128) and reclaimed the inner grey trend-median, keeping the sequence of higher-lows inside the two-year rising channel.
● The flag’s upper rail at 1.145 has been tested twice; a close above completes the pattern and projects to the channel roof / horizontal confluence at 1.1600, while dynamic support rises with the violet breakout line at 1.1214.
💡 Fundamental Analysis
● Euro stays bid after May EZ headline CPI re-accelerated to 2.6 % y/y, tempering expectations for aggressive ECB cuts, whereas weaker US ADP hiring and cooling core-PCE pressured real yields and the dollar.
✨ Summary
Long bias above 1.128; flag break > 1.145 targets 1.1600, stretch 1.1950. Invalidate on daily close < 1.1080.
-------------------
Share your opinion in the comments and support the idea with like. Thanks for your support!

EURUSD Long Setup Brewing – Here's My Trade Plan!Keeping an eye 👀 on EURUSD – price has just broken market structure 📈 to the upside, and we're seeing clear higher highs 🔼 and higher lows 🔽 forming on the 4H timeframe 🕓.
Price has now rallied into a premium zone 💰, and i'm watching for a retracement 🔁 into my Fibonacci 61.8% 📐✨ point of interest for a potential long entry 🟢.
✅ Entry criteria?
Wait for price to pull back ⬅️ and then give us a break of market structure again 💥.
I'll be looking for confirmations on the 30min or 15min ⏱️ timeframes.
🚫 Not financial advice ✌️

EURO/USD a projected bullish breakout.🧠 Chart Structure Overview
Pair: EUR/USD
Timeframe: 4-hour (4H)
Platform: TradingView
Indicators: SMART D S 250 6 2.6 (likely a custom or proprietary indicator)
Date Range: March to early June
Chart Type: Candlestick
---
🧾 Key Technical Elements
🔴 Support Zone
Marked in Red: A clear demand zone between 1.07002 and 1.08499, showing historical buying interest.
This is a high-probability reversal zone where price previously bounced, reinforcing the zone's strength.
🟢 Trendline Support
A dynamic upward sloping trendline intersects near current price action, adding confluence to the potential bounce area.
🟨 FVG (Fair Value Gap)
A yellow rectangle labeled "FVG" suggests an imbalance in price, where the market moved too quickly, leaving unfilled orders.
Often, price retraces to these zones before continuing the trend — a key liquidity magnet for smart money traders.
---
📈 Projected Price Movement (Trade Idea)
✔️ Bullish Bias
The chart suggests a bullish continuation setup, with price expected to:
1. Retest the ascending trendline and support zone.
2. Possibly dip into the FVG area.
3. Form a higher low.
4. Resume upward momentum targeting the green zone above.
🟩 Target Zone
Marked in green, the target zone ranges from around 1.14700 to 1.16750.
This is likely a take-profit zone, corresponding to prior structure highs or supply zones.
🟥 Stop-Loss Zone
Located just below the support area, likely in the 1.09800 - 1.07000 range, providing a tight risk-to-reward ratio.
---
⚙️ Risk/Reward Setup
The green and red rectangles represent a classic risk-reward trade box:
Risk: Below the trendline and support.
Reward: Above the current range high, with a projected bullish breakout.
---
🧠 Final Thoughts
This chart reflects a smart money concept-based approach, combining:
Market structure
Liquidity zones (FVG)
Support/resistance and trendlines
Risk-reward planning
It implies a well-defined long (buy) trade plan with technical confluences supporting bullish continuation — ideal for swing traders or intra-week position traders.

Clean Long Setup After Liquidity SweepThe EUR/USD trend is still bullish and is likely to continue at least toward the liquidity beyond the equal highs. We'll consider entering if a bullish setup forms.
🔍 My Trading Approach:
My trading and analysis are primarily based on market liquidity and how price tends to move toward areas where liquidity is pooled.
I use two main concepts in my strategy:
Fair Value Gaps (FVGs) to identify setups and entry zones
Measured Moves (MMs) to define target levels
🎯 Profit-Taking Rule:
I usually secure profits once price has moved at least 1.5 times the initial stop-loss distance in my favor.

Potential Short Setup Within a Bullish Context
It seems that EURUSD has formed nested setups, indicating potential short-term bearish movement. Signs point to a possible short setup targeting the 4H order block. However, since this move would go against the prevailing higher-timeframe trend, the probability of it playing out might be lower.
🔍 My Trading Approach:
My trading approach is built around price imbalances and liquidity. I focus on aligning entries with session timings, identifying daily bias and key liquidity levels, and using tools like FVGs for precise execution.
🎯 Profit-Taking Rule:
I usually secure profits once price has moved at least 1.5× the stop-loss distance in my favor

Lingrid | EURUSD Bullish Trendline Breakout. Potential LongFX:EURUSD continues to build strength above the 1.13720 resistance-turned-support line, supported by the upward channel structure. The pair is squeezing between the ascending trendline and the descending blue trendline, with higher lows signaling steady bullish pressure. A confirmed breakout above 1.14400 would likely trigger a move toward the 1.15700 target level inside the resistance zone. Price action favors bulls while the channel base holds.
📈 Key Levels
Buy zone: 1.13720–1.14000
Buy trigger: breakout above 1.14400
Target: 1.15700
Sell trigger: close below 1.13720
💡 Risks
A rejection from the downward trendline could trap breakout buyers
Choppy behavior within the wedge may cause false signals
Broader dollar strength could cap gains if macro data shifts unexpectedly
Traders, if you liked this idea or if you have your own opinion about it, write in the comments. I will be glad 👩💻

EUR/USD 1-Hour Timeframe – Long Position Setup
Entry Point: Initiate a long position slightly below 1.13513.
Stop-Loss Range: Set between 1.13056 and 1.13041 to manage risk.
Target Levels:
Primary Target: A breakout above 1.13822.
Secondary Target: A potential retest of 1.14304.
Important Note:
Avoid entering a long position if the price falls below 1.13056, as this may indicate a bearish reversal.
Tags: OANDA:EURUSD

EUR-USDNegative divergence has formed in rSI
It's too early to sell
Watch for selling, check lower time frame
EURUSD I Weekly CLS I Model 2 I Target CLS 1I2 LowsHey, Market Warriors, here is another outlook on this instrument
If you’ve been following me, you already know every setup you see is built around a CLS Footprint, a Key Level, Liquidity and a specific execution model.
If you haven't followed me yet, start now.
My trading system is completely mechanical — designed to remove emotions, opinions, and impulsive decisions. No messy diagonal lines. No random drawings. Just clarity, structure, and execution.
🧩 What is CLS?
CLS is real smart money — the combined power of major investment banks and central banks moving over 6.5 trillion dollars a day. Understanding their operations is key to markets.
✅ Understanding the behavior of CLS allows you to position yourself with the giants during the market manipulations — leading to buying lows and selling highs - cleaner entries, clearer exits, and consistent profits.
📍 Model 1
is right after the manipulation of the CLS candle when CIOD occurs, and we are targeting 50% of the CLS range. H4 CLS ranges supported by HTF go straight to the opposing range.
"Adapt what is useful, reject what is useless, and add what is specifically your own."
— David Perk aka Dave FX Hunter ⚔️
👍 Hit like if you find this analysis helpful, and don't hesitate to comment with your opinions, charts or any questions.

Eurusd is still bullish This EUR/USD daily chart from FXCM suggests a bullish breakout following a well-formed rounded bottom pattern.
Key Observations:
Rounded Bottom Formation: This pattern, marked with multiple lows (highlighted in orange circles), signals a gradual trend reversal from a downtrend to an uptrend.
Breakout Confirmation: Price has broken above the rounded resistance, indicating strong bullish momentum.
Projected Price Movement: The hand-drawn path suggests further upside, with possible retests before continuing higher.
Volume Profile: Increased activity around the 1.0900 level suggests strong support, with potential resistance near 1.1200 - 1.1400.
Conclusion:
This setup indicates a bullish continuation, but confirmation through sustained volume and price action above resistance is crucial.

FROM THE HIGHS ! - EURUSD SHORT FORECAST Q2 W23 D2 Y25EURUSD SHORT FORECAST Q2 W23 D2 Y25
🔥👀QUICK SCOPE TECHNICAL REVERSAL HOT PICK
Professional Risk Managers👋
Welcome back to another FRGNT chart update📈
Diving into some Forex setups using predominantly higher time frame order blocks alongside confirmation breaks of structure.
Let’s see what price action is telling us today!
💡Here are some trade confluences📝
✅1 hour order block
✅15' order block
✅Intraday bearish breaks of structure
✅Tokyo ranges to be filled
🔑 Remember, to participate in trading comes always with a degree of risk, therefore as professional risk managers it remains vital that we stick to our risk management plan as well as our trading strategies.
📈The rest, we leave to the balance of probabilities.
💡Fail to plan. Plan to fail.
🏆It has always been that simple.
❤️Good luck with your trading journey, I shall see you at the very top.
🎯Trade consistent, FRGNT X

EURUSD – Monday, June 2, 2025Current Outlook:
• Price is climbing slowly back toward our 1.14149 safe buy zone
• The secondary bullish structure is still holding cleanly
• No invalidations — bias remains bullish
📍 Buy Zones:
✅ HRHR Buys: Triggered at 1.12372
🔜 Safe Buys: Above 1.14149
🛡️ Safest Buys: Break and close above 1.16020
⚠️ Structure Notes:
We’ve respected both bullish trendlines so far
Daily candle formation is constructive — watching for a clean daily or 4H close near 1.14149 to trigger safe buys
🎯 Targets:
Intraday: 1.1500 zone
Swing: 1.16020 and beyond

EUR/USD🔹Symbol: EUR/USD
🔹Price: 1.12275
🔹Stop loss: 1. 1.11667
🔹Take profit 1: 1.12810
🔹Take profit 2: 1.13436
🔹Take profit 3: 1.14253
📊Check your chart before entering.
♦️Check before use to make sure there is no important news.

possibility of uptrendThe price is expected to fluctuate above the support area and then begin the upward trend. Then it can rise to the specified Fibonacci levels.
Otherwise, a correction to the previous low is possible.
