EURUSD on the riseEURUSD continues to move in line with expectations and gained over 100 pips yesterday.
This confirms the bullish trend and opens up opportunities for additional long positions.
The next targets, based on Fibonacci tools, are 1,1427 and 1,1563.
Watch for a potential pullback followed by a continuation of the uptrend.
EURUSD_W trade ideas

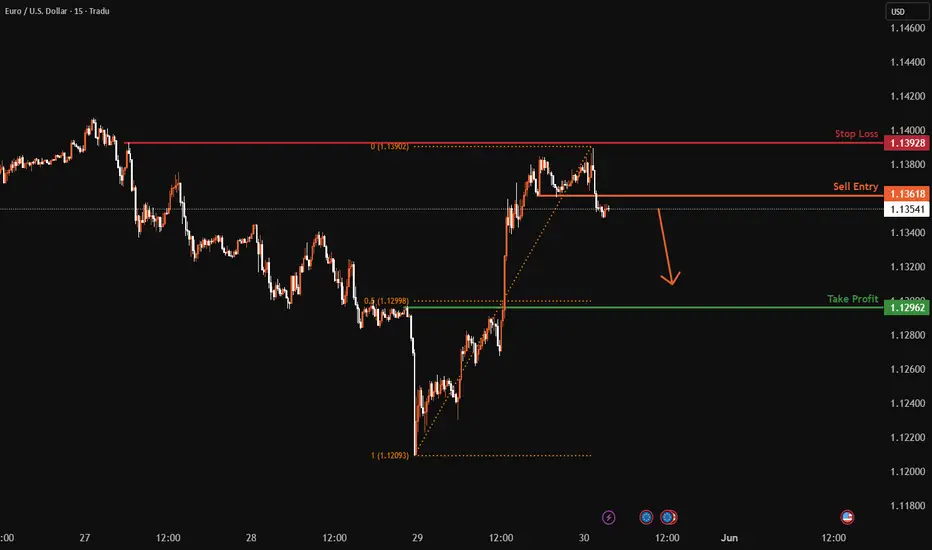
EURUSD M15 I Bearish Drop Based on the H4 chart, the price is rising toward our sell entry level at 1.1361, a pullback resistance.
Our take profit is set at 1.1296, a pullback support that aligns close the 61.8% Fibo retracement.
The stop loss is set at 1.1392 a swing high resistance.
High Risk Investment Warning
Trading Forex/CFDs on margin carries a high level of risk and may not be suitable for all investors. Leverage can work against you.
Stratos Markets Limited (tradu.com ):
CFDs are complex instruments and come with a high risk of losing money rapidly due to leverage. 63% of retail investor accounts lose money when trading CFDs with this provider. You should consider whether you understand how CFDs work and whether you can afford to take the high risk of losing your money.
Stratos Europe Ltd (tradu.com ):
CFDs are complex instruments and come with a high risk of losing money rapidly due to leverage. 63% of retail investor accounts lose money when trading CFDs with this provider. You should consider whether you understand how CFDs work and whether you can afford to take the high risk of losing your money.
Stratos Global LLC (tradu.com ):
Losses can exceed deposits.
Please be advised that the information presented on TradingView is provided to Tradu (‘Company’, ‘we’) by a third-party provider (‘TFA Global Pte Ltd’). Please be reminded that you are solely responsible for the trading decisions on your account. There is a very high degree of risk involved in trading. Any information and/or content is intended entirely for research, educational and informational purposes only and does not constitute investment or consultation advice or investment strategy. The information is not tailored to the investment needs of any specific person and therefore does not involve a consideration of any of the investment objectives, financial situation or needs of any viewer that may receive it. Kindly also note that past performance is not a reliable indicator of future results. Actual results may differ materially from those anticipated in forward-looking or past performance statements. We assume no liability as to the accuracy or completeness of any of the information and/or content provided herein and the Company cannot be held responsible for any omission, mistake nor for any loss or damage including without limitation to any loss of profit which may arise from reliance on any information supplied by TFA Global Pte Ltd.
The speaker(s) is neither an employee, agent nor representative of Tradu and is therefore acting independently. The opinions given are their own, constitute general market commentary, and do not constitute the opinion or advice of Tradu or any form of personal or investment advice. Tradu neither endorses nor guarantees offerings of third-party speakers, nor is Tradu responsible for the content, veracity or opinions of third-party speakers, presenters or participants.
Market next move ⚠️ 1. Weak Bullish Continuation Signal
The current price action shows a rejection wick on a red candle, signaling selling pressure near the recent highs.
Despite the upward move earlier, this could be a short-term exhaustion rather than strength for further upside.
---
📉 2. No Follow-Through After Bullish Spike
There was a strong bullish candle earlier, but:
No significant follow-up to break past that level convincingly.
Price appears to have stalled or even reversed after that spike — possibly forming a bull trap.
---
🔄 3. Overhead Resistance at Target Area
The "TARGET" label sits near recent highs, which have already been rejected once.
Without clear breakout volume, this zone might act as resistance, not a logical next stop.

EUR USD ShortI’m seeing a great short opportunity. Looks like we’ve printeda Lower high on Mondays candle and a lower low last week. DXY looks to be gaining upward momentum on a lower time frame for a bit. Once we get to the support level I’ll reevaluate. TP 1.1085

Eur USD longLooks like the euro will be strong up to 121 area for the 4th touch of the trend line. I won’t be looking for shorts until that area is reached. I am currently long but price may fall back to the 1.128 area for a restest then continue to climb.

EURUSD SELL / RANGETargets @ 1.12 (TP) - 1.5bn @ 1.150 (Last Entries) - 1.4bn @ 1.12 aswell - Waiting for a Reversal and Structure Breaks / Volume to activate potential Orders

EU Bull runJust some simple bullish movement. Nothing much to really say about it other then looks like a good opportunity.
Bearish reversal off pullback resistance?The Fiber (EUR/USD) is rising towards the pivot and could reverse to the support.
Pivot: 1.1424
1st Support: 1.1237
1st Resistance: 1.1555
Risk Warning:
Trading Forex and CFDs carries a high level of risk to your capital and you should only trade with money you can afford to lose. Trading Forex and CFDs may not be suitable for all investors, so please ensure that you fully understand the risks involved and seek independent advice if necessary.
Disclaimer:
The above opinions given constitute general market commentary, and do not constitute the opinion or advice of IC Markets or any form of personal or investment advice.
Any opinions, news, research, analyses, prices, other information, or links to third-party sites contained on this website are provided on an "as-is" basis, are intended only to be informative, is not an advice nor a recommendation, nor research, or a record of our trading prices, or an offer of, or solicitation for a transaction in any financial instrument and thus should not be treated as such. The information provided does not involve any specific investment objectives, financial situation and needs of any specific person who may receive it. Please be aware, that past performance is not a reliable indicator of future performance and/or results. Past Performance or Forward-looking scenarios based upon the reasonable beliefs of the third-party provider are not a guarantee of future performance. Actual results may differ materially from those anticipated in forward-looking or past performance statements. IC Markets makes no representation or warranty and assumes no liability as to the accuracy or completeness of the information provided, nor any loss arising from any investment based on a recommendation, forecast or any information supplied by any third-party.

Fed Minutes overshadowed by tariff uncertainty | FX ResearchUS equity futures are well bid ahead of the North American open, with S&P 500 minis up over 1.1% and the Nasdaq up 1.7%, partially driven by Nvidia's strong results and a US court ruling declaring some of President Trump's tariffs illegal. This has boosted risk sentiment by potentially supporting consumer spending and economic growth, although uncertainty remains as the ruling may face further scrutiny.
The FOMC minutes, largely overshadowed by this development, noted concerns about persistent tariff-related inflation. Economic data expected today includes jobless claims, projected to rise slightly, and a second reading of Q1 GDP, likely unchanged. April pending home sales are anticipated to drop by 1% month-over-month.
Fed speakers Barkin and Goolsbee may touch on tariff implications, though no major policy updates are expected. The $44 billion 7-year Treasury auction, the final one this month, is notable for its role in linking short- and long-end yields, with no signs so far of reduced foreign demand.
Exclusive FX research from LMAX Group Market Strategist, Joel Kruger

EURUSD SHORT POSITIONBased on my analysis, we have an imbalance area in this area that could push the price down.

EURUSD Long TermI'm expecting EU to peak at 1.20 somewhere around mid, maybe end of summer. This should also give the fundamental some time to cool down and we could see buyers get into DXY, at the same time causing EU to decline.

EUR USD Technical Analysis.This chart shows the EUR/USD currency pair on a 1-hour timeframe from TradingView. Here’s a breakdown of the analysis:
Current Price: 1.13373
Recent Trend: The price recently dropped and is now consolidating.
Highlighted Zones:
Support Zone (Bottom): Around the 1.12750–1.13200 range, marked by a shaded area where price previously bounced.
Resistance Zone (Top): Around the 1.13700–1.14100 range, also shaded, where the price previously faced resistance.
Forecast/Trade Idea:
A bullish reversal is anticipated from the current level.
The chart suggests a potential "cup and handle" or inverse head and shoulders pattern.
Target: 1.13805 (noted with a bullseye icon).
Path: The green arrow suggests an upward move toward the target zone.
This is a technical bullish setup anticipating a move upward to retest the resistance zone near 1.13805. The analysis assumes support will hold and momentum will shift upward.

Smart Money waits for the retracement, not the breakout.” TradingView chart for EUR/USD (30-minute )
🧠 Smart Money Concepts (SMC) Breakdown:
🟨 Bullish Zone (Demand)
Marked in yellow, this is the strong demand zone where price recently reversed.
This zone aligns with a potential order block or a liquidity grab.
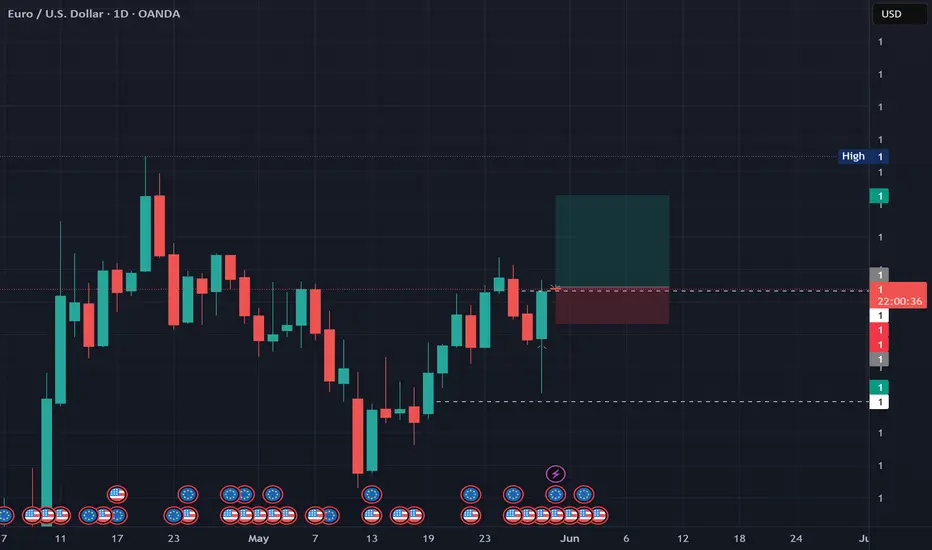
🟩 Green Box (Potential Re-entry Zone)
This is your optimal trade entry (OTE) zone.
Price is expected to retrace to this zone after facing resistance at the red supply zone.
It aligns with the discount level (below 50% of recent move).
🟥 Red Box (Supply Zone / POI)
Price is currently reacting to this zone.
This may be a short-term rejection point leading to the expected retracement.
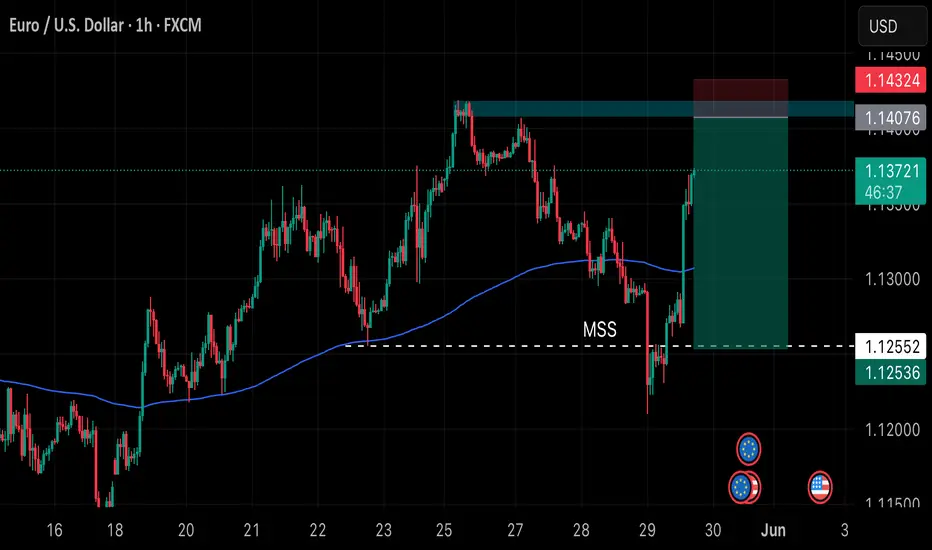
🟦 Blue Box (Higher-Timeframe POI / Supply)
A major target zone likely acting as liquidity above swing highs.
If price breaks and holds above red zone, this is the next target for longs.
🟩 Light Green Box (Final Target / Weekly Level)
Likely a weekly supply level or final target for a full bullish expansion.
---
📈 Projection (Dashed Arrows):
1. Short-Term Bearish Move: Price dips into green demand zone.
2. Long Entry from Demand: Potential bullish continuation from green zone to break above red.
3. Target Blue Supply: If red is broken, price will head to the blue zone next.
---
Highlight entry point near green box for 1:3+ RR.
Show retracement plan instead of immediate breakout.
Emphasize liquidity hunt at red zone before continuation.
“
---
Would you like me to do analysis of. Other pair , mention in comments,🖇️

EURUSD: Bullish Megaphone unfolds its new bullish wave.EURUSD just turned bullish on its 1D technical outlook (RSI = 56.015, MACD = 0.004, ADX = 31.789) as it maintains a sustainable short term uptrend through a Bullish Megaphone pattern. The 1D MA50 has assumed the role of the medium term Support and the 3rd bullish wave is already under way. We expect it to repeat at least the previous +2.59% wave, having a TP = 1.14950.
## If you like our free content follow our profile to get more daily ideas. ##
## Comments and likes are greatly appreciated. ##

SHORT ON EUR/USDEUR/USD has pulled back to a major supply zone that previously formed a DOUBLE TOP in that area in the past. (This is technically the re-test)
I have placed a sell limit order in the supply area and I will be expecting EUR/USD to fall past the swing low for over 100 -150 pips.

# EURUSD M 15 Unmitigated Supply with Liquidity swap # EURUSD M 15 Unmitigated Supply with Liquidity swap after LTF Conformation then entry

EURUSD SHORT IDEALooking to take a sell position on EURUSD. Price has broken market structure that was in an uptrend and is now returning to an OrderBlock that I’ve refined from the 4h timeframe to the 1hr timeframe. As always I’ll be keeping a close eye for confirmation that price wants to go down.
What are your thoughts on this pair?
EURUSD: Move Down Expected! Short!
My dear friends,
Today we will analyse EURUSD together☺️
The price is near a wide key level
and the pair is approaching a significant decision level of 1.13626 Therefore, a strong bearish reaction here could determine the next move down.We will watch for a confirmation candle, and then target the next key level of 1.13164.Recommend Stop-loss is beyond the current level.
❤️Sending you lots of Love and Hugs❤️

eurusdI think the euro will fall given the twin ceilings we have.
The stop loss is clear in the picture

Short Sell Day Trade On EUR/USD I am risking very little pips. If I get stopped out I will leave it alone. If I dont I will take 20 pips profit and lower my stop loss to break even or less risk.

#AN003 News of the Week and Impact on Forex
Hello, I am Forex trader Andrea Russo, and today I present to you a detailed analysis of the most important news of the week (26–29 May 2025) and their real impact on the Forex market, with strategic observations to immediately include in your trading plan.
In this article we will examine the 7 most significant macroeconomic and geopolitical events that have affected the main currency pairs, evaluating the effect on USD, EUR, GBP, JPY, CAD, AUD and emerging currencies. Everything is filtered according to the SwipeUP v9 Elite FX model, based on institutional data, real sentiment and candle-by-candle simulations.
📌 1. USA: Court stops Trump Tariffs
One of the most relevant news of the week comes from the United States: a federal court has blocked the application of Donald Trump's trade tariffs, declaring them illegitimate. This event has caused an immediate reaction in the currency markets.
🔍 Forex Impact:
The US Dollar (USD) had an initial technical bounce, but then lost strength in the European session.
Pairs such as EUR/USD and USD/JPY showed strong reactivity. EUR/USD was rejected from 1.1250, while USD/JPY found support.
📊 Strategic Implications:
Risk perceptions on the greenback are rising.
Interest in alternative safe haven currencies such as gold and the Swiss franc is growing.
📌 2. US Q1 GDP Downward
US Q1 GDP was revised down from -0.1% to -0.2%, confirming a mild economic contraction.
🔍 Forex Impact:
The dollar lost momentum, reinforcing the narrative of a possible rate cut.
EUR/USD could consolidate above 1.1200 ahead of stronger EU PMI data.
📊 Key Pairs:
EUR/USD long on confirmation of 1.1200 support.
Possible breakout on AUD/USD if US data continues to disappoint.
📌 3. US Inventories and Oil Rebound: CAD on the Boost
US crude inventories fell more than expected, and WTI price is back above $79.
🔍 FX Impact:
CAD strengthens on fundamental and intermarket basis.
Potential short on USD/CAD with target area 1.3550.
📌 4. UK: Very Strong Data and Resilient GBP
UK macro data surprised to the upside: services PMI and core inflation stable, supporting the British pound.
🔍 Forex Impact:
GBP/USD above 1.2700 with room for expansion.
EUR/GBP rejected by 0.8600: potential for bearish continuation.
📌 5. Forex Options Expirations and Expected Volatility
Thursday and Friday are crowded with large option expirations, which can act as price magnets.
📍 Levels to Watch:
EUR/USD: 1.1200 and 1.1250 → potential for spikes or rejections.
USD/JPY: 145.00 → technical and options confluence.
AUD/USD: 0.6650 key zone with volumes in compression.
📊 Trading advice: avoid new entries near option levels without confirmation of real breakout.
📌 6. Nvidia and US Tech Rally: Anti-Yen Effect
Nvidia’s results have boosted the entire US tech sector, causing a wave of risk-on.
🔍 Impact on FX:
JPY and CHF weak on low interest in safe-haven assets.
Great setups on AUD/JPY, CAD/JPY, EUR/CHF long.
📌 7. China: PMI Above 50, Support for AUD/NZD
Chinese manufacturing PMI data has returned above 50, signaling expansion.
🔍 Impact on FX:
AUD and NZD find technical and macro support.
Watch out for AUD/CHF, where macro divergences could generate a bearish reversal.
🧠 Forex Trading Strategy for the Next Week
✅ Strong Currencies:
CAD (oil + risk-on sentiment)
GBP (macro data + technical momentum)
EUR (resilience on USD and supports held)
❌ Weak Currencies:
USD (negative GDP, political uncertainty)
JPY (no safe haven demand)
AUD (potentially vulnerable on risk-on downside)

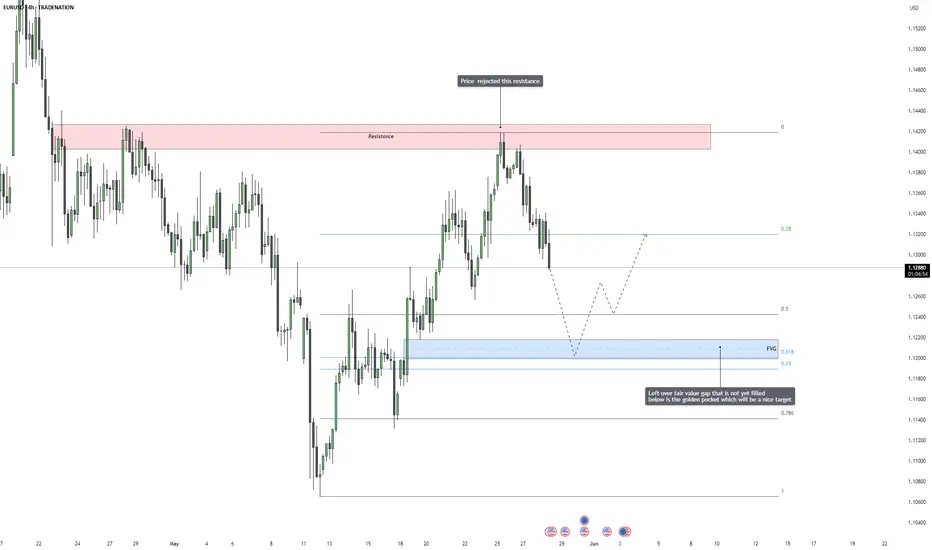
EURUSD – Bearish Reversal in Motion, Fair Value Gap Draws Price EURUSD has recently reacted strongly to a major resistance zone, where price previously stalled and reversed in the past. After running into this area again, we saw a sharp and immediate rejection, which confirms the presence of aggressive selling pressure. This rejection was not just a weak pullback, but a strong displacement candle that shows real intent from institutional participants.
This kind of price action is typically a sign that the market has found a short-term top, and will now look to rebalance lower, especially if there are inefficiencies left behind during the last move up. With the rejection now confirmed and price starting to rotate lower, the odds increase that we see a deeper retracement in the coming sessions.
Resistance Reaction and Liquidity Story
The price reached into a well-defined supply area and rejected cleanly. This level was likely filled with buy-side liquidity from breakout traders and late longs, which institutions needed in order to fill their sell orders. After sweeping above the previous highs and triggering breakout entries, price snapped back below, creating a shift in short-term structure.
That move also created a market imbalance, a price inefficiency that the market tends to come back and correct. With bullish liquidity absorbed at the highs, price is now looking for sell-side liquidity, which can typically be found below the previous higher lows and inside unfilled value areas.
Fair Value Gap and Fibonacci Confluence
Below the current market, we have a clean fair value gap that was left behind during the most recent impulsive bullish move. What makes this area even more attractive is that it overlaps perfectly with the golden pocket zone, the 0.618 to 0.65 Fibonacci retracement level. This confluence creates a high-probability target area, not just because of the imbalance, but also because this level acts as a common retracement zone where institutional traders often look to reaccumulate or exit short-term positions.
This area is also likely to hold resting liquidity from traders who placed stop losses under recent higher lows. All these factors combined make the fair value gap plus golden pocket area a natural draw for price, the market tends to gravitate toward these zones when there’s unfinished business left behind.
Expectations and Potential Development
Going forward, I expect price to continue bleeding lower in a controlled fashion, possibly forming minor lower highs along the way. Once the fair value gap is reached and filled, we could see signs of support or accumulation, depending on the context at the time. It’s important not to blindly long from that area, but instead wait for a market reaction, ideally a shift in structure on the lower timeframes, to signal that buyers are stepping back in.
If the market holds that area and confirms support, it could launch a new leg higher. However, if the fair value gap fails and price continues to break down, it would signal that this move is not just a retracement but possibly the start of a larger bearish leg.
Conclusion
The rejection from resistance has opened the door for a deeper retracement. With a clear fair value gap and Fibonacci golden pocket below, the market now has a logical destination to correct toward. This level offers a clean narrative for continuation lower, and it aligns with both price action structure and algorithmic models. Patience is key now, the best opportunities come when price delivers into clean zones like this one.
Disclosure: I am part of Trade Nation's Influencer program and receive a monthly fee for using their TradingView charts in my analysis.
___________________________________
Thanks for your support!
If you found this idea helpful or learned something new, drop a like 👍 and leave a comment, I’d love to hear your thoughts! 🚀
CHECK EURUSD SIGNAL READ CAPTAIN(eurusd )buy zone
( TRADE SATUP)
ENTRY POINT (1.13500) to (1.13400) 📊
FIRST TP (1.13150)
2ND TARGET (1.12800) 📊
LAST TARGET (1.12400) 📊
STOP LOOS (1.13800)❌
