EUR/USD💰Symbol: { EUR/USD }
🟩Price: { 1.13680 }
🟥Stop: { 1.14780 }
1️⃣profit: { 1.12650 }
2️⃣profit: { 1.11680 }
3️⃣profit: { 1.10840 }
4️⃣profit: { 1.09940 }
5️⃣profit: { 1.08820 }
📊Check your chart before entering.
🚨Check before use to make sure there is no important news.🚨
EURUSD_W trade ideas

EURUSD PullbackEURUSD continued its pullback this morning, reaching 1,1207.
The uptrend remains intact, and this correction is a healthy move for its continuation.
The next key support level is at 1,1198.
Watch for a potential bounce and buying opportunity.
The target is a breakout above the previous high!

EURUSD H4 | Bearish Reversal Based on the H4 chart, the price is approaching our sell entry level at 1.1286, a pullback resistance.
Our take profit is set at 1.1197, a pullback support.
The stop loss is set at 1.1363, a pullback resistance.
High Risk Investment Warning
Trading Forex/CFDs on margin carries a high level of risk and may not be suitable for all investors. Leverage can work against you.
Stratos Markets Limited (tradu.com ):
CFDs are complex instruments and come with a high risk of losing money rapidly due to leverage. 63% of retail investor accounts lose money when trading CFDs with this provider. You should consider whether you understand how CFDs work and whether you can afford to take the high risk of losing your money.
Stratos Europe Ltd (tradu.com ):
CFDs are complex instruments and come with a high risk of losing money rapidly due to leverage. 63% of retail investor accounts lose money when trading CFDs with this provider. You should consider whether you understand how CFDs work and whether you can afford to take the high risk of losing your money.
Stratos Global LLC (tradu.com ):
Losses can exceed deposits.
Please be advised that the information presented on TradingView is provided to Tradu (‘Company’, ‘we’) by a third-party provider (‘TFA Global Pte Ltd’). Please be reminded that you are solely responsible for the trading decisions on your account. There is a very high degree of risk involved in trading. Any information and/or content is intended entirely for research, educational and informational purposes only and does not constitute investment or consultation advice or investment strategy. The information is not tailored to the investment needs of any specific person and therefore does not involve a consideration of any of the investment objectives, financial situation or needs of any viewer that may receive it. Kindly also note that past performance is not a reliable indicator of future results. Actual results may differ materially from those anticipated in forward-looking or past performance statements. We assume no liability as to the accuracy or completeness of any of the information and/or content provided herein and the Company cannot be held responsible for any omission, mistake nor for any loss or damage including without limitation to any loss of profit which may arise from reliance on any information supplied by TFA Global Pte Ltd.
The speaker(s) is neither an employee, agent nor representative of Tradu and is therefore acting independently. The opinions given are their own, constitute general market commentary, and do not constitute the opinion or advice of Tradu or any form of personal or investment advice. Tradu neither endorses nor guarantees offerings of third-party speakers, nor is Tradu responsible for the content, veracity or opinions of third-party speakers, presenters or participants.

EURUSD - TECH.Hello everyone.
As we can see, in this chart we have strong and solid resistance area.
(It is marked dark yellow colored). So, it's high probability we see the price little bellow.
Have a profitable day!

EURUSDHello Traders! 👋
What are your thoughts on EURUSD?
EURUSD has pulled back to the broken trendline and is now trading below a key resistance zone.
As long as the price remains below this resistance, we expect a short-term decline toward the specified support level.
The rejection from this zone suggests a possible continuation of the down move.
However, if price breaks and holds above the resistance zone, the bearish outlook will be invalidated.
Don’t forget to like and share your thoughts in the comments! ❤️

EUR/USD 1H CHART PATTERNThis EUR/USD chart shows a clear bearish setup following a break below a trendline and horizontal support. Price action suggests a descending triangle pattern with momentum shifting downward. Indicators, including moving averages and trendlines, point to a potential continuation of the bearish move. The large projected downside move is marked with measured targets, indicating strong conviction in the sell setup. The chart aligns with prior rejection points and suggests sellers are in control, aiming for key support levels. Risk management and precise entries are important, as volatility could increase near critical price zones.
Entry: 1.13640
1st target: 1.13000
2nd target: 1.12350
3rd target: 1.11200
Stop Loss: 1. 14240

EU Prints Three Black Crows!FX:EURUSD has printed a strong Triple Candlestick Pattern called Three Black Crows after having made a 50% Retracement of the failed Higher High @ 1.1407.
This 50% Retracement found price testing a Previous Low and Resistance Zone where price now has broken a Previous Level of Structure being Support and is now on its way up to Retest this Break!
If Price is able to Retrace back to the Level of Structure @ ( 1.1336 - 1.1340 ) and shows signs of Resistance, this could deliver Short opportunities to take Price down to the Next Levels of Support @ 1.131 & 1.126!

Against All OddsThis highlights the importance of the Daily time frame as if we did not notice it's movements along side the 4h greed zone we would not have been on top like many others who have fallen today.

eurusd 20 short-term market update short it exit 1160🏆 EURUSD Market Update m20 short-term trade
📊 Technical Outlook
🔸Short-term: BEARS 1160
🔸5 waves impulse completed
🔸1090/1240/1140/1350/1270/1410
🔸a/b/c/ correction 1160
🔸short sell and exit at 1160
🔸Price Target Bears: 1160
Key recent developments in EURUSD
📉 The U.S. dollar weakened as investors grew concerned over President Trump's proposed tax and spending bill, which could significantly increase the national debt
📈 The euro reached a one-month high after President Trump delayed the implementation of 50% tariffs on European Union imports, providing a temporary boost to investor confidence
🗣️ European Central Bank President Christine Lagarde suggested that the euro could become a global alternative to the U.S. dollar, contingent on strengthening the EU's financial and security infrastructure
📊 Technical analysis indicates that the EUR/USD pair may edge higher within a range of 1.1360 to 1.1420, though upward momentum is slowing
📉 Soft inflation data from France has increased selling pressure on the euro, as markets anticipate a stronger divergence between the Federal Reserve and the European Central Bank
📉 The EUR/USD pair is under bearish pressure, trading near 1.1350, as the U.S. dollar finds demand ahead of upcoming economic data and ongoing Senate tax debates

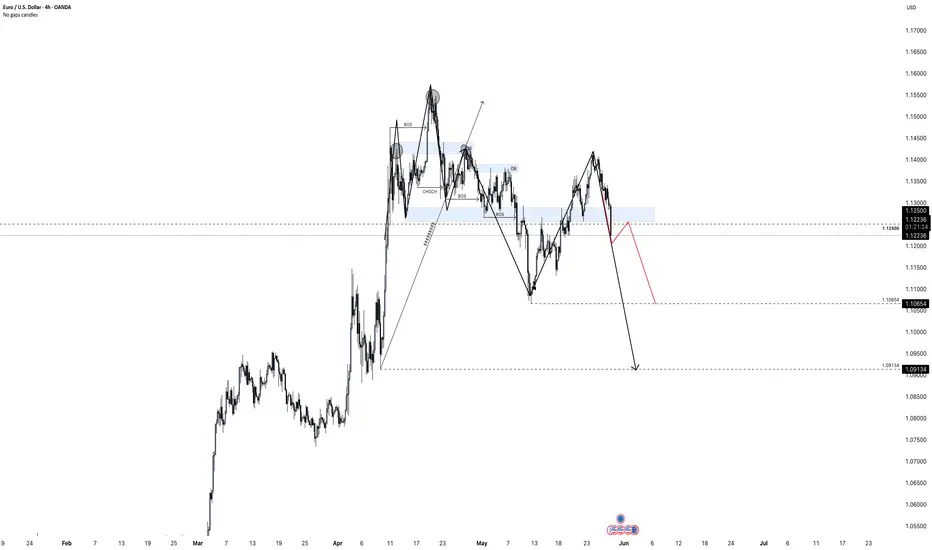
Eurusd has the potential to Sell (short)Eurusd has the potential to sell all the way down to 1.09134 for a nice swing trade .
we also have a head and shoulder pattern that was formed , and that already broke the neckline of the head and shoulder pattern .
Price decided to go bullish for some time but I think we got a full correction to the upside before the impulsive move back down, which is what I'm expecting but my first Area to target would be 1.110654 . It is a strong Area of interest so I will be expecting price to react from that level before reaching its final target .
EUR-USD Free Signal! Buy!
Hello,Traders!
EUR-USD is going down
And the pair will soon hit
A horizontal support level
Around 1.1270 from where
We will be able to go long
With the Take Profit of 1.1328
And the Stop Loss of 1.1254
Buy!
Comment and subscribe to help us grow!
Check out other forecasts below too!
Disclosure: I am part of Trade Nation's Influencer program and receive a monthly fee for using their TradingView charts in my analysis.

EUR/USD) breakout Analysis Read The ChaptianSMC trading point update
Technical analysis for EUR/USD (Euro/US Dollar) on a 3-hour timeframe presents a bearish outlook. Here's a breakdown of the key ideas and elements in the analysis:
---
1. Breakdown of Rising Channel
Ascending Channel: Price was moving upward within a clearly defined channel.
Breakout: The price broke below the ascending channel, indicating a potential trend reversal or correction.
---
2. Resistance Zone (Yellow Box)
Multiple Rejections: Red arrows mark points of rejection from the resistance area.
“Breakout” Label: Indicates this area was previously a support that turned into resistance after the price dropped below it.
---
3. EMA 200
The 200 EMA is plotted and the price is trading slightly above it, but very close.
A break and sustained movement below the 200 EMA would typically support a bearish trend continuation.
---
4. Bearish Projection
Downward Zigzag Path: Implies an expected short-term correction followed by further decline.
Target Points:
First target: 1.11307
Second, more extended target: 1.10639
---
5. RSI (Relative Strength Index)
Current Value: Around 38.84, which is near the oversold region (30).
Bearish Momentum: RSI is trending downwards, suggesting strengthening bearish momentum.
---
6. Fundamental Events
Multiple icons at the bottom (e.g., flags, calendar) indicate upcoming economic events/news which could influence volatility and confirm or invalidate the move.
Mr SMC Trading point
---
Conclusion:
This analysis suggests a bearish short- to medium-term outlook for EUR/USD, especially if price confirms a break below the 200 EMA. The resistance zone (around 1.133–1.135) is now seen as a supply zone, and the targets are around 1.113 and 1.106.
---
Suggestions/Considerations:
Watch the 200 EMA: A solid break below it would reinforce the bearish bias.
Monitor Fundamentals: U.S. and Eurozone economic news could heavily impact price action.
RSI Oversold Caution: If RSI dips further, a bounce might occur before full target completion.
Pales support boost 🚀 analysis follow)

EURUSD – Reloading the LongsPrice is back on the old breakout shelf (1.1285-1.1290) and hugging the 200-SMA on H1.
As long as this box holds, I’m looking for a rebound toward the mid-1.13s (1.1340).
Invalidation: clean close below 1.1260

EU D1 TimeframeOn daily, the pair has formed a flag which is a continuation pattern. The flag is wave 4, and should be selling to complete wave 5 for the next bullish move.

EUR/USD Lower-High - Of Interest for USD-StrengthAs looked at in the last post the US Dollar is currently working on a doji for the month of May and the weakness that was widespread through March and the first three weeks of April has dissipated over the past month and change. USD/JPY has been a big part of that, following the pair's 140.00 test last month which has so far held at a higher-low. But - if looking for USD-strength, EUR/USD may make for a more compelling backdrop.
The pair has so far held a lower-high at the 1.1400 handle following last month's failed run at 1.1500. Notably, this also coincides with a bearish trendline, drawn from 2021 highs which came back into play last month to hold resistance for three consecutive weeks.
The lower high showing now further reinforces the view that a local top may be in-place on the pair.
If looking to work with USD-strength on the basis of a turn, EUR/USD looks like one of the more compelling major FX pairs, whereas markets like GBP/USD and USD/CAD seem situated more attractively for USD-weakness scenarios. - js

EURUSD SellEU has formed a diagonal which is a reversal pattern. We anticipate the a swing bearish move to 0.9 region. On weekly timeframe, the market is still in a corrective phase to complete the last leg of WXYXZ correction. Our first TP for the bearish impulsive move is 1.008. Wave z has 5 impulsive waves, we now on wave 3.

EURUSD | Descending ChannelEURUSD is in bearish trend and seems to stay in continuation pattern since it is printing clear lower lows and lower highs in accordance with the tenets of Dow theory.

EURUSD played out really nicely I set a sell limit on EURUSD, and it’s performing perfectly. I’m confident it will reach my target before the London open! 🎯
After the buy-side liquidity was swept, the price retraced to take out the previous highs on the buy-side liquidity. I waited until Monday, which was a bank holiday, to place my sell limit. It became active during the Asian session at midnight, and I successfully hit my take profit.


EURUSD is Ready for a Bullish MoveHello Traders
In This Chart EURUSD HOURLY Forex Forecast By FOREX PLANET
today EURUSD analysis 👆
🟢This Chart includes_ (EURUSD market update)
🟢What is The Next Opportunity on EURUSD Market
🟢how to Enter to the Valid Entry With Assurance Profit
This CHART is For Trader's that Want to Improve Their Technical Analysis Skills and Their Trading By Understanding How To Analyze The Market Using Multiple Timeframes and Understanding The Bigger Picture on the Charts

Market next move Current Analysis Breakdown:
Pair: EUR/USD on a 1-hour timeframe.
Recent Action: Sharp decline with a small bullish reversal candle.
Assumption: A potential bounce or reversal targeting the area marked as "Target."
Volume: Increased during the decline and slightly bullish at the last candle.
Technical Area: The “Target” is set above the current price, implying a bullish move is expected.
---
Disrupting the Analysis:
Let’s introduce potential bearish or contrarian scenarios to question the bullish target assumption:
1. False Reversal / Dead Cat Bounce
The small green candle after a strong red volume drop could simply be a temporary retracement or a dead cat bounce—a short-lived recovery before the price resumes falling.
2. Volume Analysis Contradiction
While volume has increased, the spike occurred mostly during red candles (bearish). This indicates strong selling pressure, not accumulation. The green candle’s volume is relatively small, suggesting weak buyer interest.

Long Setup in Play"If price moves toward higher highs before reaching the entry zone, the probability of a successful trade decreases."
🔍 My Trading Approach:
My trading and analysis are primarily based on market liquidity and how price tends to move toward areas where liquidity is pooled.
I use two main concepts in my strategy:
Fair Value Gaps (FVGs) to identify setups and entry zones
Measured Moves (MMs) to define target levels
🎯 Profit-Taking Rule:
I usually secure profits once price has moved at least 1.5 times the initial stop-loss distance in my favor. FOREXCOM:EURUSD

EURUSD Analysis - Waiting for movement
EURUSD has broken above the 1H resistance and has retested it, which is now acting as temporary support.
🔄 If price starts ranging around this level, we could see a short-term bearish move of a few dozen pips, targeting the buy-side liquidity and unfilled orders highlighted on the chart.
📈 However, if price gains bullish momentum from here, there's a potential for a 100-pip upward move.
We’re currently watching how price interacts with the supply and demand zones, to align our entries with it on the lower timeframes.
🔍 Insight by ProfitaminFX
If this outlook aligns with your bias, or if you see it differently, feel free to share your perspective in the comments. Let’s grow together 📈
