EU bullish Seeing a clear movement on EU . In line with the upcoming news .daily confirm the bullish move
EURUSD_W trade ideas

Fundamental Market Analysis for May 28, 2025 EURUSDThe EUR/USD pair retreated below 1.1400 for the second consecutive day, helped by a recovery in the US Dollar (USD) following the release of a positive consumer confidence report.
Risk appetite increased as market participants digested the news that US President Donald Trump said that trade talks between the United States (US) and the European Union (EU) have gained momentum following his threats to impose 50 percent tariffs last Friday. Although he backtracked on his words, allowing some room for negotiations, it remains to be seen if the two sides will reach an agreement before July 9.
The convincing US consumer confidence data for May released by the Conference Board (CB) put pressure on EUR/USD. The US Dollar Index (DXY), which tracks the value of the US currency against the other six currencies, rose more than 0.62% to 99.54.
The ECB's Gediminas Simkus said he sees scope for an “interest rate cut in June”. Robert Holzmann, a member of Austria's central bank and a member of the ECB, told the Financial Times (FT) that he sees no reason to cut rates at the June and July policy meetings.
Trade recommendation: SELL 1.1265, SL 1.1365, TP 1.1065

EURUSD TODAYEURUSD on Wed May 28 presenting chart a heavy Bearish trend that most probably will target 4H swing low. of course after filling 15m POI orders left above.

EURUSD Trade Plan 26/05/2025Dear Traders,
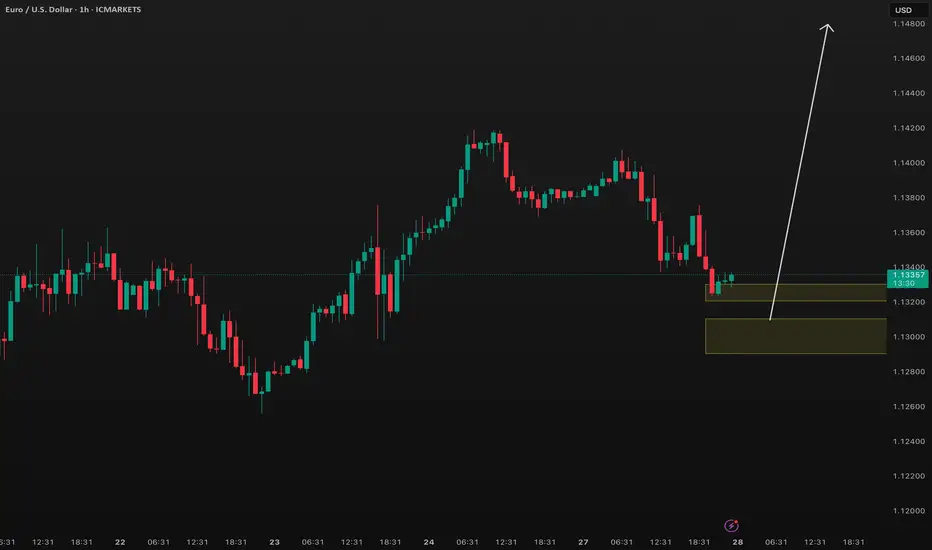
i expect price will Continue upward movement to 1.15000-1.16000 Area ,
Buy Area : 1.13000-1.13200
(Bottom of Ascending channel + Pullback to Descending channel)
if you enjoyed this forecast, please show your support with a like and comment. Your feedback is what drives me to keep creating valuable content."
Regards,
Alireza

EURO/USD -demand zone culminating at the projected reversal area
Key Zones & Patterns
Break of Structure (BOS):
A BOS is marked in the red circle on the left side, signaling a shift from a bullish to a bearish market structure.
Supply Zone (Green Box at Bottom):
This zone was tested after the BOS and sparked a reversal. It acted as a major accumulation area (around 1.10500–1.11500 range).
Harmonic Pattern (AB=CD/XABCD):
The chart shows a harmonic pattern identified by points X, A, B, C, D.
XA to AB retracement: Approximately 61.8%
BC to CD extension: Suggests a harmonic completion near point D
Parallel Channel:
A bullish trend channel is drawn as the price rises post-demand zone, culminating at the projected reversal area.
---
Current Market Outlook
Price Level: Around 1.136xx at the time of screenshot.
Projected Action:
The chart suggests the price may reverse downward from the current supply area near 1.141xx.
A bearish move is forecasted with a red arrow indicating a drop.
A horizontal arrow suggests a consolidation zone before continuation.
The TARGET level is marked near the 1.123xx region.
---
Trade Setup Idea
Sell Zone (Red Box at Top):
Anticipated area for short entries, in alignment with the harmonic pattern completion and overextension.
Short-Term Bias: Bearish
Rejection from harmonic D-point and supply zone
Break of ascending channel support is anticipated
Downside Target:
1.123xx zone, which aligns with a prior consolidation and demand interest
Clear risk-reward structure: stop above 1.141xx, target near 1.123xx
---
Conclusion
This EUR/USD chart suggests a bearish reversal is likely after completing a harmonic structure at a key resistance/supply area. Price action confirms a potential break below the ascending channel. The setup presents a clean short opportunity with confirmation bias coming from structure break (BOS), harmonic alignment, and a defined supply zone.

Wyck rejection In every internal liquidity there is a long wyck rejection somewhere and it gathers a lot of liquidity..the market makers will come for those orders before going any further

Long term BullsThe trend is upside and what we see is a leading diagonal indicating the completeness of the wave 1, so we're looking for the completeness of the wave 2 correction before we head upstairs. And this is our blue print.
Follow us for more insights and contents
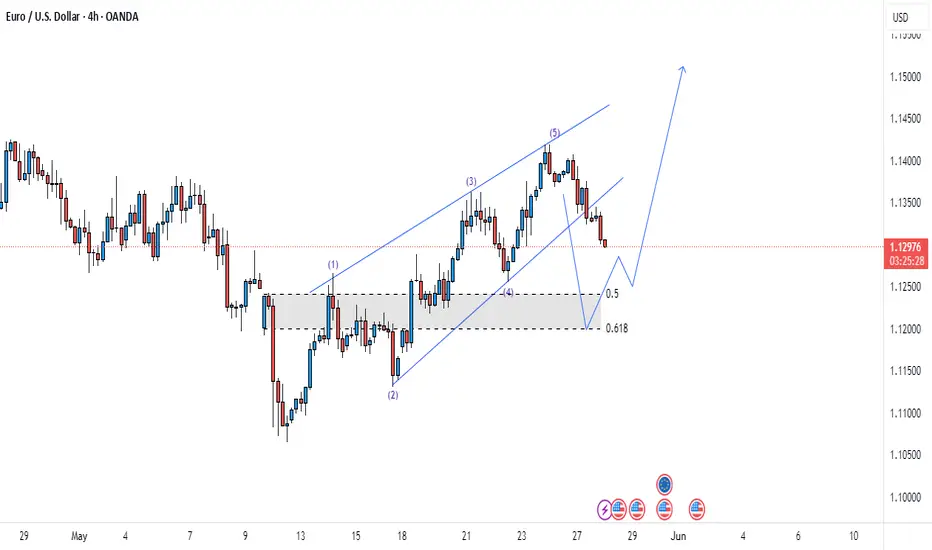
Bullish bounce?EUR/USD is falling towards the support level which is an overlap support that aligns with the 38.2% Fibonacci retracement and could bounce from this level to our take profit.
Entry: 1.1273
Why we like it:
There is an overlap support level that lines up with the 38.2% Fibonacci retracement.
Stop loss: 1.1164
Why we like it:
There is a pullback support level that is slightly above the 78.6% Fibonacci retracement.
Take profit: 1.1415
Why we like it:
There is a pullback resistance level.
Enjoying your TradingView experience? Review us!
Please be advised that the information presented on TradingView is provided to Vantage (‘Vantage Global Limited’, ‘we’) by a third-party provider (‘Everest Fortune Group’). Please be reminded that you are solely responsible for the trading decisions on your account. There is a very high degree of risk involved in trading. Any information and/or content is intended entirely for research, educational and informational purposes only and does not constitute investment or consultation advice or investment strategy. The information is not tailored to the investment needs of any specific person and therefore does not involve a consideration of any of the investment objectives, financial situation or needs of any viewer that may receive it. Kindly also note that past performance is not a reliable indicator of future results. Actual results may differ materially from those anticipated in forward-looking or past performance statements. We assume no liability as to the accuracy or completeness of any of the information and/or content provided herein and the Company cannot be held responsible for any omission, mistake nor for any loss or damage including without limitation to any loss of profit which may arise from reliance on any information supplied by Everest Fortune Group.


EURUSD SET TO DROP!Price is struggling to break through the high of 1.1500 I anticipate a drop in price. The UK unemployment change macroeconomic data is set to be released 2hrs from now. We expect a weaker EURO against USD. A sell opportunity is envisaged.

Market next target
⚠️ Disruption Points:
1. Dubious Support Zone
The boxed zone (highlighted as support) shows multiple rejections but no clear bullish rejection candles (e.g., no hammer, bullish engulfing).
This may be a false base forming before another breakdown, especially with declining volume.
2. No Confirmed Reversal Pattern
The chart lacks a proper reversal structure like a double bottom, inverse head-and-shoulders, or bullish divergence.
A few sideways candles ≠ trend reversal—this might just be consolidation before further drop.
3. Weak Buyer Commitment
Volume has steadily decreased as the price attempted to base out.
If buyers were serious, we’d expect to see surging green volume bars, not this tapering activity.
4. Downtrend Still Dominant
The overall market structure is still lower highs and lower lows.
Jumping into a long trade against the trend without a confirmed break above the last swing high (≈1.13250) is premature.
5. Risk-Reward Imbalance
The arrowed path assumes an ideal rise without considering realistic pullbacks or market resistance.
If a stop is set below 1.12800 (support low) and the target is 1.13400, reward is tight compared to the risk, especially if price continues chopping sideways.

EURUSD – Holding the uptrend, eyes on support reactionEURUSD continues to move steadily within a clearly defined rising channel. After touching the channel bottom around 1.1305 (which aligns with the 89 EMA), price is showing a slight rebound and has a chance to form the next upward leg.
Technical view: The bullish structure remains intact. As long as price holds this bottom area, there's a high probability of another push toward the resistance zone around 1.1428 – a level that was previously rejected.
News factor: Market sentiment is now focused on upcoming U.S. Core PCE inflation data, which could influence expectations of a Fed rate cut and, in turn, impact the strength of the USD.
Suggested strategy: Favor buying if price holds above 1.1305 – targeting 1.1428. If this level fails, the short-term uptrend may be challenged.

EURUSD pullback underwayEURUSD has begun the anticipated correction and has already dipped below 1,1300.
Key support levels to watch:
1,1282
1,1240
1,1198
Keep an eye out for a bounce from these levels, which could present buying opportunities.
The goal remains clear: a breakout above the previous high and a move toward 1,1600!


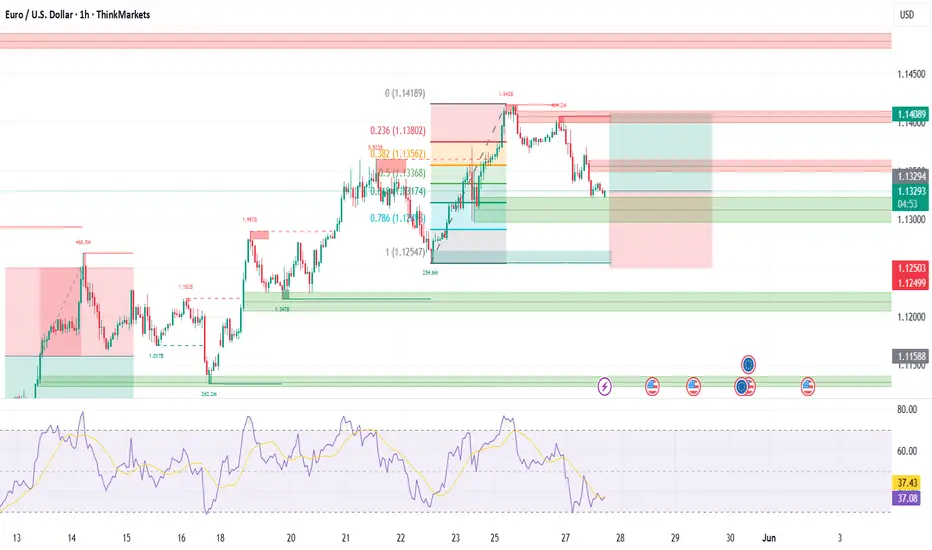
EURUSD Reaches Key Resistance – Reversal or BreakoutEURUSD has rallied back to the 1.1382 resistance level, a zone where price previously rejected multiple times. Current structure suggests price is approaching a decision point, where it may either:
Form a double top or head-and-shoulders reversal
Or break out toward 1.1573, the next major resistance
Key Levels:
Resistance: 1.13825 → Critical decision zone
Support: 1.11442 → First major downside target
Deep Support: 1.10846 → Recent low
Scenarios to Watch:
🔹 Bearish Case (Primary Setup)
Price fails to break above 1.1382
Reversal candlestick forms below resistance
Breakdown may target:
1.1144 (first support)
1.1084 (continuation target)
🔹 Bullish Case (Less Likely Unless Confirmed)
Break and close above 1.1382
Bullish continuation to 1.1573
Would signal shift in medium-term trend bias
Chart Pattern Notes:
Price has made multiple lower highs, but also held structure
A triple top or reversal setup is forming unless bulls break decisively
Bearish wedge and neckline structures from past price action support downside risk
Fundamental Watch:
USD volatility from Fed speakers, PMI data
Eurozone risk sentiment and ECB inflation comments
Correlation with DXY (which is near support)
Conclusion:
📌 Rejection at 1.1382 likely leads to downside toward 1.1144
📌 Break above 1.1382 invalidates bearish setup and targets 1.1573
Wait for confirmation candle or momentum before execution.

EURUSD - Buy CMP - 27/05/2025Fundamentals: The euro has strengthened against the U.S. dollar, reflecting positive economic indicators in the Eurozone and a slight easing in U.S. inflation data.
Technical: The pair remains in a bullish trend across all timeframes, with key resistance at 1.1350 and support at 1.1300.
Bullish bounce off overlap support?The Fiber (EUR/USD) is falling towards the pivot and could bounce to the 1st resistance.
Pivot: 1.1263
1st Support: 1.1166
1st Resistance: 1.1423
Risk Warning:
Trading Forex and CFDs carries a high level of risk to your capital and you should only trade with money you can afford to lose. Trading Forex and CFDs may not be suitable for all investors, so please ensure that you fully understand the risks involved and seek independent advice if necessary.
Disclaimer:
The above opinions given constitute general market commentary, and do not constitute the opinion or advice of IC Markets or any form of personal or investment advice.
Any opinions, news, research, analyses, prices, other information, or links to third-party sites contained on this website are provided on an "as-is" basis, are intended only to be informative, is not an advice nor a recommendation, nor research, or a record of our trading prices, or an offer of, or solicitation for a transaction in any financial instrument and thus should not be treated as such. The information provided does not involve any specific investment objectives, financial situation and needs of any specific person who may receive it. Please be aware, that past performance is not a reliable indicator of future performance and/or results. Past Performance or Forward-looking scenarios based upon the reasonable beliefs of the third-party provider are not a guarantee of future performance. Actual results may differ materially from those anticipated in forward-looking or past performance statements. IC Markets makes no representation or warranty and assumes no liability as to the accuracy or completeness of the information provided, nor any loss arising from any investment based on a recommendation, forecast or any information supplied by any third-party.

EURUSD BUY TRADE PLANEUR/USD – May 27, 2025
📋 Plan Overview Table
Type Direction Confidence R:R Status
Conditional Buy 70% 3.0+ Active Setup
📈 Market Bias & Type
* Bias: Short-term bullish retracement within a broader corrective structure
* Type: Reversal/Continuation Hybrid
* Reversal off key H4 demand
* Continuation possibility toward D1 resistance
🔰 Confidence Level: 70%
Breakdown:
* 🔹 H1: Double bottom attempt near 1.1320 (short-term demand zone)
* 🔹 H4: Strong bullish structure since May 13th, pullback respecting bullish channel
* 🔹 D1: Price is in a consolidation range; last impulsive leg was bullish
* 🔹 Momentum: RSI divergence forming on lower timeframes (bullish hint)
📍 Entry Zones
* Primary Zone: 1.1320 – 1.1330 (current market zone, price is reacting)
* Secondary Zone: 1.1300 ± 10 pips (previous consolidation base + stop-hunt area)
❗ SL with Reasoning
* SL: 1.1270
* Reasoning: Break below recent higher low would invalidate the current bullish thesis and suggest stronger downside continuation
🎯 TP1/TP2/TP3 Targets
* TP1: 1.1385 (near structure mid-range)
* TP2: 1.1435 (recent swing high – May 27)
* TP3: 1.1485 (daily resistance zone)
🧠 Management Strategy
* Initial Risk: 0.5–1%
* Scaling In: Add on confirmed H1 bullish engulfing candle with volume
* Breakeven: Move SL to BE after price closes above 1.1360 H1 structure
* Partial Close: Take 50% profit at TP1, trail remainder to TP2 and beyond
⚠️ Confirmation Checklist
* ✅ Bullish H1 price action
* ⏳ Waiting for bullish engulfing or inside bar breakout
* 🔍 Monitor during London Open / NY overlap
* 🔄 Ideally with lower wick candle formation (rejection from zone)
⏳ Validity
* H1 Setup Valid for: 12–15 hours
* H4 Structure Valid for: 48–72 hours or until SL/TP hit
❌ Invalidation Conditions
* ❌ Clean break and close below 1.1280 on H1 and H4
* ❌ Failure to form bullish structure by next London session
🌐 Fundamental & Sentiment Snapshot
* 📰 USD: Mixed U.S. data, traders cautious ahead of next week's NFP
* 🏦 ECB: Hawkish undertones remain but rate cuts in Q3 on radar
* 💬 Sentiment: Euro stable to slightly bullish against major pairs; USD pressured by soft inflation expectations
📋 Final Trade Summary
This is a conditional buy setup with decent technical confluence and moderate fundamental tailwinds. Risk is well-defined, with an asymmetric reward potential if price rebounds off the H1/H4 demand region and resumes upward movement toward D1 resistance.
$EURUSD tops? Lets lookFX:EURUSD reached a high point on its chart in our retail range! Whats your bearish thoughts?

EUR/USD - Is the uptrend about to end?The EUR/USD currency pair has demonstrated a consistent uptrend on the 4-hour chart for approximately two weeks. This sustained bullish momentum has captured the attention of traders and analysts alike, who are now questioning whether the pair can maintain its upward trajectory or if a retracement is imminent as it approaches significant resistance levels.
Rising wedge
A closer examination of the price action reveals that EUR/USD has been advancing within a rising wedge formation. This technical pattern is generally considered bearish, as it often precedes a reversal or a breakdown rather than a continued rally. Rising wedges are characterized by converging trendlines, with price making higher highs and higher lows at a diminishing rate, which typically signals waning bullish momentum and a potential for sellers to regain control.
Strong resistance
Recently, the pair encountered a notable resistance zone around the 1.141 level. Upon reaching this area, EUR/USD faced a rejection, resulting in a pullback from its recent highs. While there is a possibility that the pair could make another attempt to test this resistance, the initial rejection suggests that the upward move may be losing steam. As a result, the likelihood of a retracement has increased, especially given the bearish implications of the rising wedge pattern.
Support/target zone
If the pair does indeed correct lower, a logical target for a cooldown would be the green support zone near 1.127. This level has previously acted as a strong support area, and it could serve as a foundation for buyers to step in once more, potentially setting the stage for another move higher. Until the resistance at 1.141 is decisively broken, caution is warranted, and a period of consolidation or a pullback towards support appears increasingly probable.
Thanks for your support.
- Make sure to follow me so you don't miss out on the next analysis!
- Drop a like and leave a comment!

EUR USD continue sell again for sniper entry Update Now EUR USD sell 1.13522 take profit 1.13088 stop lose 1.13692 May 27,2025 Guy follow my page and strategy. The loss is small, but the win is big. Please share like so that can profit others next sniper 🔫 soon📊📉📈

Strong market today solid reaction off the HTF levels.We’ll be live again tomorrow, breaking down structure, levels, and execution planning step by step.
Watch how price respects the range and flows from POI to POI.
Stay focused. Stay ARX. 👊

EUR/USD 15M | Bullish BAT Pattern | EURUSD | FOREXA precise Bullish BAT pattern has completed at point D (near 0.886 XA retracement), signaling a potential reversal from this harmonic support zone.
Entry Zone: 1.13415
Stop Loss: 1.13216
🔹 You can set your own profit target based on your preferred risk-reward ratio.
🟢 Watch for bullish confirmation at D. If held, this could trigger a strong intraday bounce. Structure + pattern = high-probability reversal zone.
