EURUSD: Strong Bearish Sentiment! Short!
My dear friends,
Today we will analyse EURUSD together☺️
The recent price action suggests a shift in mid-term momentum. A break below the current local range around 1.13300 will confirm the new direction downwards with the target being the next key level of 1.13052 and a reconvened placement of a stop-loss beyond the range.
❤️Sending you lots of Love and Hugs❤️
EURUSD_W trade ideas


Best Practice: Prepare, Assess, Plan Then TradeTraders are often eager to jump straight into the next trading session but this may not always be the best option to chose. It can be more beneficial to follow a regular pre-trading routine to note down important scheduled events, establish current trends, as well as meaningful support and resistance price levels, and importantly this doesn’t have to be time consuming.
This is not meant to be that trading ‘holy grail’ but more of an addition to your existing trading process or plan. Having a regular routine to establish important levels, indicator set-ups and price trends to be aware of during your trading day may help you make trading decisions in a more effective way.
This pre trading routine can also be helpful for traders that take longer term positions, as it’s still important to consider the longer-term weekly perspectives as well.
This routine can be carried out at the weekend and then monitored and, where necessary, modified during the week as price action develops for the particular CFD(s) you are trading.
1. Keep Informed of Important Data Releases
If there are several CFD’s you regularly trade and tend to stick with, make sure you have as much information about those assets as possible before you start trading.
Consider utilising the Pepperstone trading calendar to help keep you informed of any economic releases/company earnings data that might impact the CFD you are trading before the week/session starts.
Once you know the scheduled events ahead, you can ask yourself,
Could these impact my trading?
Could the market reaction to this new information increase the volatility of the CFD I am about to trade or already have a position in?
How may this impact my risk?
Knowing what it is expected by the market before a particular important economic data release, such as US Non-farm Payrolls, can help you assess positioning going into the release, gauge market reaction to the data, and then be prepared for any potential price sentiment change and/or increased volatility.
2. Be Aware of Potential Support and Resistance Levels
Ahead of your trading day, consider running through the Pepperstone charts of the CFD’s you are considering trading and make a note of 3 support and resistance levels, that you identify as being meaningful. To help you we have set out an example Trading Template below.
Daily: Level: Reason: Current Trend: Current Thoughts:
Support
1st:
2nd:
3rd
Resistance
1st
2nd
3rd
Keep this next to your trading screen, so you are aware of particular levels that may act as support and resistance, if prices move in that direction. This can help you to improve trade entry or assist you with the placement of a stop loss or take profit order.
If these levels are broken at any time, you can update the template with any new support/resistance levels during the trading period.
3. Be Aware of the Daily Trends – Focus on Bollinger Bands
Using the direction of the daily Bollinger mid-average can be helpful to gauge the direction of the daily trend.
If the,
Mid-average is moving up = price uptrend
Mid-average is moving down = price downtrend
Mid-average is flat = possible price sideways range
The daily and weekly perspectives are the most important to be aware of, so it can be beneficial to analyse the charts from the longest timeframe into the shortest as this allows you to build a better understanding of the dominant trends.
You can also note these trends on the Trading Template, so it’s available to you when you are trading.
4. Follow the Same Process for All Other Timeframes - 4 Hour, 1 Hour, Even Shorter if it Suits Your Trading.
You can carry out the routine outlined in point 3, for any timeframes you are trading.
Things to note,
Are there any new trends suggested within a shorter term perspective by the Bollinger mid-average?
If the direction of a shorter term mid-average has changed, it may be an indication of either a change or resumption of a longer term price trend.
If this trend change also looks to be resuming within the longer term perspectives, this could be a more important signal, as the resumption of an existing longer term trend may mean a more extended move in that direction.
Be aware, confirmation of a price trend change within a longer term perspective might mean it could take longer and offer less trading opportunities, as initially price moves may be less aggressive in nature.
5. Where, Within the Various Timeframes is Price in Relation to the Bollinger Bands?
As we have highlighted in a previous commentary (please take a look our past posts), Bollinger Bands can highlight increasing price volatility within a trend.
Things to note regarding Bollinger Bands,
Are the upper or lower bands being touched by prices within any of the timeframes?
Within a sideways range (flat mid-average) this might suggest price has reached either a support or resistance level, with potential for a reversal.
While being touched, are the upper and lower bands starting to widen which indicates increasing price volatility, or contract, which indicates decreasing price volatility?
Remember - widening bands within a confirmed trend highlight increasing volatility, suggesting the current price move might continue for longer than you may anticipate, while contracting bands, point to decreasing volatility, which may lead to a reduction in a particular CFDs price movement.
Do the timeframes align?
If they do it may suggest a stronger trading opportunity is evident. CFDs within trending markets seeing increasing volatility tend to offer greater potential than those that aren’t.
In this scenario it maybe worthwhile considering only trading with the trend, not trying to pick bottoms or tops of markets, or if you do, consider a more cautious approach to your trading by reducing the size of your position and risk.
The material provided here has not been prepared in accordance with legal requirements designed to promote the independence of investment research and as such is considered to be a marketing communication. Whilst it is not subject to any prohibition on dealing ahead of the dissemination of investment research, we will not seek to take any advantage before providing it to our clients.
Pepperstone doesn’t represent that the material provided here is accurate, current or complete, and therefore shouldn’t be relied upon as such. The information, whether from a third party or not, isn’t to be considered as a recommendation; or an offer to buy or sell; or the solicitation of an offer to buy or sell any security, financial product or instrument; or to participate in any particular trading strategy. It does not take into account readers’ financial situation or investment objectives. We advise any readers of this content to seek their own advice. Without the approval of Pepperstone, reproduction or redistribution of this information isn’t permitted.

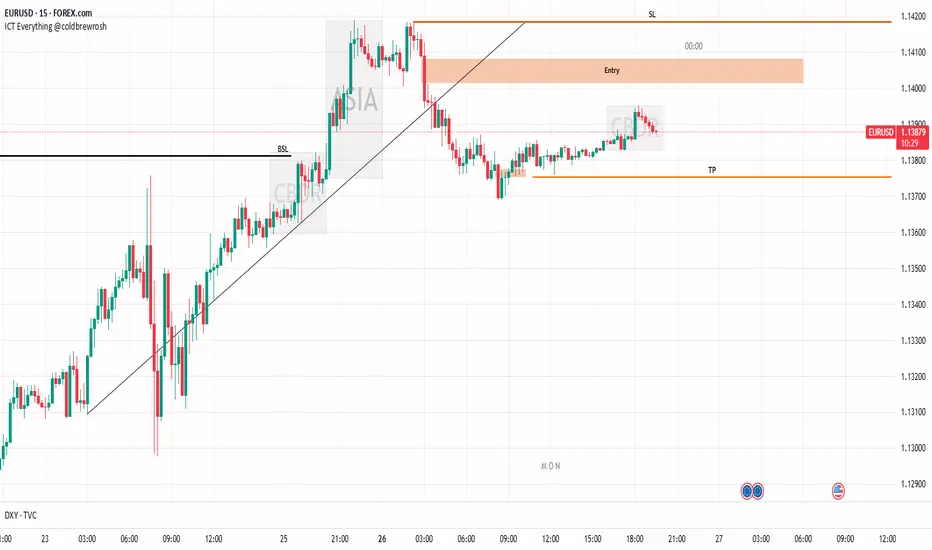
Short Setup ActivatedNote: If price reaches the daily order block before hitting the entry zone, the probability of a successful trade decreases.
🔍 My Trading Approach:
My trading and analysis are primarily based on market liquidity and how price tends to move toward areas where liquidity is pooled.
I use two main concepts in my strategy:
Fair Value Gaps (FVGs) to identify setups and entry zones
Measured Moves (MMs) to define target levels
🎯 Profit-Taking Rule:
I usually secure profits once price has moved at least 1.5 times the initial stop-loss distance in my favor. FOREXCOM:EURUSD

EURUSD sell analysis/ideaThis trade is based on the daily and 4-hour timeframes and is executed using reversal trading and trend formation. Complete explanation in the video!

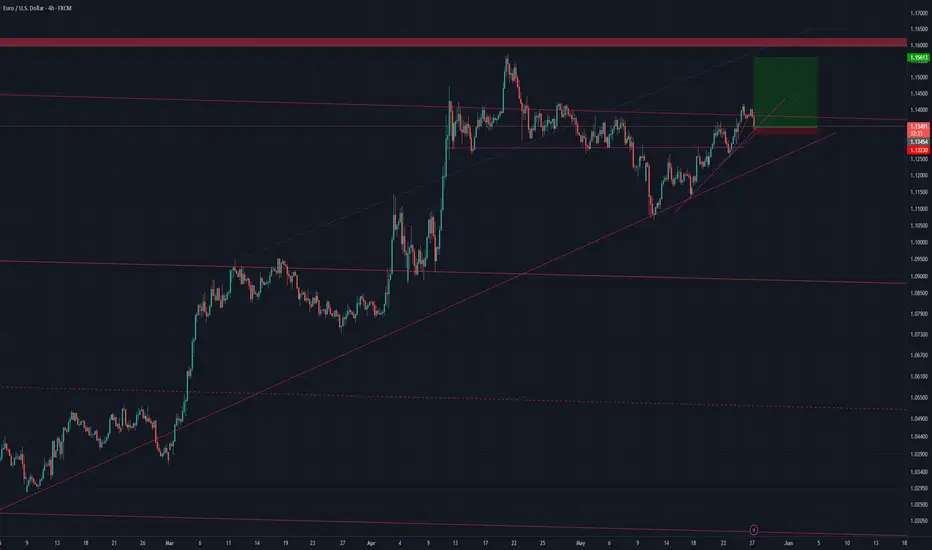
Eurusd long for a possible double toplooks like bullish continuation is possible.
I'd like to see price retesting the 1.16 area and look for shorts if there is a rejection
Update EUR USD may 27,2025 sell1.13793 take profit 1.13115 stop Update EUR USD may 27,2025 sell1.13793 take profit 1.13115 stop lose 1.14119 Good sniper entry follow my page guys so that can profit others📊📉📈
Risk Warnings and Disclaimers
You understand and acknowledge that there is a high degree of risk involved in trading. Following any strategies or investment methods may lead to potential losses. The content on the site is provided by our contributors and analysts for information purposes only. You are solely responsible for determining whether any trading assets, securities, strategy, or any other product is suitable for investing based on your own investment objectives and financial situation.

trap ya “liquidity grab” jaisa zone ho sakta hai.Jahan sab buyers wave 5 ko continuation samajh ke buy karein,
Tumhara analysis keh raha hai ki wahan se reversal hoga.
Ye trap ya “liquidity grab” jaisa zone ho sakta hai.
Chart me price ne 5 wave ka bullish pattern complete kiya.
Ab wo Supply Zone me hai jahan se girne ke chances hain.
Tum expect kar rahe ho BOS ke saath downtrend shuru hoga.
Final target lower demand zones tak hai.

EURUSD is moving within the 1.12265 - 1.14220 range 👉🏼 Possible scenario:
The euro (EUR) rose 0.20% as investors grew cautious over a sweeping U.S. tax and spending bill that could sharply widen the federal deficit. The proposal has intensified doubts about the sustainability of U.S. debt, reducing demand for dollar assets. Ongoing fiscal uncertainty continues to erode confidence in U.S. financial instruments, limiting the dollar’s recovery as markets remain alert to potential shifts in monetary policy and interest rates.
On May 27, two key U.S. economic indicators—Durable Goods Orders (12:30 p.m. UTC) and CB Consumer Confidence (2:00 p.m. UTC)—are set to be released and could influence market movements.
✅ Support and Resistance Levels
Now, the support level is located at 1.12265.
Resistance level is located at 1.14220.

EURUSDThis is the most awaited push.
With the re-tests and each weak hand to strong hand transfer I see this level as a very strong support and the area to start the most expected rally of the USD alternative.

Market next move . Support Fatigue / Breakdown Risk
Observation: Price has tested the red support zone multiple times.
Disruption: Repeated tests of support often weaken it. If it breaks, a sharp drop may follow.
Implication: Instead of bouncing, EUR/USD could slide below 1.13200, triggering stop-losses.
---
2. Lack of Bullish Volume Confirmation
Observation: The recent candles show low volume on bullish attempts.
Disruption: Weak demand at support indicates hesitation among buyers.
Implication: Without a volume spike, any bounce may be short-lived or fail entirely.
---
3. Bearish Momentum Still Intact
Observation: Price action shows consistent lower highs and lower lows.
Disruption: The short-term trend is still bearish, so this could be a pause before continuation down.
Implication: A false bullish break could trap long traders before a drop resumes.
---
4. Fundamental Risks (USD Strength)
Disruption: Any U.S. data surprises or hawkish Fed comments (noted by U.S. event icons on the chart) could push USD higher, dragging EUR/USD down.
Implication: Technical bounce setups could be invalidated by macro events.

EURUSD Bearish Setup | Head and Shoulders BreakdownEUR/USD has formed a clear Head and Shoulders pattern on the 15-minute chart, indicating a potential short-term trend reversal.
Key Technical Points:
Left Shoulder, Head, and Right Shoulder are well-defined.
Price has broken below the neckline support around 1.1375, confirming bearish intent.
Volume confirms the selling pressure on the right shoulder breakdown.
Target area aligns with previous price action around 1.1294, a likely support zone.
Risk is controlled with a stop above the invalidation level near 1.1376.
This setup reflects classical price action structure and could offer a clean downside move if momentum continues.
📊 Pure technical structure — pattern-based idea with disciplined trade planning.

EURUSD Sellers In Panic! BUY!
My dear friends,
Please, find my technical outlook for EURUSD below:
The instrument tests an important psychological level 1.1346
Bias -Bullish
Technical Indicators: Supper Trend gives a precise Bullish signal, while Pivot Point HL predicts price changes and potential reversals in the market.
Target - 1.1371
About Used Indicators:
Super-trend indicator is more useful in trending markets where there are clear uptrends and downtrends in price.
Disclosure: I am part of Trade Nation's Influencer program and receive a monthly fee for using their TradingView charts in my analysis.
———————————
WISH YOU ALL LUCK

CHECK EURUSD SIGNAL AND READ CAPTION(eurusd) sell zone
(trade satup)
entry point (1.13470) to (1.13400) 📊
first target (1.13260)
2nd target (1.13080) 📊
last target (1.12800) 📊
stop loss (1.13650)❌

Trading Signal for EUR/USD buy above 1.1335 or sell below 1.1418Early in the American session, the euro is trading around 1.1342, undergoing a technical correction after reaching a high of 1.1418 during the European session.
The euro reached price levels seen at the end of April, and we believe it could continue to fall in the coming hours, REACHING THE 21sma at 1.1335.
On the H4 chart, we can see that the euro has formed an uptrend channel since May 11. It is likely that after a technical correction, EUR/USD could rebound around 1.1335, which will be seen as a buying opportunity with targets at the 7/8 Murry level at 1.1418.
Short Setup Activated🔍 My Trading Approach:
My trading and analysis are primarily based on market liquidity and how price tends to move toward areas where liquidity is pooled.
I use two main concepts in my strategy:
Fair Value Gaps (FVGs) to identify setups and entry zones
Measured Moves (MMs) to define target levels
🎯 Profit-Taking Rule:
I usually secure profits once price has moved at least 1.5 times the initial stop-loss distance in my favor.
FOREXCOM:EURUSD
EURUSD Trade Executed London May 25EURUSD Trade Executed London
May 25
PreMarket Analysis
Parent bias Bull
Previous session
Monthly
Expansion cycle opening above the .618 in a Premium, with a sell off wick, expecting the expansion to continue.
Weekly
Candle fractal is a expansion with equal highs and FVG as magnet to reach for.
Fridays delivery expanded in Asia consolidated in London then expanded to take buy side, retraced lower in London close, news manipulation to expand to the equal highs, did not take but went in to consolidation
May 26 Ideas
Premarket analysis logic suggested that Asia will expand to equal highs. It did. When price did not take the equal highs, I suspected a consolidation until London macro and anticipated a expansion move, to the down side.
London Framework
Trade framework
* Price in a premium market -DXY in a discount market
*1:39 fake swing,I did consider that price may want to take the equal highs it created and to be cautious
*1:55 price rolls over, elements of 2022 model were in play
*2:24 price swings up again with 2022 candle formation, swing low, displacement, FVG
3:00 swing low broken
3:02 entry with a fumble on my entry price
5:01 exit at second target
Very happy with the analysis and logic to frame this trade. My entry could have been tighter I lost 8 pips trying to enter, all good.

EUR/USD Holds Above 16-Year ChannelThe U.S. dollar, pressured by debt concerns, has declined toward critical 2025 lows near the 98 level. Meanwhile, the euro has stabilized near 1.1380, now trading above the upper boundary of a 16-year descending channel originating from the 2008 peak and extending through 2024.
This breakout positions EUR/USD for a potential long-term bullish move—provided the DXY confirms further downside. A firm monthly close above 1.16 would confirm the breakout, setting sights on highs from 2018 and 2021, between 1.20 and 1.24.
On the downside, key pullback levels are 1.1270, 1.1140, and 1.1070. A break below those could extend pressure toward 1.0990 and 1.0890.
- Razan Hilal, CMT

Euro Nears $1.14 as Dollar is PressuredEUR/USD climbed to $1.1395, approaching a one-month high as the dollar softened amid mounting U.S. fiscal concerns and uncertainty over Trump’s tax-and-spending bill. Risk sentiment improved after Trump delayed a planned 50% tariff on EU goods, easing fears of a transatlantic trade clash. The euro also gained from ECB President Lagarde’s remarks that it could strengthen as a global currency if EU institutions were reinforced.
Resistance is at 1.1425, with additional levels at 1.1460 and 1.1580. Support begins at 1.1260, followed by 1.1100 and 1.1050.

EURUSD 1DWave 3 continues with strong momentum; minuette wave 5 is unfolding. Wave 4 may form a triangle, though an alternate count remains on the table. Invalidation comes on a break below the labeled Wave 4

EURUSD INTRADAY uptrend supported at 1.1300Trend Overview:
EUR/USD continues to exhibit a bullish price structure, supported by a rising trendline and higher lows. Recent intraday action reflects a corrective pullback, suggesting a temporary pause within the broader uptrend.
Key Technical Levels:
Support: 1.1300 (primary), followed by 1.1235 and 1.1180
Resistance: 1.1430 (initial), then 1.1470 and 1.1500
Technical Outlook:
A pullback toward 1.1300, which coincides with the previous consolidation zone, may present a bullish continuation setup. A confirmed bounce from this level could open the path toward 1.1430, with 1.1470 and 1.1500 as potential longer-term targets.
However, a daily close below 1.1300 would indicate a breakdown of near-term bullish momentum. This scenario would increase the likelihood of a deeper correction toward 1.1235, and possibly 1.1180.
Conclusion:
The outlook for EUR/USD remains constructively bullish, contingent on the 1.1300 support holding. A bounce from this level would reinforce the uptrend. Conversely, a decisive break below 1.1300 would shift the short-term bias to bearish, suggesting further downside toward the 1.1200 area.
This communication is for informational purposes only and should not be viewed as any form of recommendation as to a particular course of action or as investment advice. It is not intended as an offer or solicitation for the purchase or sale of any financial instrument or as an official confirmation of any transaction. Opinions, estimates and assumptions expressed herein are made as of the date of this communication and are subject to change without notice. This communication has been prepared based upon information, including market prices, data and other information, believed to be reliable; however, Trade Nation does not warrant its completeness or accuracy. All market prices and market data contained in or attached to this communication are indicative and subject to change without notice.

EURUSD – Bouncing on trendline amid EU optimismEURUSD continues to hold a strong upward momentum within a short-term ascending channel. After retesting the channel bottom around the 1.1360 zone, price is showing signs of rebounding, and a "small double bottom" pattern appears to be forming. If confirmed, EURUSD may rally toward the resistance area at 1.1447.
Factors supporting the bullish trend:
Trump temporarily postponed the 50% tariff on EU goods until July 9 → Trade tensions ease, supporting the euro.
Germany's Q1 GDP grew by 0.4% – above expectations → Boosts confidence in Eurozone recovery.
The ECB aims to elevate the euro’s global role (digital euro, cross-border payment improvements).
Potential scenario:
If the 1.1360 zone holds (channel bottom + EMA support), there is a high chance that price will retest and break above the 1.1447 resistance.

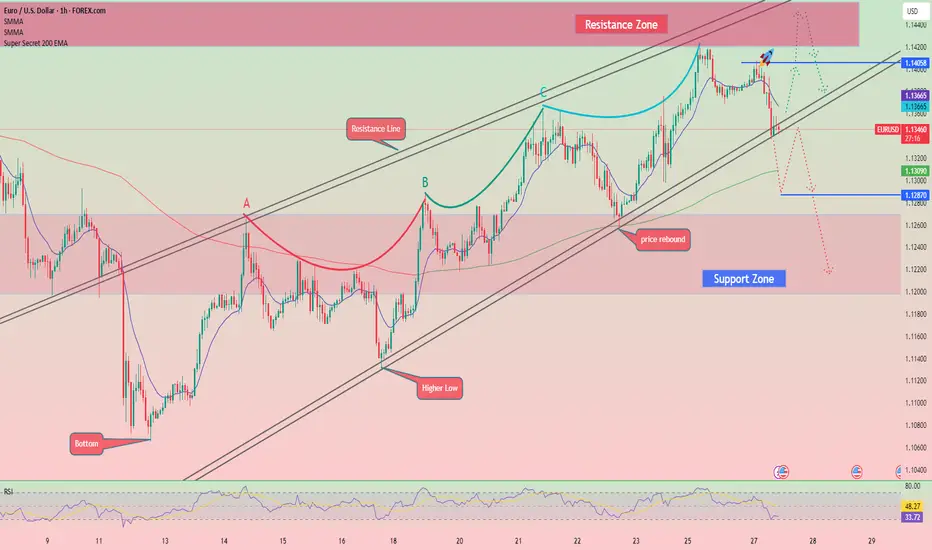
EURUSD H1 correction?My vision where go price on Elliot waves.
Now we on bullish trend but it can change to bearish.
Wave 5 is not finnish yet what will be next correction or we break zone 1.138-1.14 and price go upper.
Wave Indicator shows momentum slowing down, hinting at a potential reversal.
Price has peaked and is stalling around 1.13649, suggesting resistance.
Support/Resistance Levels
Resistance: 1.1380 region .
Support: Around 1.122, which is:
A key Fibonacci level.
Likely target for the end of wave C in the correction.
Fundamental Analysis
ECB monetary policy: If the ECB signals dovishness (rate cuts or economic concerns), EUR weakens.
Eurozone inflation: Higher inflation can support EUR via hawkish ECB tone.
German economic data: Weak data = EUR bearish.
U.S. Side (USD)
Federal Reserve policy: If Fed holds rates higher for longer, USD strengthens.
U.S. inflation, jobs data: Strong numbers support the dollar.
