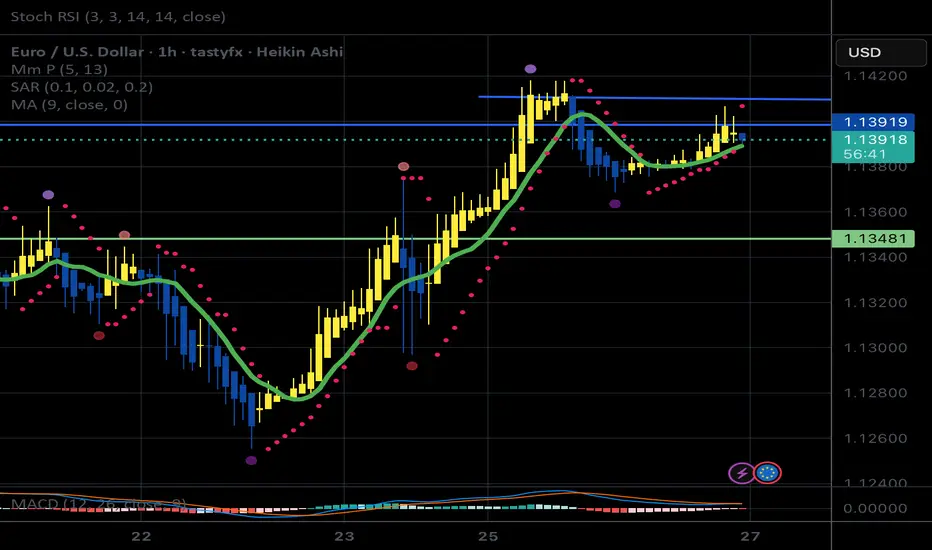
EUR/USD LONG EUR/USD LONG " break of a resistance area and retest it + 50% fib retracement + 50 ema dynamic support "
EURUSD_W trade ideas

EUR USD Entry Setup EUR USD has formed a bullish break and retest and has also retraced back to the 50-618 FIB retracement level.
The trend is bullish so we will continue to look for buying opportunities

EUR/USD Weakens as Yield Spread Narrows Despite USD HeadwindsTechnical Analysis – EUR/USD (1H Chart)
EUR/USD is currently trading around 1.1367, slipping after a failed attempt to break above the recent swing high of 1.1406. The pair has now broken below a short-term ascending trendline and is testing the key support drawn from the last bullish leg at 1.1368. Breaking of this level can push the pair lower.
The break of trendline support and the MACD-RSI alignment suggest that the bears are gaining momentum. If sellers can sustain pressure below 1.1358, lower Fibonacci targets near 1.1344 and 1.1330 may be tested.
Conversely, a return above 1.1383 would indicate buyer resilience and could trigger a retest of 1.1406.

EUR/USD Rejected From Major Supply – Is a Bigger Drop Brewing?EUR/USD is showing signs of distribution around the key supply zone at 1.14380. Price failed to break above twice, forming a possible lower high, signaling that smart money might be preparing for a deeper move down.
Key Levels to Watch:
Supply Zone: 1.14380 – heavy selling pressure
First Target: 1.08667 – strong historical support
Final Target: 1.03215 – major demand zone (watch for bullish reaction here)
Market Drivers:
Upcoming high-impact U.S. events (marked below the chart) could fuel a bearish reversal, especially if USD strength returns.
Possible Trade Setup:
Sell Entry: Below 1.13400 (confirmation after rejection)
SL: Above 1.14000
TP1: 1.08667
TP2: 1.03215
Bias:
Bearish – Unless we see a strong breakout above 1.144, sellers remain in control.
---
Is EUR/USD headed for a sharp drop, or will bulls defend the 1.13s?
Comment your setup and let’s discuss!
#EURUSD #ForexAnalysis #LuxAlgo #TechnicalAnalysis #SupplyAndDemand #ForexSignals #BearishBias #TradingView

Trade Idea: EUR/USD Bearish BiasPrice has finally broken below the key support zone with strong bearish momentum, confirming potential trend shift. The plan now is to wait for a break-and-retest of the broken support area (now resistance) around 1.1365–1.1385. Look for bearish rejection signals to enter short, targeting the next demand zone near 1.1315–1.1300.
📉 Bias: Bearish
🔍 Confirmation: Retest & rejection at previous support
🎯 Target: 1.1315
🛑 Invalidation: Clean break back above 1.1395
"Let the market come to you—don’t chase, wait for the retest."

CHECK EURUSD SIGNAL READ CAPTAINeurusd signal technical analysis satup 👇🏼
(eurusd ) sell zone
( TRADE SATUP)
ENTRY POINT (1.13600) to (1.13550) 📊
FIRST TP (1.13350)
2ND TARGET (1.13100) 📊
LAST TARGET (1.12800) 📊
STOP LOOS (194.800)❌
FALLOW RISK MANAGMENT

EURUSD | 23.05.2025SELL 1.13300 | STOP 1.14400 | TAKE 1.11800 | In the short term, we expect a classic reversal of price action on the background of overboughtness.

No change for EURUSDEURUSD remains in an uptrend, holding steady around the 1,1400 level.
All open buy positions should stay active but with reduced risk.
At these levels, the risk-to-reward ratio isn’t favorable for new entries.
Watch for a pullback – it could offer better entry opportunities. Don’t rush!

EURUSD Sell Setup- Go for short sell then manage your trade
- potentially go lower
A Message To Traders:
I’ll be sharing high-quality trade setups for a period time. No bullshit, no fluff, no complicated nonsense — just real, actionable forecast the algorithm is executing. If you’re struggling with trading and desperate for better results, follow my posts closely.
Check out my previously posted setups and forecasts — you’ll be amazed by the high accuracy of the results.

🇪🇺 EURUSD 15min Technical & Fundamental Analysis🇪🇺 EURUSD 15min Technical & Fundamental Analysis
EUR/USD has reached a 4-week high at 1.14200, following President Trump's decision to delay tariffs on EU goods until July 9 — easing trade tensions and reinforcing investor confidence in the euro.
On the 15-minute chart, we’re seeing strong bullish momentum supported by clean price structure and liquidity patterns.
📈 Technical Structure
Price confirmed bullish intent after breaking below minor key support at 1.13800, triggering sell-side liquidity. This liquidity grab was followed by a strong bullish push, forming new Higher Highs.
The pair then broke above minor key resistance at 1.13960, where accumulation of retail buy orders occurred. Price is now sitting inside the liquidity zone, signaling a potential next move is near.
📊 Trade Setup
📍 Area of Interest (AOI): 1.13990
🛡 Stop-Loss: 1.13890 (just below liquidity zone)
🎯 Target Profit: Dynamic based on continuation above 1.14200 highs
This setup is ideal for short-term traders looking to capitalize on liquidity grabs and trend continuation.
📰 Fundamental Outlook
🇺🇸 USD Weakness Continues
Fiscal Concerns: Rising U.S. debt and widening deficits are weighing on dollar sentiment.
Investor Sentiment: A shift away from U.S. assets reflects uncertainty and risk-off positioning.
Market Performance: The dollar has fallen nearly 4% since early April, its worst stretch since 2023.
📌 Disclaimer:
This is not financial advice. Always wait for proper confirmation before executing trades. Manage risk wisely and trade what you see—not what you feel.

I am back with a sell on EURUSDOkay, my trade idea is from my strategy, first of all my overall trend is a bulish trend, checked an confirmed on the 4hr but here there is a shift in mss on the 30m, so I am selling to 50% of the impulsive move, I am positive about this , so trade

EURUSD COT and Liquidity AnalysisHey what up traders welcome to the COT data and Liquidity report. It's always good to go with those who move the market here is what I see in their cards. I share my COT - order flow views every weekend.
🎯 Non Commercials closed longs and added shorts.It still seems to me like EUR dropping lower but it will have to take liquidity levels above.
📍Please be aware that institutions report data to the SEC on Tuesdays and data are reported on Fridays - so again we as retail traders have disadvantage, but there is possibility to read between the lines. Remember in the report is what they want you to see, that's why mostly price reverse on Wednesday after the report so their cards are hidden as long as possible. However if the trend is running you can read it and use for your advantage.
💊 Tip
if the level has confluence with the high volume on COT it can be strong support / Resistance.
👍 Hit like if you find this analysis helpful, and don't hesitate to comment with your opinions, charts or any questions.
Analysis done on the Tradenation Charts
Disclosure: I am part of Trade Nation's Influencer program and receive a monthly fee for using their TradingView charts in my analysis.
"Adapt what is useful, reject what is useless, and add what is specifically your own."
— David Perk aka Dave FX Hunter ⚔️

Skeptic | Watchlist #1 - May 27, 2025: XAG/USD, EUR/USD, USD/JPYHey everyone, Skeptic here! Starting today, I’m kicking off a daily watchlist to share the setups I’m eyeing! 😎 These are the pairs I’m personally trading or watching for trigger activations. Feel free to create a dedicated section in your TradingView called “ Skeptic ” and plug in this watchlist with the triggers I provide. Then, based on your own strategy, jump into trades at those key levels if they align with your plan. My watchlist format will include a screenshot of the 4H or 1H timeframe with long/short triggers marked on the chart. If needed, I’ll add quick explanations or tips, but I’m keeping it short, sharp, and to the point to maximize your value. The goal? Help you blend these setups with your own strategy without overloading you with fluff. Let’s dive into today’s Daily Forex Watchlist!
👀XAG/USD
Long Trigger : 33.68855,
Short Trigger : 31.91991.
👀EUR/USD
Long Trigger : 1.14183,
Short Trigger : 1.12663.
👀USD/JPY
Long Trigger : 144.125,
Short Trigger : 142.218.
💬 Let’s Chat!
If this watchlist sparked some ideas, give it a quick boost—it means a ton! 😊 Thanks for joining me— let’s grow together! ✌️

EURUSDExciting news for the EU! It looks like we may be on the brink of a bullish continuation. Looking at the 4-hour timeframe, it's clear that price is currently in an uptrend. Let's keep an eye on those movements!

EURUSD I Weekly CLS, Daily CLS I Model 2Hey, Market Warriors, here is another outlook on this instrument
If you’ve been following me, you already know every setup you see is built around a CLS range, a Key Level, Liquidity and a specific execution model.
If you haven't followed me yet, start now.
My trading system is completely mechanical — designed to remove emotions, opinions, and impulsive decisions. No messy diagonal lines. No random drawings. Just clarity, structure, and execution.
🧩 What is CLS?
CLS is real smart money — the combined power of major investment banks and central banks moving over 6.5 trillion dollars a day. Understanding their operations is key to markets.
✅ Understanding the behaviour of CLS allows you to position yourself with the giants during the market manipulations — leading to buying lows and selling highs - cleaner entries, clearer exits, and consistent profits.
🛡️ Models 1 and 2:
From my posts, you can learn two core execution models.
They are the backbone of how I trade and how my students are trained.
📍 Model 1
is right after the manipulation of the CLS candle when CIOD occurs, and we are targeting 50% of the CLS range. H4 CLS ranges supported by HTF go straight to the opposing range.
📍 Model 2
occurs in the specific market sequence when CLS smart money needs to re-accumulate more positions, and we are looking to find a key level around 61.8 fib retracement and target the opposing side of the range.
👍 Hit like if you find this analysis helpful, and don't hesitate to comment with your opinions, charts or any questions.
⚔️ Listen Carefully:
Analysis is not trading. Right now, this platform is full of gurus" trying to sell you dreams based on analysis with arrows while they don't even have the skill to trade themselves.
If you’re ever thinking about buying a Trading Course or Signals from anyone. Always demand a verified track record. It takes less than five minutes to connect 3rd third-party verification tool and link to the widget to his signature.
"Adapt what is useful, reject what is useless, and add what is specifically your own."
— David Perk aka Dave FX Hunter ⚔️

EurUsdI predict eurusd will be in a bullish trend.
entry point: 1.1420
stop loss: 1.1350
take profit: 1.1570
150 pip reward
bullish on EurUsdstructure is key fundamentals when you are trading.
EU, is super bullish- however, we found a nice opportunity to take this buy. price broke structure at 1.13700 on H4 TF, we wait for price to come back down to key level at 1.13321 to take the buy.
target TP#1 1.14900
targetTP#2 1.15730

EURUSD H4 | Bearish Drop Based on the H4 chart analysis, we can see that the price is currently at our sell entry at 1.1397 (Bearish OB)
Our take profit will be at 1.1342, a pullback support.
The stop loss will be placed at 1.1457, above the 161.8% Fibo extension.
High Risk Investment Warning
Trading Forex/CFDs on margin carries a high level of risk and may not be suitable for all investors. Leverage can work against you.
Stratos Markets Limited (tradu.com ):
CFDs are complex instruments and come with a high risk of losing money rapidly due to leverage. 63% of retail investor accounts lose money when trading CFDs with this provider. You should consider whether you understand how CFDs work and whether you can afford to take the high risk of losing your money.
Stratos Europe Ltd (tradu.com ):
CFDs are complex instruments and come with a high risk of losing money rapidly due to leverage. 63% of retail investor accounts lose money when trading CFDs with this provider. You should consider whether you understand how CFDs work and whether you can afford to take the high risk of losing your money.
Stratos Global LLC (tradu.com ):
Losses can exceed deposits.
Please be advised that the information presented on TradingView is provided to Tradu (‘Company’, ‘we’) by a third-party provider (‘TFA Global Pte Ltd’). Please be reminded that you are solely responsible for the trading decisions on your account. There is a very high degree of risk involved in trading. Any information and/or content is intended entirely for research, educational and informational purposes only and does not constitute investment or consultation advice or investment strategy. The information is not tailored to the investment needs of any specific person and therefore does not involve a consideration of any of the investment objectives, financial situation or needs of any viewer that may receive it. Kindly also note that past performance is not a reliable indicator of future results. Actual results may differ materially from those anticipated in forward-looking or past performance statements. We assume no liability as to the accuracy or completeness of any of the information and/or content provided herein and the Company cannot be held responsible for any omission, mistake nor for any loss or damage including without limitation to any loss of profit which may arise from reliance on any information supplied by TFA Global Pte Ltd.
The speaker(s) is neither an employee, agent nor representative of Tradu and is therefore acting independently. The opinions given are their own, constitute general market commentary, and do not constitute the opinion or advice of Tradu or any form of personal or investment advice. Tradu neither endorses nor guarantees offerings of third-party speakers, nor is Tradu responsible for the content, veracity or opinions of third-party speakers, presenters or participants.

EURUSD Bullish SentimentAll currency pairs are analyzed using technical analysis and price action. Overall sentiment is bullish. Always utilize proper R/R when trading.

Technical Analysis for EUR/USD (4-Hour Chart)The EUR/USD pair is currently displaying a strong bullish structure, characterized by a sequence of Higher Highs (HH) and Higher Lows (HL). Price action has been respecting the ascending trendline, which reinforces the ongoing upward momentum.
A Buy Stop order is placed at 1.14234, just above a recent resistance level, anticipating a breakout continuation. The Stop Loss (SL) is set at 1.13651, safely below the most recent higher low, providing a cushion against false breakouts.
Two Take Profit (TP) levels are marked:
TP1: 1.1482, aligning with a key resistance zone from previous structure.
TP2: 1.1540, which extends into a zone of untested highs, serving as an optimistic target in case of strong bullish momentum.
The RSI (14) currently reads 64.07, approaching the overbought threshold of 70. This suggests bullish strength, although traders should monitor for potential divergence or exhaustion signs if price nears the TP levels.
With a lot size of 0.03 and an equity of $10,000, this trade maintains a conservative risk exposure, suitable for trend continuation setups.
EUR/USD remains bullish in the short-term. A break above 1.14234 could open the door to further gains toward 1.1482 and 1.1540, provided the trendline holds and RSI doesn't show significant bearish divergence. Maintain tight risk management and monitor price reaction at key levels.

Buying more EURO dollarsLet's get this euro dollars going higher ........
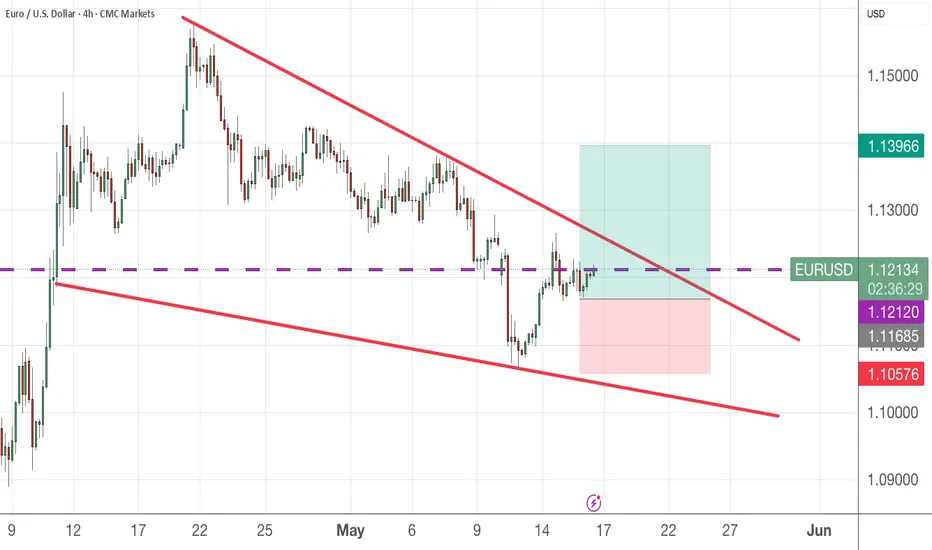
1.1212 is a resistance turned support now. I expect it to break above soon.
Deciphering EURUSD —Highest Level Since 2018 (1.40)This was a hard chart, I couldn't quite put my finger on it. I had to check multiple timeframes and several indicators, it was all mixed, plus, I had the geopolitical landscape in mind which made it even harder. All is clear after looking at the monthly timeframe. The weekly and daily MACD were also of help. MA200 revealed the trend. The RSI as well.
Here is the conclusion: The Euro is going to rally against the dollar. Next long-term target is 1.40 as shown on the chart. There will be a strong rise on this pair.
Current monthly candle is quite revealing, this month will close ultra-strong, super bullish signal. Four months closing green. Rising volume.
I don't know how you trade this stuff but the trend is up. Betting with the trend can increase positive results. EURUSD is going up. Up, up, up, up, up, up, up.
Namaste.

Short on EuroTrade as per your confluences & risks
I have the right to go wrong
My probability is just above 60%
