Mitigation Block in Forex Trading: What It Is and How to Use It?What a Mitigation Block Is, and How You Can Use It When Trading Forex?
Understanding specific market mechanisms like mitigation blocks may enhance strategic decision-making. This article delves into the concept of mitigation blocks, detailing their definition, function, and practical application within forex.
Definition and Function of a Mitigation Block
A mitigation block in forex trading refers to a specific order block on a chart that indicates where previous movements have stalled and reversed, marking it as a potential area for future market turns. This concept within the Smart Money framework is crucial for traders looking to manage their positions by taking advantage of strategic entry and exit points.
The idea behind these areas is rooted in the dynamics of supply and demand within forex. When a currency pair reaches a level where buyers or sellers have previously entered the market in force, causing a reversal, it suggests a potential repeat of such actions when the price returns to the area.
Characteristics and How to Identify a Mitigation Block
Mitigation blocks can be bullish or bearish, each with distinct characteristics:
- Bearish Mitigation Block: This type forms during an uptrend and is identified by a significant peak followed by a decline and a failed attempt to reach or surpass the previous high, creating a lower high. When prices drop below the previous low, the order block above the low becomes mitigation. It may be characterised by an increase in selling volume as the price approaches the level, signalling resistance and a potential downward reversal.
- Bullish Mitigation Block: Conversely, a bullish type is established during a downtrend. It is characterised by a significant trough, followed by a rise to form a higher low, and a failure to drop below the previous low. As the pair moves up, the order block below the high marks mitigation one. This area often shows an increase in buying volume as the price approaches, indicating support and a potential upward reversal.
Mitigation Block vs Breaker Block
Mitigation and breaker blocks are both significant in identifying potential trend reversals in forex trading, but they have distinct characteristics that set them apart. A mitigation block forms after a failure swing, which occurs when the market attempts but fails to surpass a previous peak in an uptrend or a previous trough in a downtrend. The pattern indicates a loss of momentum and a potential reversal as the price fails to sustain its previous direction.
On the other hand, a breaker block is characterised by the formation of a new high or low before the market structure is broken, indicating that liquidity has been taken. This means that although the trend initially looked set to continue, it quickly reverses and breaks structure.
In effect, a breaker appears when the market takes liquidity beyond a swing point before reversing the trend. A mitigation appears when the price doesn’t move beyond the trend’s most recent high or low, instead plotting a lower high or higher low before reversing the trend.
How to Use Mitigation Blocks in Trading
Areas of mitigation in trading can be essential tools for identifying potential trend reversals and entry points. When they align with a trader's analysis that anticipates a reversal at a certain level, it can serve as a robust confirmation for entry.
Traders can effectively utilise these zones by simply placing a limit order within the area once it is considered valid. Validation occurs after a new peak or trough is established following the initial failure swing that forms the mitigation area.
If a liquidity void or fair-value gap is present, the trader may look for such a gap to be filled before their limit order is triggered, potentially offering a tighter entry. Stop losses might be placed beyond the failure swing or the most extreme point.
Furthermore, if a mitigation block is identified on a higher timeframe, traders can refine their entry by switching to a lower timeframe. This approach allows for a tighter entry point and potentially better risk management, as it offers more granular insight into the momentum around the area.
Common Mistakes and Limitations
While these blocks are valuable for forex trading, they come with potential pitfalls and limitations that traders should know.
- Overreliance: Relying solely on mitigation blocks without corroborating with other trading indicators can lead to misjudged entries and exits.
- Ignoring Context: Using these zones without considering the broader market conditions may result in trading against a prevailing strong trend.
- Misinterpretation: Incorrect identification can lead to erroneous trading decisions, especially for less experienced traders.
- False Signals: Mitigation blocks can sometimes appear to signal a reversal but instead lead to a continuation of the trend, trapping traders in unfavourable positions.
The Bottom Line
Understanding mitigation blocks offers traders a strategic edge in navigating the forex market. They can be vital for recognising potential price reversals and improving trading outcomes.
FAQs
What Is a Mitigation Block?
A mitigation block in forex trading is an order block that identifies potential reversal points. It signals where a currency pair has previously stalled, indicating strong buying or selling pressure, suggesting a potential for similar reactions in future encounters with these levels.
How Do You Identify a Mitigation Block?
Mitigation blocks are identified by analysing charts for areas where previous highs or lows were not surpassed, leading to a reversal. Traders look for a sequence of movements, including a swing high or low followed by a retracement that fails to exceed the previous swing.
What Is the Difference Between a Breaker Block and a Mitigation Block?
While both indicate potential reversals, a breaker block forms when the price makes a new high or low before reversing, suggesting a temporary continuation of the trend. In contrast, a mitigation block forms without creating a new extreme, indicating a direct loss of momentum and an immediate potential for reversal.
This article represents the opinion of the Companies operating under the FXOpen brand only. It is not to be construed as an offer, solicitation, or recommendation with respect to products and services provided by the Companies operating under the FXOpen brand, nor is it to be considered financial advice.
EURUSD_W trade ideas

EURUSD: Bears Will Push
The recent price action on the EURUSD pair was keeping me on the fence, however, my bias is slowly but surely changing into the bearish one and I think we will see the price go down.
Disclosure: I am part of Trade Nation's Influencer program and receive a monthly fee for using their TradingView charts in my analysis.
❤️ Please, support our work with like & comment! ❤️

EURUSD-SELL strategy 3D chart GANNThe pressure is still upwards, but overall we are close to a reversal considering the ascending triangle, the Hammer Top and overbought RSI. We may still see 1.1650-1.1700 area before the correction, but feel we slowly should scale into a SELL mode.
Strategy SELL @ 1.1625-1.1675 and take profit near 1.1250 area.

EURUSD| Buy Flow In PlayGot price respecting my top-down flow — 4H to 5M is in full alignment right now. We swept key liquidity levels and price held structure clean, giving me reason to look for a buy continuation.
Could’ve posted a more detailed breakdown (order blocks, FVGs, etc.), but I’ll save that sauce for another time. Just curious what y’all see here — feel free to share your take on this play. I’m always open to sharp minds tapping in.
Let’s see how this unfolds. 🧠💧
#EURUSD #SmartMoneyConcepts #LiquiditySweep #PriceActionTrading #TopDownAnalysis #InducementKing
Bless Trading!

EUR/USD Best Place To Sell To Get 250 Pips , Don`t Miss It !Here is my EUR/USD Analysis and if you check the chart you will see that we have avery strong res area forced the price to go down hard last time , so i will sell this pair from the same res area , it will force the price to go down hard at least 250 pips , waiting the price to touch it and then we can sell it .

EUR/USD: Weekly PAT + VPA 5/11/2025Trading Analysis EUR/USD - Price Action and Volume Price Analysis
Weekly Structure Analysis: At present, we find ourselves within a bullish weekly range. The lower boundary of this range is 1.07330, established during the week of March 24, 2025, while the upper boundary is at 1.15734, reached the week of April 21, 2025. The price movement from 1.073 to 1.157 has surpassed a swing high, which we will identify as our initial resistance point as we aim to return to 1.15734.
Weekly Price Action Analysis: Analyzing structure and price action reveals similarities. Our confidence in a bullish trend is the anchored weekly bar. The weekly candle from the week of April 7, 2025 serves as this anchor. Following the inside bar, we observed a bearish pin bar, which acts as a Bullish Reacher since its wick exceeded the high of the anchor bar's wick (Wick on Wick). The market shows signs of wanting to rise, but it must first hit a demand zone that weekly traders are keen to engage with.
Volume Price Analysis: The last four weekly candles have demonstrated limited strength in driving the market lower, with support holding at 1.11927 (1.12). As the price declines, trading volume is decreasing, following a sharp upward movement, likely due to profit-taking or repositioning. Volume analysis indicated we should retest 1.15734.
Good luck and happy trading!
OANDA:EURUSD TVC:DXY

EURUSD - ShortLooking at shorts on EURUSD. Big chance that we'll take out the daily high before entering lower.

EUR/USD.2h chart pattern.(EUR/USD 2H chart pattern), here’s a breakdown of the target levels visible:
📉 Bearish Setup
The chart shows a potential breakdown from an ascending channel, supported by:
Ichimoku cloud showing price action moving through and below the cloud.
Sharp red zigzag pattern indicating a forecasted price drop.
Two marked target zones, highlighted with red horizontal lines and a large downward blue arrow.
---
🎯 Target Levels:
1. First Target: Around 1.12500
This is the first red horizontal line after the price breaks below the ascending channel.
Likely a support or measured move target.
2. Second Target (Lower): Around 1.11516
This is the lower red line and currently shown on the live price marker on the chart.
Could be the ultimate bearish target based on the measured height of the channel or prior support.
---
These targets imply a bearish bias for EUR/USD if the price breaks and closes below the lower trendline of the ascending channel.
Let me know if you want the stop-loss level, confirmation rules, or how to calculate similar patterns yourself.

EURUSD has follow the ascending channel bullish from support FX:EURUSD Analysis – 1H Time Frame
EUR/USD is currently respecting an ascending channel and showing strong bullish momentum from the key demand zone at 1.13900.
🎯 Technical Targets:
1st Target: 1.14600
2nd Target: 1.15000
The price action confirms buyer interest and continued upside potential, as long as the structure holds.
📊 Stay tuned for more updates and trade setups!
💬 Like, follow, and drop your thoughts in the comments!
— With love,
Livia 😜

EURUSD: Perfect spot to short.EURUSD is bullish on its 1D technical outlook (RSI = 62.082, MACD = 0.004, ADX = 31.112) as it is trading inside a Channel Up since the May 12th low. The 4H RSI sequence suggests that based on the Channel's first bullish wave, the market is now on the 4th count, which was previously the top (as close to the 1.786 Fibonacci extension as possible). We turn bearish here, targeting the 0.786 Fib level at the bottom of the Channel Up (TP = 1.13550).
See how our prior idea has worked out:
## If you like our free content follow our profile to get more daily ideas. ##
## Comments and likes are greatly appreciated. ##

EURUSD: Bears May Regain Control of the PriceEURUSD: Bears May Regain Control of the Price
From our previous analysis, EURUSD extended the Z wave to 1.1495 due to high volatility and speculation related to Trump's comments against China and the old price theme.
However, nothing changed again. EURUSD found sellers near 1.1495 which had already rejected the price again and it seems that the downward movement may resume soon.
We do not have clear signs of a reversal yet, but as long as the price is holding and the patterns are valid, the chances are that EURUSD will fall as shown in the chart.
Bearish Targets:
1.1230 – First major support level
1.1100 – Possible second target
1.1000 – A deeper correction point
1.0900 – Strong structural support
You may find more details in the chart!
Thank you and Good Luck!
❤️PS: Please support with a like or comment if you find this analysis useful for your trading day❤️
Disclosure: I am part of Trade Nation's Influencer program and receive a monthly fee for using their TradingView charts in my analysis.

LT trade: Short EU til the rest of the yearFire may burns to the europe continent. price is reaching a hypothetical resistance, it may shoot up these days and heads down

MarketBreakdown | EURUSD, AUDUSD, USDCHF, EURCAD
Here are the updates & outlook for multiple instruments in my watch list.
1️⃣ #EURUSD daily time frame 🇪🇺🇺🇸
Though the pair remains quite weak for the last few days,
I strongly believe that bulls have unrealized potential.
The pair may continue rising and reach the underlined yellow resistance soon.
2️⃣ #AUDUSD daily time frame 🇦🇺🇺🇸
The price is testing a significant horizontal resistance.
Its bullish breakout will provide a strong bullish signal.
The pair will go way higher then.
3️⃣ #USDCHF daily time frame 🇺🇸🇨🇭
The price is stuck within a narrow consolidation range.
I think that a sideways movement is going to continue
and the price will drop to the support of the range soon.
4️⃣ #EURCAD daily time frame 🇪🇺🇨🇦
The price action is contracting within a symmetrical triangle pattern.
Such a pattern signifies a deep indecision.
A breakout of one of its boundaries will indicate the side of the next market move.
Do you agree with my market breakdown?
❤️Please, support my work with like, thank you!❤️
I am part of Trade Nation's Influencer program and receive a monthly fee for using their TradingView charts in my analysis.

Path Toward 1.20 Still in Play but there's a catch....The pair has recently completed a major technical breakout by moving above a long standing trendline that dates back to the 2008 high. For more than 15 yearsthis trendline acted as strong resistance, repeatedly rejecting bullish attempts. The latest move did not just break through this resistance. It returned to retest the level around the 1.1450 to 1.1500 area and held with near perfect precision. This successful retest signaled a structural shift, turning former resistance into solid support. Since then, the pair has remained within a steep upward channel, forming higher lows and maintaining strong upside momentum. This momentum appears to be backed by real macro flows rather than just short-term speculation.
The euro’s recent strength is not being driven by strong economic performance in the Eurozone. Instead, it reflects a broader shift in global capital allocation and diverging monetary policy expectations. The Federal Reserve began easing policy in late 2024 with a series of rate cuts aimed at responding to softening inflation and slowing labor market conditions. By early 2025, the Fed had completed a handful of cuts before entering a pause. That pause remains in effect for now but markets are increasingly expecting the Fed to resume cutting later this year, with 2 to 3 additional cuts projected for the second half of 2025. These expectations have weakened the dollar as traders anticipate a return to more accommodative policy. (This is known as pricing in or speculative markets)
On the European side, the European Central Bank began cutting rates in late 2024 (Duh we all know this by now) and is now widely seen as operating in neutral territory. The ECB has taken a careful and measured approach to easing, avoiding any aggressive dovish turn and instead emphasizing a data dependent path. With limited room to cut further and no urgent economic pressure to do so, the euro has maintained a relative yield advantage compared to the dollar, even in a context of muted growth.
Another important driver of euro strength has been the rotation of capital into U.S. equities, particularly in the technology and large cap sectors. As investors allocate more capital into risk assets, the dollar tends to weaken in FX terms, as funding shifts out of USD and into growth exposures (aka emerging markets) This type of flow indirectly benefits the euro. At the same time the dollar is no longer acting as a dominant safe haven for now. Despite the presence of global uncertainty, low market volatility and return focused positioning have reduced the appeal of defensive USD flows. This has allowed the euro to benefit from repositioning, not because of its own economic strength, but because the dollar is no longer absorbing global liquidity the way it once did.
From a technical standpoint, the breakout above the 2008 trendline marks a significant structural change. As long as the 1.1500 area holds as support, the trend remains intact. The next major upside target is around 1.20, which aligns with the top of the rising price channel and represents a likely area for medium term profit taking by larger market participants.
However , risks to the upside scenario remain. Because this rally is being driven by capital flows and positioning rather than Eurozone fundamentals, it is highly sensitive to shifts in sentiment and data. A stronger than expected U.S economic report, such as an upside surprise in CPI, employment or consumer spending, could quickly change the market’s view on the Fed’s rate path and trigger a resurgence in dollar strength. Similarly, any signal from the ECB that suggests renewed dovishness or further deterioration in European economic data, could weigh heavily on the euro. In addition, if a geopolitical shock or a sharp decline in risk appetite occurs, safe haven flows could return to the dollar and result in a fast reversal in EUR/USD. We saw a warning of this past weekend with Israel and Iran attacking each other.
all in all, the euro has made a technically sound and macro supported breakout, driven by diverging rate cycles, capital rotation and the evolving role of the U.S dollar in global flows. The move toward 1.20 remains a valid target as long as 1.1500 holds as support. But this is not a fundamentally bullish euro story. It is a positioning driven move based on relative rate expectations and macro sentiment. If those expectations shift, the rally could unwind quickly. Active risk management remains essential. I hope this helps you all, Cheers!
Chart
White dashed line - 2008 Resistance
Red and Blue Ascending channel (Bullish on Daily)
Red is 1.19-1.20 AOI TP

Lingrid | EURUSD continuation Following Key Level BreakoutOANDA:EURUSD has completed a bullish breakout above the triangle pattern and is now consolidating above the key 1.14990 support level. The price structure shows a series of higher lows, with recent action forming a tight range just above trendline support. If bulls defend this area, a move toward the 1.17000 resistance becomes increasingly likely.
📈 Key Levels
Buy zone: 1.14990–1.15200
Sell trigger: break below 1.14800
Target: 1.17000
Buy trigger: break above 1.16000 with bullish volume
💡 Risks
Failure to hold 1.14990 could trigger a move toward 1.12100
DXY strength could suppress EUR upside
ECB or Fed policy shocks could increase volatility
Traders, if you liked this idea or if you have your own opinion about it, write in the comments. I will be glad 👩💻

Bearish drop off major resistance?EUR/USD has reacted off the resistance level which is a pullback resistance and could drop from this level to our take profit.
Entry: 1.1433
Why we like it:
There is a pullback resistance level.
Stop loss: 1.1481
Why we like it:
There is a pullback resistance level.
Take profit: 1.1361
Why we like it:
There is a pullback support level.
Enjoying your TradingView experience? Review us!
Please be advised that the information presented on TradingView is provided to Vantage (‘Vantage Global Limited’, ‘we’) by a third-party provider (‘Everest Fortune Group’). Please be reminded that you are solely responsible for the trading decisions on your account. There is a very high degree of risk involved in trading. Any information and/or content is intended entirely for research, educational and informational purposes only and does not constitute investment or consultation advice or investment strategy. The information is not tailored to the investment needs of any specific person and therefore does not involve a consideration of any of the investment objectives, financial situation or needs of any viewer that may receive it. Kindly also note that past performance is not a reliable indicator of future results. Actual results may differ materially from those anticipated in forward-looking or past performance statements. We assume no liability as to the accuracy or completeness of any of the information and/or content provided herein and the Company cannot be held responsible for any omission, mistake nor for any loss or damage including without limitation to any loss of profit which may arise from reliance on any information supplied by Everest Fortune Group.

EURUSD - TIME TO SHORT Team, last time we have successfully SHORT the EURUSD and now we are back on it again
This time we have better short position
NOTE: Last few days we have been killing the UK100/FTSE100 with such great opportunity.
Please follow the PRICE target accordingly to the CHART
Target 1 1.147200 to 1.4650
Target 2 at 1.1455-1.1450
Once it reach the 1st Target take 50% profit
Good luck and enjoy the profit

EURUSD !!! (Big move is loading)
📈 EUR/USD – Wave 4 Buy Opportunity (2H TF)
Published by Greenfireforex | June 13, 2025
The EUR/USD pair is completing a corrective Wave 4, retracing into a premium FVG (Fair Value Gap) demand zone between 1.1500–1.1475. Price tapped into a high-probability reversal block just below the psychological level of 1.1500, offering a potential long entry.
🔹 Technical Confluences:
Wave 4 corrective structure
Fair Value Gap (Buyers) zone
Liquidity grab near 1.1478
Bullish projection towards 1.1637 (Wave 5 target)
🔸 Entry Idea:
Long from the FVG demand zone with confirmation (price action / bullish engulfing / lower timeframe structure break).
📍 Targets:
TP1: 1.1500
TP2: 1.1570
TP3 (wave projection): 1.16375
🛑 Invalidation:
Clean break below 1.1470 zone with momentum could invalidate the bullish setup.
---
📊 Strategy: Elliott Wave + FVG + Price Action
💡 Watch for reaction around CPI & USD news (14th–18th June)
Hashtags (for IG/TradingView):
#EURUSD #WaveAnalysis #Forex #ForexSetup #PriceAction #ElliottWave #SmartMoney #FXTrade #ForexBreakout
---

EURUSD Set To Fall! SELL!
My dear friends,
EURUSD looks like it will make a good move, and here are the details:
The market is trading on 1.1596 pivot level.
Bias - Bearish
Technical Indicators: Supper Trend generates a clear short signal while Pivot Point HL is currently determining the overall Bearish trend of the market.
Goal - 1.1533
About Used Indicators:
Pivot points are a great way to identify areas of support and resistance, but they work best when combined with other kinds of technical analysis
Disclosure: I am part of Trade Nation's Influencer program and receive a monthly fee for using their TradingView charts in my analysis.
———————————
WISH YOU ALL LUCK

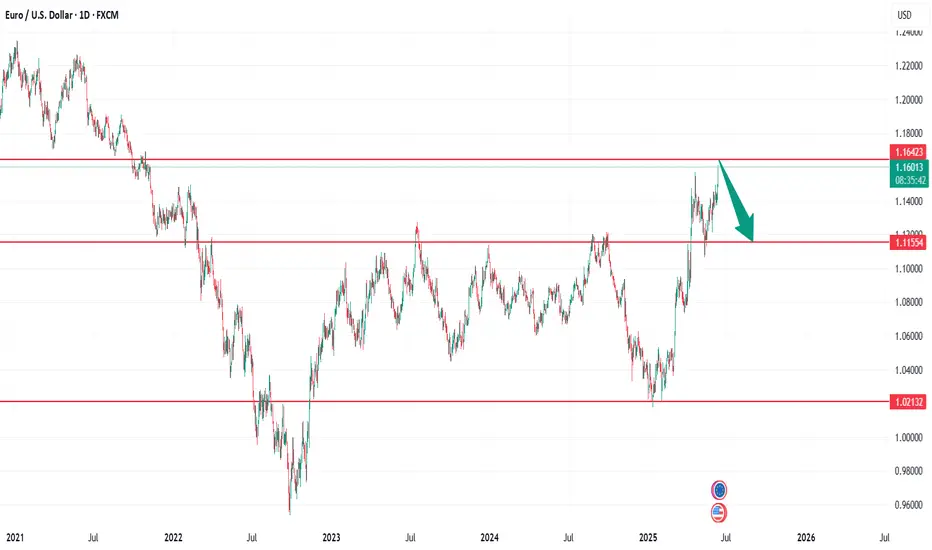
EUR/USD Potential Reversal from Resistance Zone –Bearish OutlookThe EUR/USD pair has been trading within a well-defined ascending channel for several weeks. Price recently tested a strong resistance zone near 1.15850 – 1.16000, which aligns with the upper boundary of the channel and a previously marked supply area.
Key observations:
The price action shows signs of rejection from the resistance zone with a potential double-top or fakeout pattern forming.
A projected bearish trajectory is marked, suggesting a possible break below the channel support.
Immediate bearish targets are set at key demand zones around 1.14500, 1.12500, and further down to 1.10500.
A large red arrow indicates the strong downside bias if the price confirms the breakdown.
Conclusion:
If EUR/USD fails to sustain above the 1.15850 resistance zone and breaks below the ascending channel, a strong bearish correction is anticipated. Traders should watch for confirmation of the breakdown before entering short positions.

EURUSD | Bearish Below 1.1530, Break Above 1.1559 Turns BullishEURUSD | Overview
The pair is trading under bearish pressure due to rising geopolitical tensions.
As long as the price remains below 1.1530, the bearish trend is expected to continue toward 1.1450 and 1.1372.
For a bullish reversal, the price must break above 1.1559 to open the path toward 1.1625.
Pivot Line: 1.1530
Support Levels: 1.1450, 1.1372, 1.1270
Resistance Levels: 1.1559, 1.1625, 1.1750

Get Ready – A Pullback May Be ImminentEUR/USD has rallied impressively, gaining nearly 1,400 pips from its February 2025 low. The pair recently surged to revisit a price level last seen in November 2021. However, after such a strong bullish move, a correction appears likely.
I’m anticipating a potential drop of at least 500 pips from the current level after hitting a strong resistance on multiple time frame.
Check the chart for more details.
Stay safe and trade smart.
EUR/USD Rally Extends – Eyes on 1.20000 as Momentum BuildsHi Everyone,
As outlined in our analysis last week (idea linked below), EUR/USD continued to the upside and reached the 1.15240 level.
We expect price action to extend further toward the 1.16564 level, which would reinforce our long-term bullish outlook.
A confirmed break above this resistance would likely open the door for a move toward 1.18325, where we anticipate encountering dynamic resistance.
We will provide further updates on the projected path for EUR/USD should price reach this level.
The longer-term outlook remains bullish, with expectations for the rally to extend toward the 1.2000 level, provided the price holds above the key support at 1.10649.
We will continue to update you throughout the week with how we’re managing our active ideas and positions. Thanks again for all the likes/boosts, comments and follows — we appreciate the support!
All the best for a good end to the week. Trade safe.
BluetonaFX
