DeGRAM | EURUSD held the accumulation zone📊 Technical Analysis
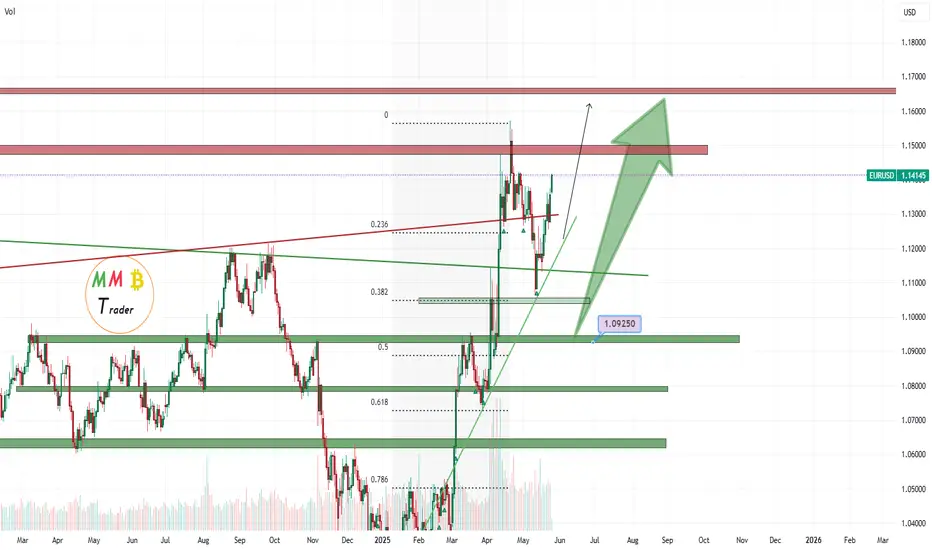
● Two-year rising channel is intact; price just rebounded from the lower rail (RB) and punched back above the 2020-2024 red resistance trend-line, repeating the 2022 “break-retest-fixation” pattern.
● An 18-month accumulation rectangle (1.06-1.13) has resolved higher, printing a bullish weekly engulfing; the measured move points to the channel mid-band / horizontal cluster at 1.1600, then the upper rail near 1.1950.
💡 Fundamental Analysis
● Eurozone core CPI is stuck at 2.7 % y/y while US ISM and housing prints cooled, dragging real U.S. yields lower and narrowing the policy-rate gap priced for 2025.
✨ Summary
Long above 1.1214; breakout projects 1.16 ➜ 1.195. Risk flips only on a weekly close back below 1.108.
-------------------
Share your opinion in the comments and support the idea with like. Thanks for your support!
EURUSD_W trade ideas

EURUSD 338PIPS LIVE TRADE AND BREAKDOWN EUR/USD sticks to gains near 1.1400 as Trump extends EU tariff deadline
EUR/USD consoldiates latest gains near 1.1400 in the European session on Monday. The pair draws support from persistent US Dollar weakness and US President Donald Trump's extension of the 50% tariff deadline on the European Union (EU) until July 9.

Lingrid | EURUSD long Entry Opportunity from Support ZoneThe price perfectly fulfilled my previous idea . FX:EURUSD is pushing higher after breaking through the downward trendline and forming a higher low. Price is currently hovering above the key 1.1320 swap zone and could use this level as support for a bullish continuation. A bounce from this region would open the path toward the 1.1500 resistance inside the upper part of the bullish channel. However, failure to hold 1.1320 may trigger a deeper pullback into the rising trendline.
📈 Key Levels
Buy zone: 1.1300 – 1.1320
Buy trigger: bullish bounce from 1.1320
Target: 1.1500
Sell trigger: break below 1.1300
💡 Risks
Weak Eurozone data could derail bullish setup
USD strength on Fed hawkishness may stall recovery
Trendline break would signal bearish reversal structure
Traders, if you liked this idea or if you have your own opinion about it, write in the comments. I will be glad 👩💻

EU Market Breakdown – Key Liquidity Zones & Bias for Today Today’s analysis focuses on the current structure and price behavior of EURUSD.
We're identifying key liquidity zones, watching for trap setups, and aligning bias with HTF direction.
🔍 Watch for:
Major stop hunt zones
Potential displacement moves
Where price may reject or sweep
ARX style: Precision Over Prediction
Stay patient. Wait for confluence. Strike like a sniper. 🎯

EURUSD - Important Breakout !Hello Traders !
The EURUSD price formed a descending channel.
Currently, The resistance line is broken !
So, I expect a bullish move🚀
______________
TARGET: 1.14095🎯


EURUSD BUY 1.136On the 4-hour chart, EURUSD maintains a volatile upward trend. Currently, we can pay attention to the support near 1.136. If it falls back and stabilizes, we can consider continuing to buy. The upper resistance is the previous supply area of 1.148-1.157. If the price falls below the support near 1.130, it will start to fall.

EURUSD: PCE and EU trade tariffsAlthough this week there has not been currently significant macro data set for a release, the market volatility was reflecting fundamentals, mostly related to actuel narrative around trade tariffs. The US Administration was commenting on the possibility of setting a 50% trade tariff on goods coming from the EU, which brought back higher volatility on financial markets, and impacted the drop in value of US Dollar. As for macro data posted during the week, the Existing Home Sales reached 4M in May, which was a change of -0,5% for the previous month. At the same time, New Home Sales in April were higher by 10,9% in April compared to the previous month.
The final inflation rate in the Euro Zone in April was standing at 0,6% in April, and 2,2% on a yearly level. The PPI in Germany in April dropped by -0,6% for the month, bringing the indicator down by -0,9% on a yearly basis. The HCOB Manufacturing PMI flash for May in Germany was standing at 48,8, while the same indicator in the Euro Zone reached 49,4, and was in line with market expectations. The Ifo Business Climate in May in Germany reached 87,5 and was in line with forecast. The GDP Growth rate final for Q1 in Germany was 0,4%, higher from estimated 0,2% for the quarter. At the same time the GDP growth for the year reached 0%, and was a bit better from forecasted -0,2%.
The previous week was promising to be a calm one when macro data were in question, however, the higher volatility was induced by fundamentals, related to the narrative regarding trade tariffs. The eurusd currency pair was traded between levels of 1,1166 up to 1,1365. The RSI ended the week at the level of 58, but set the path toward the higher grounds, eyeing the overbought market side. The MA50 continues to diverge from MA200, indicating that the potential cross is not in the store for some time in the future.
Current charts are pointing toward the relatively weaker short term resistance level at 1,1380. In case that this level is breached to the upside in the week ahead, then the eurusd will head toward the 1,1480 which is the historical resistance line for the eurusd pair. In this scenario, it would mark a double top formation in technical analysis from which short term reversal could be expected. The second option is that the market starts weekly trading in a more relaxed mode, and revert from current levels. In this case, the next stop of the currency pair will be around the level of 1,1280. Still, it should be considered that the narrative around tariffs on EU goods will continue in a week ahead, which will bring some higher volatility and the PCE data are set for release which could be another trigger for volatility.
Important news to watch during the week ahead are:
EUR: GfK Consumer Confidence in June for Germany, Unemployment rate in in Germany in May, Retail Sales in April in Germany, Inflation rate preliminary for May in Germany,
USD: Durable Goods Orders in April, CB Consumer Confidence in May, FOMC Meeting Minutes, GDP Growth rate for Q1, second estimate, PCE Price Index in April, University of Michigan Consumer Sentiment final for May.

EURUSD H4 Chart Outlook for Shorter Term 26-30 May 25You are seeing EURUSD H4 Chart, Right EURUSD is standing in mid-term Bullish Trend with Bullish Channel
Kindly follow the Zones Accordingly and always place SL
Disclaimer: Forex is Risky

EURUSD Weekly PerspectiveOn ICT Cycles, Maybe EUR Can Go Higher To Buyside Equals..
But it needs confirmation from the shorter-term views and confirmation from the dollar index.
Over time, this idea will be updated according to the coming days.
CPI profile was able to make a good climb and probably provides a fairly good confirmation for the continuation of the upward trend.
Have a good week and trades.

EURUSD 1.17 ahead As we said before major supports here like 1.1005 and 1.1450 can easily hold price and now can pump it to our bullish target which is 1.17 and this week the target can hit.
DISCLAIMER: ((trade based on your own decision))
<<press like👍 if you enjoy💚
EURUSD Breaking Above Resistance Line; Wave 5 In PlayEURUSD moved nicely higher in April, into the 1.15–1.16 area, a resistance where pair slowed down at the end of wave 3, that put retracement in play. However, a pullback has been made in three waves, so its seen as temporary within the broader uptrend. We saw some deeper retracement down to 1,1, near the 38.2% Fib from where we can see some nice turn up, above the trendline resistance so it appears that bulls are in play for wave 5. Therefore, be aware of more upside afte some intraday dips. Support is at 1.1266 area.
GH

EUR/USD at a Crossroads: Will the Bears Strike Back from 1.14? 📍1. TECHNICAL CONTEXT
EUR/USD is trading around 1.1405, inside an ascending channel and right within a supply zone (1.1370–1.1470), which already triggered a rejection on April 16. Price action currently shows hesitation, with three consecutive candles at the top of the channel and RSI divergence, suggesting a loss of bullish momentum after an overextension.
The bullish trendline from April remains intact and validated, but the upside is narrowing. Likely scenario: bullish exhaustion followed by a pullback towards 1.1270–1.1220, with a potential retest of both the trendline and the lower boundary of the channel.
📊2. COT REPORT (USD & EUR) – Updated to May 20
USD Index: Non-Commercials added +2,044 net longs, but also +1,975 new shorts. Open Interest rose by +2,207 → a more active market, but still mixed. Net exposure remains neutral to slightly bearish for the dollar.
EURO FX: Non-Commercials cut -3,587 longs and added +6,814 shorts, while Commercials increased longs by +16,796. Speculative funds are gradually shifting short on the Euro, while Commercials continue to hedge long.
→ Combined read: Large speculators are reducing their Euro exposure and staying cautious on the Dollar. Short-term pressure on EUR/USD remains bearish, though no macro reversal yet.
📉3. SENTIMENT & POSITIONING
Retail sentiment shows 71% of traders are short EUR/USD — a classically contrarian signal. However, price is now sitting in a liquidity cluster where smart money might exploit a final squeeze before a real reversal.
Market depth shows strong imbalance, with long orders stacked above current price — suggesting potential stop hunt already triggered or about to fade.
🧭4. SEASONALITY
Historically, May is a bearish month for EUR/USD: -0.0079 on 20-year average, and -0.0163 on 10-year average. Seasonality supports late May weakness and potential downside continuation into early June.
✅ TRADING OUTLOOK
📌 Primary Bias: short-term corrective bearish, waiting for clearer reversal signals.
📌 Key Reaction Zone: 1.1400–1.1470 → structural short area, already tested.
📌 Bearish Target: 1.1270 > 1.1210 (golden pocket + trendline confluence)
📌 Setup invalidation: daily close above 1.1470 with volume → possible extension to 1.1550/1.1580
📌 Macro support: Commercials remain long on the Euro → underlying structure still bullish, but too early to fade short-term bearish momentum.

EUR/USD Daily Analysis – Elliott Wave Structure UnfoldingThe EUR/USD pair continues to follow a well-structured impulsive wave count within an Elliott Wave framework.
🔹 Wave Count:
We appear to be in the early stages of wave (5) of a larger degree impulse. Wave (3) has already completed, followed by a clear ABC corrective structure forming wave (4). This correction retraced to the area around the 1.10636 level, coinciding with the 100-day EMA (blue), which acted as dynamic support.
🔹 Current Structure:
Wave (5) seems to be unfolding with bullish momentum resuming. Minor wave (a)-(b)-(c) correction looks complete, and price action is pushing higher again.
🔹 EMA Confluence:
Price is trading above all key EMAs:
Yellow EMA: short-term
Blue EMA (100): mid-term, recently retested as support
Pink EMA (200): long-term trend still rising
This alignment supports continued bullish bias.
🔹 Targets for Wave (5):
Based on Fibonacci extensions from wave (3):
1.382 extension at 1.17685
1.618 extension at 1.18893
These are potential take-profit zones if the impulsive wave structure completes as expected.
📈 Resistance to Watch:
1.15723: local horizontal resistance
Break above this level could confirm the start of wave (5) with increased momentum.
📉 Support Levels:
1.14088 (prior swing low)
1.10636 (EMA confluence + wave (4) bottom)
💡 Summary:
As long as EUR/USD holds above the 100 EMA and the wave (4) low, the bullish scenario remains valid. Watch for confirmation above 1.1572 to validate the beginning of wave (5) toward the 1.18–1.19 area.
📌 Trade with structure. Manage your risk. Let the wave guide the way.

EURUSD on the riseEURUSD continues its bullish trend and has broken above 1,1400.
All open buy positions should now be managed with reduced risk.
We expect the trend to continue, but pullbacks are entirely possible.
These corrections will present great opportunities for additional entries and further profits!

1.15150 Resistance Looms Amid EU Economic WoesOn the daily timeframe, EURUSD continues climbing toward the strong resistance zone around 1.15150 after a solid rebound from the EMA 34. However, the current candlestick structure shows signs of slowing momentum as price approaches a historically significant top — a zone prone to short-term profit-taking.
The technical setup becomes even more relevant when viewed alongside macroeconomic developments: the U.S. has just announced an extension of its 50% tariff deadline on EU goods from June 1 to July 9, temporarily easing trade tensions. However, the European Commission has revised down its Eurozone growth forecast for 2025 from 1.3% to 0.9%, highlighting persistent structural weaknesses and economic risks in the region.
The likely scenario: EURUSD may face rejection at 1.15150, followed by a pullback toward the support area around 1.09610. This zone aligns with the EMA 34, EMA 89, and a previous accumulation range. If this support fails to hold, the medium-term trend could shift clearly to the downside.

New thoughts on EURUSDI love EUR/USD. We just hit our channels resistance, but I suspect we continue bullish a little more so that we may retest the other resistance zone from a few weeks ago. Then, we will likely continue this trend. Now, this trend will not and cannot last forever. No, this short trend will be broken and drop down, and we shall continue our downtrend. (Given 3M, M, W, 3D and daily time frames which all indicate bearishness) Now for the long-term traders, I suggest you short EURUSD and look away for a few months. But for the short term, wait until it hits the resistance and THEN place a short entry. Close that trade when it hits the channels support and buy a long (WITH STRICT RISK MANAGEMENT). If it hits your SL, then obviously you continue shorts.
Good luck traders! Do your own analysis.
Lmk if you have any questions. I’m usually online.

Market next target Original Analysis Summary:
Support area at ~1.1400 holding price.
Expectation: Bounce off support and continuation to higher target.
Arrows indicate a bullish bias after minor retracement.
---
Disruptive Bearish Interpretation:
1. Exhaustion at Top:
Strong upward rally could be showing signs of buying exhaustion, especially after the sharp vertical move.
The current top wick suggests rejection from higher levels.
2. Bearish Reversal Candles:
If a shooting star or bearish engulfing pattern forms near the target area, it could signal a reversal.
The current candle shows a long wick, which often precedes pullbacks.
3. False Breakout Risk:
The price could have broken above a resistance level only to trap breakout buyers before reversing downward.
This would trigger a move below the red box (support area).

EURUSD Trendline Breakout – Bullish Target Ahead
EURUSD has successfully broken out of a strong descending trendline, which was acting as dynamic resistance for weeks. The breakout is backed by strong bullish candles and clear higher lows forming.
After the breakout, the price also reclaimed a key horizontal support zone around 1.12573, turning it into a solid base for further upside.
🎯 Bullish Target (Expected):
First major bullish target at 1.13864 based on the 1.618 Fibonacci extension from the last swing move.
📌 Support: 1.12573
📌 Breakout Confirmation: Valid as long as price holds above the trendline and support.
📈 Outlook:
The momentum looks strong for further bullish continuation. If the price holds above the breakout zone, we expect a move toward 1.13864 in the coming sessions.

EURUSD can bullish trend change to bearishMy vision where CAN go price.
Now we on bullish trend but it can change to bearish.
If we break trend line 1.124-1.125 we fall to area 1.120 and lower to close GAP
For my opinion better wait to enter in the market.Or wait pull up after zone 1.12

EURUSD short termMy vision where go price.
Now we on bullish trend but in short term bearish.
If we break trend line 1.133 we fall to area 1.130.
But first target 1.133 on Monday

EURUSD InsightGreetings to all subscribers.
Please share your personal opinions in the comments. Don't forget to hit the boost and subscribe buttons.
Key Points
- U.S. President Trump announced via Truth Social that he “expects Apple to manufacture and produce iPhones sold in the United States within the U.S.” and warned that “otherwise, Apple will be required to pay a minimum 25% tariff in the U.S.”
- Trump also warned the EU, stating, “It was very difficult to deal with the EU, which was established with the purpose of taking advantage of the U.S. in trade,” and recommended “imposing a 50% tariff on the European Union starting June 1, 2025.”
- Maroš Šefčovič, the EU Commissioner for Trade, commented that “the European Commission is ready to cooperate in good faith.”
- On the 27th, the Bank of Japan will hold a large-scale conference over two days under the theme “New Challenges for Monetary Policy,” with key financial figures, including Federal Reserve officials, expected to attend alongside Japanese participants.
This Week’s Key Economic Calendar
+ May 26: Speech by ECB President Christine Lagarde
+ May 28: FOMC Meeting Minutes
+ May 29: U.S. Q1 GDP
+ May 30: U.S. April Core PCE Price Index
EURUSD Chart Analysis
EURUSD has smoothly broken through the 1.14000 resistance line and is once again attempting to break above the previous high. While a decline is expected after forming a high near the 1.16000 level, it is worth examining further bullish catalysts. Once it reaches the 1.16000 level, we will reassess the market direction.

EUROUSD COT and Liquidity Analysis chart The EUR/USD pair has demonstrated a convincing upward momentum, which might suggest a sustained long opportunity. However, traders should exercise caution—this bullish move could be a classic trap. Despite the current strength, signs of exhaustion are beginning to appear in the price action and volume. The market may soon shift direction, and a downward correction or full reversal could be imminent. Now is not the time to chase the high—stay alert, as the fall could happen sooner than expected.
