EURUSD SHORT FORECAST Q2 W24 D12 Y25EURUSD SHORT FORECAST Q2 W24 D12 Y25
Professional Risk Managers👋
Welcome back to another FRGNT chart update📈
Diving into some Forex setups using predominantly higher time frame order blocks alongside confirmation breaks of structure.
Let’s see what price action is telling us today!
💡Here are some trade confluences📝
✅Weekly order block
✅15' order block
✅4 hour order block
✅Tokyo ranges to be filled
🔑 Remember, to participate in trading comes always with a degree of risk, therefore as professional risk managers it remains vital that we stick to our risk management plan as well as our trading strategies.
📈The rest, we leave to the balance of probabilities.
💡Fail to plan. Plan to fail.
🏆It has always been that simple.
❤️Good luck with your trading journey, I shall see you at the very top.
🎯Trade consistent, FRGNT X
EURUSD_W trade ideas

Bearish drop?The Fiber (EUR/USD) has rejected off the pivot and could drop to the 1st support.
Pivot: 1.1611
1st Support: 1.1495
1st Resistance: 1.1649
Risk Warning:
Trading Forex and CFDs carries a high level of risk to your capital and you should only trade with money you can afford to lose. Trading Forex and CFDs may not be suitable for all investors, so please ensure that you fully understand the risks involved and seek independent advice if necessary.
Disclaimer:
The above opinions given constitute general market commentary, and do not constitute the opinion or advice of IC Markets or any form of personal or investment advice.
Any opinions, news, research, analyses, prices, other information, or links to third-party sites contained on this website are provided on an "as-is" basis, are intended only to be informative, is not an advice nor a recommendation, nor research, or a record of our trading prices, or an offer of, or solicitation for a transaction in any financial instrument and thus should not be treated as such. The information provided does not involve any specific investment objectives, financial situation and needs of any specific person who may receive it. Please be aware, that past performance is not a reliable indicator of future performance and/or results. Past Performance or Forward-looking scenarios based upon the reasonable beliefs of the third-party provider are not a guarantee of future performance. Actual results may differ materially from those anticipated in forward-looking or past performance statements. IC Markets makes no representation or warranty and assumes no liability as to the accuracy or completeness of the information provided, nor any loss arising from any investment based on a recommendation, forecast or any information supplied by any third-party.

EURUSD Wave Analysis – 13 June 2025- EURUSD reversed from the resistance level 1.1575
- Likely to fall to support level 1.1400
EURUSD currency pair recently reversed down from the resistance level 1.1575, which stopped the previous sharp impulse wave (1) in the middle of April.
The resistance zone near the resistance level 1.1575 was strengthened by the upper daily Bollinger Band.
EURUSD currency pair can be expected to fall to the next support level 1.1400 (which stopped the previous correction ii).

Bullish momentum to extend?EUR/USD has reacted off the resistance level which is a pullback resistance and could rise from this level to our take profit.
Entry: 1.1451
Why we like it:
There is a pullback support level.
Stop loss: 1.1386
Why we like it:
There is a pullback support level.
Take profit: 1.1558
Why we like it:
There is a pullback resistance level.
Enjoying your TradingView experience? Review us!
Please be advised that the information presented on TradingView is provided to Vantage (‘Vantage Global Limited’, ‘we’) by a third-party provider (‘Everest Fortune Group’). Please be reminded that you are solely responsible for the trading decisions on your account. There is a very high degree of risk involved in trading. Any information and/or content is intended entirely for research, educational and informational purposes only and does not constitute investment or consultation advice or investment strategy. The information is not tailored to the investment needs of any specific person and therefore does not involve a consideration of any of the investment objectives, financial situation or needs of any viewer that may receive it. Kindly also note that past performance is not a reliable indicator of future results. Actual results may differ materially from those anticipated in forward-looking or past performance statements. We assume no liability as to the accuracy or completeness of any of the information and/or content provided herein and the Company cannot be held responsible for any omission, mistake nor for any loss or damage including without limitation to any loss of profit which may arise from reliance on any information supplied by Everest Fortune Group.

Overall bullish continuationI am expecting a minor pullback, because price has changed charcater on the 1hr timeframe, i expect price to pull back towards the 1.14500 area, near the liquidity zone, then a continuation downwards to mitigate a bullish order block near 1.12500 area, then continue upwards targeting 1.1500 area.
A violation is when price clearly breaks below 1.1200.
Trade wisely, this is an analysis and not a financial advise.

EURUSD | Bearish Bias Below 1.1450, Eyes on 1.1372EURUSD | OVERVIEW
The pair maintains a bearish momentum as long as it trades below the pivot level at 1.1450, targeting the support at 1.1372. A clear break below this level would reinforce the downtrend, potentially extending the decline toward 1.1270.
Alternative Scenario:
A confirmed 1-hour candle close above 1.1450 would indicate a potential shift to a bullish trend, with upside targets at 1.1535, and possibly 1.1625.
Support Levels: 1.1372, 1.1270
Resistance Levels: 1.1535, 1.1625

EURUSD DOWNSIDE BIAS WITH 3 CONFLUENCESMY ANALYSIS AND PROJECTIONS FOR EURUSD NEXT TARGETS FOR THE WEEK JUNE 16TH TO 21ST
I have a strong downside bias going into this week for the EURUSD.
On the daily chart it has currently made a double top while clearing the 1.16 level and making a nearyy 4 year high for the pair. The next movement I believe would be to complete that downward stroke of the M pattern and this is supported by 2 other confluences.
1. There are overbought conditions for the EURUSD and there is a 0.5% Fibonacci target of retracement for the pair for its Strong bullish move from 1.02 to 1.16,Spanning from February till June 2025.
That target is at around 1.09 price level
2. Another important confluence is fundamentally driven and this is due to the Iran/Isreal war and middle East tensions which would drive the US dollar buying making it stronger and bullish due to its safe haven status.

SHOT ON EUR/USDEUR/USD Has given us a nice double top at a major resistance level.
Since then it has broken the neckline of that double bottom, creating a new low, engineering liquidity, sweeping it and now getting ready to tap into supply before it should fall.
The Dxy is also getting ready to rise from a demand level so this should also aid in pushing EU down.
Looking to catch over 200 pips.

EUR/USD Weekly Outlook | Harmonic Butterfly PatternHere is a professional TradingView publish description for your EUR/USD Weekly Butterfly Pattern Analysis:
---
🦋 EUR/USD Weekly Outlook | Harmonic Butterfly Pattern
Pair: EUR/USD
Timeframe: 1W (Weekly)
Strategy: Harmonic Pattern Recognition – Butterfly Pattern
Bias: Bearish Reversal Setup
---
🔍 Pattern Analysis:
Butterfly Harmonic Pattern completed with precision at the 1.272–1.414 extension zone, forming the critical D-point near 1.14700.
Price has reacted sharply from the PRZ (Potential Reversal Zone), aligning with a historical supply zone.
Confluence from Fibonacci extensions:
AB = 0.786 retracement
BC = 0.382 to 0.886 retracement
CD = 1.618 to 2.618 extension
📉 Bearish rejection expected from this high-probability reversal zone.
---
📌 Key Levels:
PRZ (Potential Reversal Zone): 1.14500 – 1.15000
First Target Zone (Support Block): 1.11500 – 1.10500
Invalidation (Pattern Failure): Close above 1.15500
---
📅 Projection: This weekly harmonic butterfly suggests a potential trend reversal or deep pullback. We may see EUR/USD targeting lower support as D-point gets respected. Watch for signs of weakness such as long-wick rejections, bearish engulfing patterns, or RSI divergence confirmation.
---
💡 Conclusion: EUR/USD is at a critical juncture. If the butterfly holds, this could be a high RR short opportunity for swing traders. Patience is key—confirmation on lower timeframes will validate entry.
---
📊 #EURUSD #ButterflyPattern #HarmonicTrading #ForexAnalysis #TechnicalAnalysis #SwingTradeSetup

EURUSD Last push before correction.The EURUSD pair made a new High by breaking above the 1.15725 Resistance and is extending the rally since the January 13 2025 Low. That Low was the Higher Low of the multi-year Channel Up, so the current uptrend is technically its latest Bullish Leg.
The first Bullish Leg of that pattern peaked after a +15.75% rise. We expect a similar peak for the current rally, thus targeting 1.17750, before a new pull-back below the 1D MA50 (blue trend-line).
-------------------------------------------------------------------------------
** Please LIKE 👍, FOLLOW ✅, SHARE 🙌 and COMMENT ✍ if you enjoy this idea! Also share your ideas and charts in the comments section below! This is best way to keep it relevant, support us, keep the content here free and allow the idea to reach as many people as possible. **
-------------------------------------------------------------------------------
Disclosure: I am part of Trade Nation's Influencer program and receive a monthly fee for using their TradingView charts in my analysis.
💸💸💸💸💸💸
👇 👇 👇 👇 👇 👇

DeGRAM | EURUSD formed the double top📊 Technical Analysis
● A double-top printed at the channel roof (≈ 1.1600) and a bearish engulfing candle signal exhaustion; price is slipping back inside last week’s inner trend-median, turning 1.1550 into fresh resistance.
● Hourly RSI diverged lower and the grey return line from 1 June has broken; pattern depth points to 1.1500 support, with the channel mid-band / former triangle apex near 1.1470 as the next magnet.
💡 Fundamental Analysis
● Post-CPI profit-taking meets cautious ECB rhetoric: Lagarde reiterated “no preset easing path,” yet money-markets still price two Fed cuts by year-end, inviting near-term dollar reprieve.
✨ Summary
Short 1.1540-1.1560; break below 1.1520 targets 1.1500 → 1.1470. Bear view void on an H1 close above 1.1600.
-------------------
Share your opinion in the comments and support the idea with like. Thanks for your support!
SELL EURUSD for bullish trend reversal STOP LOSS: 1.1804SELL EURUSD for bullish trend reversal
STOP LOSS: 1.1804
Regular Bearish Divergence
In case of Regular Bearish Divergence:
* The Indicator shows Lower Highs
* Actual Market Price shows Higher Highs
We can see a strong divergence on the MACD already and There is a strong trend reversal on the daily time frame chart.....
The daily time frame is showing strength of trend reversal from this level resistance so we
are looking for the trend reversal and correction push from here .....
TAKE PROFIT : take profit will be when the trend comes to an end, feel from to send me a direct DM if you have any question about take profit or anything
Remember to risk only what you are comfortable with….....trading with the trend, patient and good risk management is the key to success here

euro/usdtrade 5 entry point i belive a reversal is in order if its not it will break the stoplloss and use the resitance as surport and we will then jump on for the bullish but my eye is for it to be bearish right now

EUR/USDTRADE 5 again eu has hit a level and i believe it to go short, this doesnt mean jump into the trade im just looking at where price could go. i belive it to be a good move and we can start to catch these small moves and make profit from them but for now we will just keep are eye on the supply and demand box and see what happends with it

Short signal Sell signal in these zones, targeting the initial move points and liquidity levels at
1.13821 and 1.13275.
Waiting for a great profit opportunity.

EURUSD SHORT FORECAST Q2 W24 D13 Y25EURUSD SHORT FORECAST Q2 W24 D13 Y25
PERHAPS THE LAST CHANCE FOR SHORTS- GRAB A THE BEST DISCOUNT !
Professional Risk Managers👋
Welcome back to another FRGNT chart update📈
Diving into some Forex setups using predominantly higher time frame order blocks alongside confirmation breaks of structure.
Let’s see what price action is telling us today!
💡Here are some trade confluences📝
✅Weekly order block
✅15' order block
✅1 hour order block
✅Tokyo ranges to be filled
🔑 Remember, to participate in trading comes always with a degree of risk, therefore as professional risk managers it remains vital that we stick to our risk management plan as well as our trading strategies.
📈The rest, we leave to the balance of probabilities.
💡Fail to plan. Plan to fail.
🏆It has always been that simple.
❤️Good luck with your trading journey, I shall see you at the very top.
🎯Trade consistent, FRGNT X

I'm selling EURUSD!If you're given an opportunity to sell with small stop loss for a huge gain, will you taken it?
That is what I'm offering now, even if you have different bias, even if you think I'm wrong, just bet on me, just never this trade and I'm sure you wont regret it.
Enjoy

EUR/USD (1-Hour Timeframe) – Bearish Trade Setup Explanation.This chart shows a potential short (sell) opportunity on EUR/USD based on the Smart Money Concept (SMC), focusing on Fair Value Gap (FVG) and Order Block (OB) confluence.
🔍 Key Zone Highlighted:
The price has retraced into a supply zone, which combines:
Fair Value Gap (FVG) – an imbalance created by a strong bearish move.
Order Block (OB) – the last bullish candle before a strong bearish push, now acting as resistance.
This confluence makes the zone (around 1.15870) a high-probability reversal area.
📉 Trade Plan:
Sell Entry: Near the current price at 1.15870, inside the FVG+OB zone.
Stop Loss (SL): Placed above the supply zone at 1.16400 to protect from invalidation.
Target 1: 1.15107 – conservative target based on previous support.
Final Target: 1.14100 – a lower liquidity zone that could be reached if bearish momentum continues.
💡 Logic Behind the Setup:
Price is reacting to a previously respected bearish OB + FVG.
Strong bearish impulse occurred from this zone earlier, suggesting institutional selling.
The retracement back into this zone presents a low-risk, high-reward short entry.
Expectation: price will reject from this zone and move down toward the targets.
✅ Risk-Reward Ratio:
The setup provides a favorable risk-to-reward ratio, especially if the final target is reached.

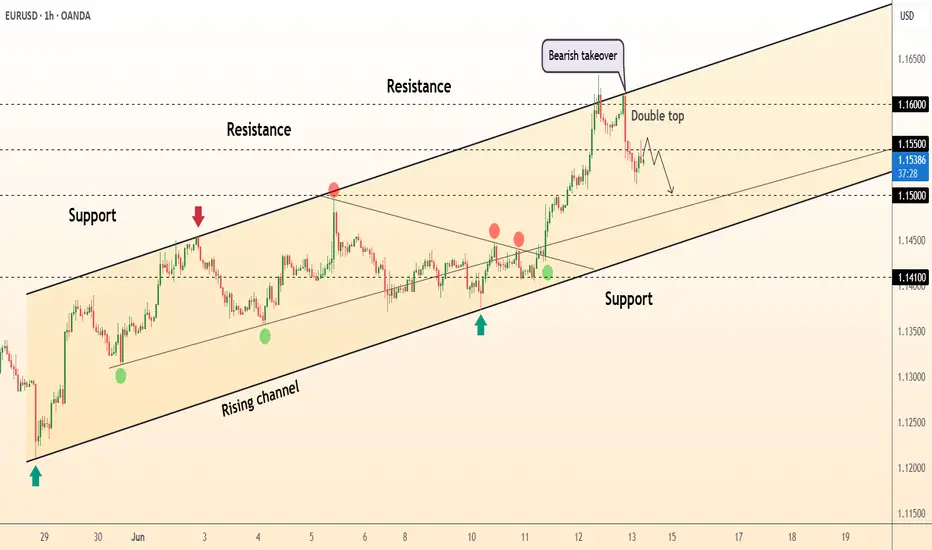
EUR/USD Breakout Retest StrategyEUR/USD Breakout Retest Strategy 🟢📈
📊 Technical Analysis Summary:
The chart illustrates a bullish breakout from a consolidation range with a well-defined support near 1.12500 and resistance between 1.16500–1.17000.
🔍 Key Observations:
🔸 Triple Rejection Zone:
Price faced rejection 3 times (highlighted with orange circles) near the same level before the breakout — classic liquidity sweep above resistance.
🔸 Strong Support Bounce:
Each time price reached the green support zone, it showed strong bullish reaction (green arrows) signaling solid buying interest.
🔸 Break and Retest Formation:
Price broke the previous highs and now seems to be retesting the breakout zone (around 1.15250–1.15300). A successful retest could confirm bullish continuation.
🔸 Projected Bullish Move:
If the retest holds, we may see price pushing up toward the 1.17000 resistance zone as marked.
📌 Trading Plan:
✅ Bullish Bias above 1.15250
✅ Look for bullish candlestick confirmation or breakout structure
🚫 Avoid trades if price drops below 1.15000 with momentum
📈 Target Zone: 1.16500 – 1.17000
🛑 Stop Loss suggestion: Below 1.14750
🧠 Keep patience during the retest — smart money often tests emotions before real moves! 💰📉📈

Bearish drop?Fiber (EUR/USD) has reacted off the pivot which is a pullback resistance and could drop to the 1st support which is an overlap support.
Pivot: 1.1449
1st Support: 1.1371
1st Resistance: 1.1496
Risk Warning:
Trading Forex and CFDs carries a high level of risk to your capital and you should only trade with money you can afford to lose. Trading Forex and CFDs may not be suitable for all investors, so please ensure that you fully understand the risks involved and seek independent advice if necessary.
Disclaimer:
The above opinions given constitute general market commentary, and do not constitute the opinion or advice of IC Markets or any form of personal or investment advice.
Any opinions, news, research, analyses, prices, other information, or links to third-party sites contained on this website are provided on an "as-is" basis, are intended only to be informative, is not an advice nor a recommendation, nor research, or a record of our trading prices, or an offer of, or solicitation for a transaction in any financial instrument and thus should not be treated as such. The information provided does not involve any specific investment objectives, financial situation and needs of any specific person who may receive it. Please be aware, that past performance is not a reliable indicator of future performance and/or results. Past Performance or Forward-looking scenarios based upon the reasonable beliefs of the third-party provider are not a guarantee of future performance. Actual results may differ materially from those anticipated in forward-looking or past performance statements. IC Markets makes no representation or warranty and assumes no liability as to the accuracy or completeness of the information provided, nor any loss arising from any investment based on a recommendation, forecast or any information supplied by any third-party.

EURUSD SHORTeurusd short bearish price action.price rejected from the resistance thrice and continue pushing bearish.expecing more continuation of the bearish movement

Bullish continuation?The Fiber (EUR/USD) is falling towards the pivot which acts as a pullback support and could bounce to the 1st resistance that lines up with the 127.2% Fibonacci resistance.
Pivot: 1.1447
1st Support: 1.1210
1st Resistance: 1.1712
Risk Warning:
Trading Forex and CFDs carries a high level of risk to your capital and you should only trade with money you can afford to lose. Trading Forex and CFDs may not be suitable for all investors, so please ensure that you fully understand the risks involved and seek independent advice if necessary.
Disclaimer:
The above opinions given constitute general market commentary, and do not constitute the opinion or advice of IC Markets or any form of personal or investment advice.
Any opinions, news, research, analyses, prices, other information, or links to third-party sites contained on this website are provided on an "as-is" basis, are intended only to be informative, is not an advice nor a recommendation, nor research, or a record of our trading prices, or an offer of, or solicitation for a transaction in any financial instrument and thus should not be treated as such. The information provided does not involve any specific investment objectives, financial situation and needs of any specific person who may receive it. Please be aware, that past performance is not a reliable indicator of future performance and/or results. Past Performance or Forward-looking scenarios based upon the reasonable beliefs of the third-party provider are not a guarantee of future performance. Actual results may differ materially from those anticipated in forward-looking or past performance statements. IC Markets makes no representation or warranty and assumes no liability as to the accuracy or completeness of the information provided, nor any loss arising from any investment based on a recommendation, forecast or any information supplied by any third-party.

EURUSD is continuing its uptrendEURUSD is still in a strong uptrend. There was a drop in the Asian and European sessions on Friday but that was not enough to reverse the pair. The end of the US session saw the price being pushed up by the bulls from the 1.155 price zone and is stuck in this resistance zone.
The price continues to increase when breaking 1.155 will head towards the resistance of 1.161, the highest peak of last week. If there is a retest of 1.155, the price will head towards 1.166 next week to be able to use short-term SELL strategies
The BUY strategy is still prioritized as the EU is still in an uptrend. The main BUY zone of the pair is still waiting for 1.150 and lower is the breakout zone of 1.145
Resistance: 1.161, 1.166
Support: 1.150, 1.145
