EURUSD Analysis Today: Technical and Order Flow Analysis !In this video I will be sharing my EURUSD analysis today, by providing my complete technical and order flow analysis, so you can watch it to possibly improve your forex trading skillset. The video is structured in 3 parts, first I will be performing my complete technical analysis, then I will be moving to the COT data analysis, so how the big payers in market are moving their orders, and to do this I will be using my customized proprietary software and then I will be putting together these two different types of analysis.
EURUSD_W trade ideas

EURUSD - Bullish Continuation ConfluencesStory : Market is making series of HH and HL with a trendline support respect. Market has respected Fib level of 50% on HL at 1.14747 level. Currently there is no divergence therefore we are ignoring any reversal or Harmonic pattern. however, Bullish Flag pattern can be seen on the chart. Also the Seasonal of this pair is Bullish in the month of June based on last 15 years data
Anticipate : I anticipate that market will keep moving in bullish trend.
Plan : We plan our entry on the break of neckline which is 1.16272 and with our R:R of 1:1 & 1:2 plan our TPs accordingly at 1.17935 and 1.19252 as marked in the chart.
Pull the trigger Guyz and grab your profit.
DO like, share and comment if you liked tha analysis.

EUR/USD Forms Inside Day at Key ResistanceWith the greenback under pressure, we take a look at EUR/USD, which has just formed an inside day pattern at key resistance. As both macro headwinds and high-impact data loom, the next breakout or fakeout could set the tone for the week ahead.
Dollar under pressure ahead of high-stakes week
The dollar is reeling after Donald Trump reignited global trade tensions, pushing the currency to its weakest level in three years. His comments about reintroducing reciprocal tariffs within weeks have triggered a sharp decline in the greenback, which fell over 0.8% against a basket of major peers. Alongside this, geopolitical jitters over Iran and reports that the US may reassess its Aukus defence pact have further dampened sentiment, with traders increasingly questioning the strength of America’s international alliances.
The weakening in the dollar has been exacerbated by weaker-than-expected inflation, which has encouraged market participants to bet more heavily on interest rate cuts from the Fed later this year. Futures now price in two quarter-point cuts, undermining the dollar’s yield advantage. Meanwhile, the euro has found support from signs that the ECB may be nearing the end of its cutting cycle, adding relative strength to the single currency. All eyes now turn to Tuesday’s US industrial production figures, followed by EU inflation data and the Fed’s interest rate decision on Wednesday, as traders look for fresh direction.
Compression at resistance: All eyes on Thursday’s range
Last week’s rally saw EUR/USD push into a key level, with price retesting resistance created by the April highs. Although the pair briefly broke through on Thursday with a close above the level, Friday’s session was far more cautious. Price action stayed entirely within Thursday’s range, forming an inside day pattern that now acts as a pressure point for the next directional move.
This setup reflects a temporary standoff between bullish momentum and longer-term resistance. Inside days often precede breakouts, but they can also lure in traders only to reverse violently. The key now lies in how price reacts to the boundaries of Thursday’s range. A close above it, particularly on strong volume, would be a clear signal of continuation and likely invite further buying. A close below it on strong volume would mark a failed breakout and open the door to a short setup.
For those trading this setup, Thursday’s high and low now form essential levels. Not only do they serve as breakout triggers, but they also offer logical zones for stop placement. In short, the market is coiled, the fundamentals are volatile, and price is poised.
EUR/USD Daily Candle Chart
Past performance is not a reliable indicator of future results
EUR/USD Hourly Candle Chart
Past performance is not a reliable indicator of future results
Disclaimer: This is for information and learning purposes only. The information provided does not constitute investment advice nor take into account the individual financial circumstances or objectives of any investor. Any information that may be provided relating to past performance is not a reliable indicator of future results or performance. Social media channels are not relevant for UK residents.
Spread bets and CFDs are complex instruments and come with a high risk of losing money rapidly due to leverage. 85.24% of retail investor accounts lose money when trading spread bets and CFDs with this provider. You should consider whether you understand how spread bets and CFDs work and whether you can afford to take the high risk of losing your money.

EURUSD WEEKLY HTF FORECAST Q2 W25 Y25EURUSD WEEKLY HTF FORECAST Q2 W25 Y25
Professional Risk Managers👋
Welcome back to another FRGNT chart update📈
Diving into some Forex setups using predominantly higher time frame order blocks alongside confirmation breaks of structure.
💭NOTE- If price closes above the key weekly/ daily order block with daily close- re evaluation will be required.
🔑 Remember, to participate in trading comes always with a degree of risk, therefore as professional risk managers it remains vital that we stick to our risk management plan as well as our trading strategies.
📈The rest, we leave to the balance of probabilities.
💡Fail to plan. Plan to fail.
🏆It has always been that simple.
❤️Good luck with your trading journey, I shall see you at the very top.
🎯Trade consistent, FRGNT X

EUR/USD Bullish Setup: Long from Fib & Trendline SupportEUR/USD is in a bullish continuation. We’re now looking for a long entry between the 0.618 Fibonacci level and trendline support, with the stop-loss placed below recent lows. Targeting current highs and potential new highs.

possibility of correctionConsidering the price behavior in the current support range, there is a possibility of an upward trend. Otherwise, the continuation, with the support range broken, of a continuation of the downward trend is likely.

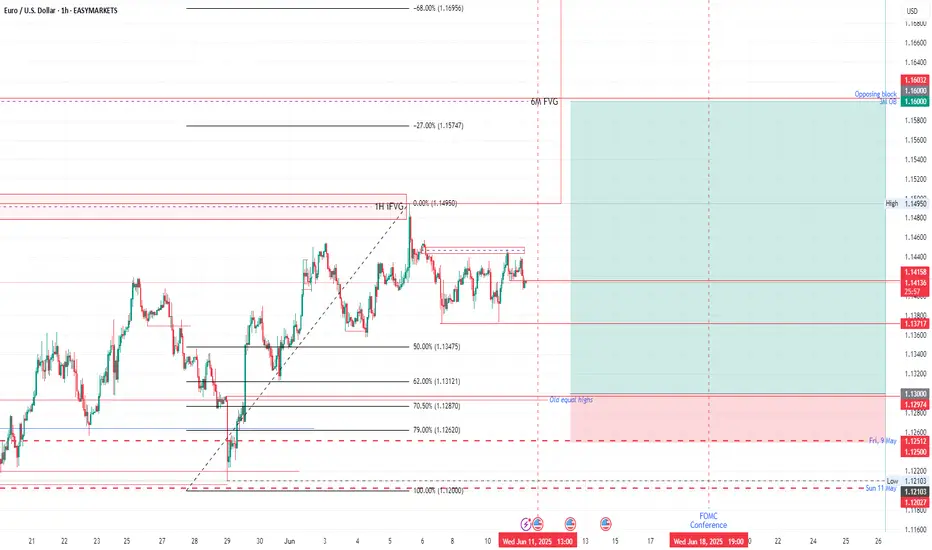
Fiber holds Bullish (but not for long)## 1 Hour (Intraday)
!
1. **Order-block / Fair-Value Gap**
* The small 1H consolidation you’ve boxed (roughly 1.1420–1.1450) is a late-hour fair-value gap (FVG) that often resolves with a quick run to its edge.
* A drop into the lower end (1.137–1.138) gives you liquidity for your long and aligns with the 1D 50 % retrace (1.13475).
2. **Pending Entries**
* **Buy-limit @ 1.1300**: Still unfilled. If price dips there, it converges the 1D 62 %–70.5 % zones (1.1312–1.1287) plus the old daily high → high-probability long.
* **Sell-limit @ 1.1600**: Above today’s high, overlapping the 6 M FVG at 1.1575 and the 3 M opposing block.
3. **Probability & Timeline**
* **To 1.1300**: \~30 % shot over the next 24–48 h as banks chase stops under 1.135.
* **To 1.1600**: \~25 % chance intraday if FOMC jitters push USD weaker post-June 18.
---
## 1 Month (Position)
!
1. **Longer-term Fib & Time-zones**
* The full trough-to-peak fib (0 %→100 %) defines the 127 % extension at \~1.310, 227 % at \~1.214, 327 % at \~1.246.
* Your current clip sits just above the 127 % (1.310) retracement zone on a mini scale; the next *real* hurdle is the 227 % zone near 1.214/1.234 (old highs).
2. **Macro-Blocks**
* **3-month OB @1.1600**, **6-month FVG @1.1575**: your first “stop‐runs” on the way to the big opposing block at 1.2750 (500 %).
* Seasonal tailwinds tend to kick in around July–August as EU carry trades re-enter.
3. **Timeline & Odds**
* **Lift into 1.1575–1.1600**: \~60 % chance by late June → early July.
* **Extension toward 1.214–1.234** (long-term target): \~30 % chance by Q4 2025, assuming US yields peak and EUR carry resumes.
---
### Live-Data Check (Today ≈ 1.1415)
* **Above 1.1375** (daily 50 %) → bullish tilt until proven otherwise.
* **Below 1.1450** (1H FVG top) → still in consolidation zone; gives you a low-risk long if you see a wick down to 1.137–1.138.
* **No invalidation**: you’ve got room to run both your buy and sell limits without being stopped out today.
---
## Overall Probability & Path
| Leg | Zone | Prob. | Target Window |
| -------------- | --------------------------- | ----- | -------------- |
| Intraday sweep | 1.137→1.145 consolidation | 70 %↑ | next 1–2 days |
| Buy-zone test | 1.1300 (62–70 % daily fib) | 30 % | next 24–48 h |
| Swing rally | 1.1575–1.1600 (6 M FVG/OB) | 55 % | June 18–July 5 |
| Position drive | 1.214–1.234 (227–327 % fib) | 30 % | Q3–Q4 2025 |
1. **Catalysts**:
* **June 18 FOMC** (watch the red line) will likely ignite the swing leg.
* **July seasonal flows** (month-end rebalancing) give the first bump into your fair-value blocks.
2. **Risk management**:
* Keep your stops below 1.1340 for intraday longs, or below 1.1250 for the monthly swing.
* Scale out 50 % at 1.1575, trail the rest into the big opposing block.
---
— S.Atrial
Sideways movement on EURUSDEURUSD continues to trade within the range set by Friday’s news.
Tomorrow’s upcoming news is likely to trigger bigger moves.
Until then, there’s no clear reason to enter new positions.
Keep an eye out for potential trend continuation opportunities once the current correction ends.

EURUSd a big move down
📉 EUR/USD Analysis | 2H Timeframe
Wave 5 in play! 🚨
Structure shift confirmed with BOS at key supply zone. Expecting liquidity sweep and a bearish reversal 📉
🧠 Smart Money + Elliott Wave Combo:
🔹 BOS at Wave 3 ✅
🔹 Wave 4 retracement held
🔹 Anticipating Wave 5 top-out and reversal
🔹 Targeting major demand zones (blue lines)
🔻 Potential Sell Setup Loading…
📆 Monday, 16 June | 2H Chart
🔍 PEPPERSTONE: EUR/USD
💬 Drop your thoughts below or DM “WAVE” to learn this strategy!
—
🔖 #eurusd #forexanalysis #elliottwave #smartmoneyconcepts #forextrader #fxsignals #technicalanalysis

long on EURUSD 15m*The content on this analysis is subject to change at any time without notice, and is provided for the sole purpose of assisting traders to make independent investment decisions.

EURUSDEURUSD needs a correction, we are expecting this correction to start in this week.
Disclosure: We are part of Trade Nation's Influencer program and receive a monthly fee for using their TradingView charts in our analysis.

EURUSD POTENTIAL SHORT OPPORTUNITYHello Everyone!
How are you all?
EurUsd is a pair to watch in the coming days/weeks, because it is shaping up very nicely for a short trend reversal that we can capitalize on.
So, I will be looking for a sell opportunity because of the following reasons:
1. The price has formed a sell reversal structure with two lows and a potential third touch at the high.
2. The price is approaching a value area.
Game Plan:
If the price comes to the VA, and rejects at that level or sweeps the High, and makes a bearish impulse followed by a H1 flag with two highs and lows.
Entry : will look for a risk sell entry within the flag or a reduced risk entry on the breakout of the flag.

My Thoughts #016HTF
The pair is in a bullish trend
In the trend it's currently making a new HH on the lower time frame.
LTF
Since it's making a HH it means it's in a bullish trend
Currently in the bullish it's making a HL
It could sell and drop lower to invalidate the set up
Use proper risk management
Let's do the most

EURUSD is in uptrend within up channelEURUSD is in uptrend within up channel. US dollar is continously weakening due to political crisis in cities.

Update...#014The market just smashed my tp... It's one trade I got learn a lot from this trade here is to more trades like this
Let's do the most 🏆❤️🙏

EURUSD BULLISH OR BARISH DETAILED ANALYSISEURUSD is showing strong bullish momentum after a clean bounce from the key support zone around 1.12. Price structure confirms higher lows and strong bullish candle formations on the daily chart, suggesting the bulls are in control. This recent move is backed by a textbook retest and rejection from the previous resistance-turned-support zone, giving confidence in a potential continuation toward the 1.19 level. With the current price trading near 1.15 and pushing higher, the market is positioned for a strong bullish wave in the coming sessions.
From a fundamental perspective, the Euro has gained fresh support after the ECB’s decision last week to proceed with a measured and data-dependent rate cut cycle. While the ECB delivered its first cut, the tone was cautious and far less dovish than anticipated, which kept EUR strength intact. On the USD side, traders are pricing in a more dovish outlook for the Federal Reserve, especially with recent CPI and PPI data pointing toward cooling inflation. This divergence in policy outlook continues to favor EURUSD upside in the medium term.
Technical indicators are also confirming the bullish bias. The pair is riding an ascending trendline, and momentum indicators like RSI remain in bullish territory without yet being overbought. A daily close above the 1.1550 area strengthens the case for a continuation move. The price is aiming for the next major resistance around 1.1770–1.19, where bulls are likely to take profit or scale out. Until then, dips are likely to be bought aggressively, as long as the 1.12 support remains intact.
This setup presents a high-probability opportunity in a trending market backed by both fundamentals and technical confluence. As long as the bullish structure holds, I remain long-biased on EURUSD with eyes on the 1.19 zone as the next key level. With increasing market interest, low volatility on the downside, and strong trend-following signals, this pair is set for a continued rally.

EURUSD shortThe Setup:
1. A-B: Strong impulsive drop on increasing volume → clear evidence of real selling pressure.
2. B-C: Pullback forms on decreasing volume → classic corrective behavior, not buyer aggression.
3. C-D: Entry just below point C as new volume confirms sellers stepping back in.
4. Targeting >3R with stop tucked above C — logical structure, clean invalidation.
✅ Volume confirms the trend
✅ Structure is tight, no randomness
✅ Timing aligns with volatility spike (news at the bottom?)
✅ Clear bearish continuation pattern
what do you think of this a head of cpi?

EUR/USD – 1H Chart SetupMarket Phase: Distribution
Trade Bias: Bearish Breakdown
We’re currently observing a distribution phase on EUR/USD, with well-defined support and resistance levels. A breakdown below Support Level 2 will trigger our short entry, confirming bearish momentum.
📌 Trade Setup Details:
🔹 Entry (Sell Stop): 1.13080
🔹 Stop Loss (SL): 1.13600 (above Support Level 1)
🔹 Take Profit 1 (TP1): 1.12560
🔹 Take Profit 2 (TP2): 1.12040
🔹 Lot Size: 0.19
🔹 Risk/Reward Ratios: 1:1 and 1:2
🔹 Risk: $200 💸
🔹 Reward: Up to $300 💰
This setup is based on a clean structure break, expecting downside continuation after the distribution completes. We’ve marked the key zones on the chart and are waiting for confirmation through a support break.
Keep an eye on price action and volume near the entry to validate the breakdown.
#EURUSD #ForexTrading #BearishSetup #DistributionPhase #PriceAction #SupportResistance #TradeSetup #RiskReward #BreakdownTrade #ForexSignals #1HChart
Unlock more with Plus

EUR/USD 2-Hour Chart Analysis2-hour candlestick analysis of the Euro/US Dollar (EUR/USD) pair, with a recent uptrend from a low of 1.15244 to 1.15816 (+0.26%). A breakout above the resistance level is highlighted, suggesting potential bullish momentum.

EURUSD at Key Resistance – Bull Trap or Breakout Incoming?The Euro has rallied into a major supply zone at 1.15800+, a level that hasn’t been broken since mid-2023. As price trades within this supply range, traders are eyeing either a strong breakout or a potential rejection back toward demand.
🟦 Key Supply Zone: 1.14994 – 1.16100
🟧 Major Demand Zones:
• 1.09023 (mid-range)
• 1.02903 (long-term support & prior consolidation base)
⚖️ Current Outlook:
• EURUSD is showing strength, but bullish momentum is slowing at resistance.
• A rejection candle from here could signal downside toward 1.0900 and even 1.0290.
• Break and close above 1.16100 on the daily would confirm bullish continuation toward untested zones.
🗓️ Marked Date: January 29, 2025 – Previous structure shift & start of bullish wave
💡 Watch Closely:
Price behavior around the current supply zone will determine direction for weeks ahead. Risk/reward now favors patient traders — wait for confirmation!
🧠 Chart Tools:
LuxAlgo Supply & Demand Visible Range
Timeframe: Daily (1D)
🚨 Potential Scenarios:
🔺 Breakout = Target 1.1800+
🔻 Rejection = Drop toward 1.0900 – 1.0300
👇 What’s your bias here? Are the bulls done or just getting started?
#EURUSD #ForexSignals #LuxAlgo #SupplyAndDemand #PriceAction #ForexStrategy #BreakoutOrRejection #FrankFx #TradingViewAnalysis #SmartMoneyTraders

USD/JPY Short, AUD/NZD Short, AUD/JPY Neutral and EUR/USD ShortUSD/JPY Short
Minimum entry requirements:
- If tight non-structured 5 min continuation forms, reduced risk entry on the break of it.
- If tight structured 5 min continuation forms, reduced risk entry on the break of it or 5 min risk entry within it.
- If tight non-structured 15 min continuation forms, 5 min risk entry within it if the continuation is structured on the 5 min chart or reduced risk entry on the break of it.
- If tight structured 15 min continuation forms, reduced risk entry on the break of it or 15 min risk entry within it.
AUD/NZD Short
Minimum entry requirements:
- If tight non-structured 15 min continuation forms, 5 min risk entry within it if the continuation is structured on the 5 min chart or reduced risk entry on the break of it.
- If tight structured 15 min continuation forms, reduced risk entry on the break of it or 15 min risk entry within it.
AUD/JPY Neutral
Minimum entry requirements:
- If structured 1H continuation forms, 1H risk entry within it.
Minimum entry requirements:
- 1H impulse down below area of value.
- If tight non-structured 5 min continuation follows, reduced risk entry on the break of it.
- If tight structured 5 min continuation follows, reduced risk entry on the break of it or 5 min risk entry within it.
- If tight non-structured 15 min continuation follows, 5 min risk entry within it if the continuation is structured on the 5 min chart or reduced risk entry on the break of it.
- If tight structured 15 min continuation follows, reduced risk entry on the break of it or 15 min risk entry within it.
EUR/USD Short
Minimum entry requirements:
- Tap into area of value.
- 1H impulse down below area of value.
- If tight non-structured 15 min continuation follows, 5 min risk entry within it if the continuation is structured on the 5 min chart or reduced risk entry on the break of it.
- If tight structured 15 min continuation follows, reduced risk entry on the break of it or 15 min risk entry within it.

How To Find Trends On A ChartIn this short video, I help you identify a down trend, a sideways market, and an up trend. I also offer a practice I used when starting to build up my proficiency in identifying these trends on a chart.

Bullish momentum to extend?The Fiber (EUR/USD) is falling towards the pivot which is a pullback support and could bounce to the 1st resistance which is also a pullback resistance.
Pivot: 1.1079
1st Support: 1.1075
1st Resistance: 1.1512
Risk Warning:
Trading Forex and CFDs carries a high level of risk to your capital and you should only trade with money you can afford to lose. Trading Forex and CFDs may not be suitable for all investors, so please ensure that you fully understand the risks involved and seek independent advice if necessary.
Disclaimer:
The above opinions given constitute general market commentary, and do not constitute the opinion or advice of IC Markets or any form of personal or investment advice.
Any opinions, news, research, analyses, prices, other information, or links to third-party sites contained on this website are provided on an "as-is" basis, are intended only to be informative, is not an advice nor a recommendation, nor research, or a record of our trading prices, or an offer of, or solicitation for a transaction in any financial instrument and thus should not be treated as such. The information provided does not involve any specific investment objectives, financial situation and needs of any specific person who may receive it. Please be aware, that past performance is not a reliable indicator of future performance and/or results. Past Performance or Forward-looking scenarios based upon the reasonable beliefs of the third-party provider are not a guarantee of future performance. Actual results may differ materially from those anticipated in forward-looking or past performance statements. IC Markets makes no representation or warranty and assumes no liability as to the accuracy or completeness of the information provided, nor any loss arising from any investment based on a recommendation, forecast or any information supplied by any third-party.
