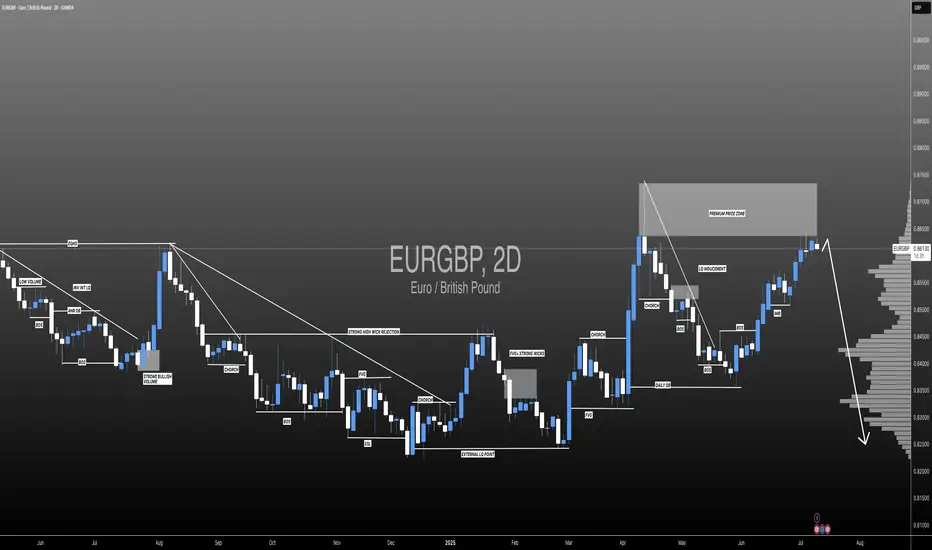
EURGBP: Is This The End Of The Bulls? The GBP/USD pair has exhibited a consistent bullish trend, driven by a remarkable price momentum that is unprecedented in recent history. However, we anticipate a potential bearish reversal, as the market is witnessing a confluence of bearish indicators and increasing volume. Historically, the British pound has held a dominant position in this market, and long-term bears are likely to gain control.
Therefore, it is crucial to closely monitor the incoming market volume and, most importantly, the prevailing market sentiment. Your continued support throughout this journey is greatly appreciated. If you wish to encourage us, kindly like and comment on our ideas.
Team Setupsfx_
❤️❤️🚀🚀
EUXGBP trade ideas
EURGBP In a Clear Bullish TrendEURGBP In a Clear Bullish Trend
EURGBP Is moving in a clear bullsh trend for a long time.
A few days ago, the price broke out of another and clear bullish pattern.
If the volume grows further and the price respects this new pattern EURGBP may rise to 0.8710 and 0.8770 during the coming days or week.
The data we have this week could support this movement.
You may find more details in the chart!
Thank you and Good Luck!
PS: Please support with a like or comment if you find this analysis useful for your trading day
Disclosure: I am part of Trade Nation's Influencer program and receive a monthly fee for using their TradingView charts in my analysis.

Two interesting FX technical strategies under close watchWhile the US dollar is the weakest major currency on the foreign exchange (FX) market this year 2025, and the question of its low point arises, two other currencies seem important to me to put under close watch for this month of July: the Pound Sterling (GBP) and the Hong Kong dollar (HKD). To begin with, you can reread our latest analysis below (by clicking on the chart), which raises the question of a possible future low point for the US dollar on the FX.
The British pound, which was buoyed by positive momentum at the start of the year, is now facing fiscal and bond risks that are weakening it. At the same time, the Hong Kong dollar is testing the solidity of its parity mechanism with the greenback, forcing the local monetary authority to step up interventions to preserve its credibility. The EUR/GBP rate could be a good strategy for hedging against the risk of a fall in sterling. As for the USD/HKD rate, the upper end of the PEG could once again provide good resistance for a trading strategy.
1) Sterling is under pressure from UK bond yields, and the EUR/GBP rate presents an interesting chart configuration
The EUR/GBP rate, a barometer of confidence in the British currency, could come under upward pressure if UK budget fears persist. Tensions intensified after Keir Starmer's Labour government abandoned several budget-saving measures, deepening an already worrying deficit. As a result, yields on 30-year British government bonds jumped 19 basis points in a single session, their biggest rise since April, triggering a sharp decline in the pound. This context is reminiscent of the episodes of 2022 under Liz Truss, when British fiscal credibility wavered sharply. In the short term, the prospect of an autumn tax hike by Chancellor Rachel Reeves could fuel volatility.
From a technical analysis point of view, the EUR/GBP rate is following an underlying uptrend, and the guarantor of this trend is support at 0.8250. We must therefore keep a close eye on the evolution of British long rates and tax announcements, which will condition the trajectory of the EUR/GBP rate. If British debt continues to worry the market, then the EUR/GBP rate could continue its rise towards resistance at 0.90. Breaking support at 0.8250 would invalidate this chart scenario.
2) The USD/HKD rate is testing the upper end of the PEG defended by the Hong Kong monetary authorities
The USD/HKD rate is once again testing the upper limit of the “peg” set between 7.75 and 7.85 HKD per US dollar. Since the end of June, the weakness of local interest rates, with the one-month Hibor falling to 0.86%, i.e. almost 350 basis points below the cost of the dollar, has encouraged speculative positions against the Hong Kong dollar. To defend parity, the Hong Kong Monetary Authority (HKMA) intervened on several occasions, repurchasing a total of 59 billion Hong Kong dollars and significantly reducing the liquidity of the banking system. The latest operation, for HK$29.6 billion, is testimony to the extent of the pressure on the peg.
For traders, this context offers short-term technical opportunities, by playing the bounces near the upper limit of the convertibility band. Nevertheless, the persistence of a high interest-rate differential between the United States and Hong Kong raises the risk of prolonged tension. In recent years, the Hong Kong Monetary Authority has always succeeded in preventing the 7.85 resistance level from being breached, but caution and risk awareness are required before using this resistance for FX trading strategies.
DISCLAIMER:
This content is intended for individuals who are familiar with financial markets and instruments and is for information purposes only. The presented idea (including market commentary, market data and observations) is not a work product of any research department of Swissquote or its affiliates. This material is intended to highlight market action and does not constitute investment, legal or tax advice. If you are a retail investor or lack experience in trading complex financial products, it is advisable to seek professional advice from licensed advisor before making any financial decisions.
This content is not intended to manipulate the market or encourage any specific financial behavior.
Swissquote makes no representation or warranty as to the quality, completeness, accuracy, comprehensiveness or non-infringement of such content. The views expressed are those of the consultant and are provided for educational purposes only. Any information provided relating to a product or market should not be construed as recommending an investment strategy or transaction. Past performance is not a guarantee of future results.
Swissquote and its employees and representatives shall in no event be held liable for any damages or losses arising directly or indirectly from decisions made on the basis of this content.
The use of any third-party brands or trademarks is for information only and does not imply endorsement by Swissquote, or that the trademark owner has authorised Swissquote to promote its products or services.
Swissquote is the marketing brand for the activities of Swissquote Bank Ltd (Switzerland) regulated by FINMA, Swissquote Capital Markets Limited regulated by CySEC (Cyprus), Swissquote Bank Europe SA (Luxembourg) regulated by the CSSF, Swissquote Ltd (UK) regulated by the FCA, Swissquote Financial Services (Malta) Ltd regulated by the Malta Financial Services Authority, Swissquote MEA Ltd. (UAE) regulated by the Dubai Financial Services Authority, Swissquote Pte Ltd (Singapore) regulated by the Monetary Authority of Singapore, Swissquote Asia Limited (Hong Kong) licensed by the Hong Kong Securities and Futures Commission (SFC) and Swissquote South Africa (Pty) Ltd supervised by the FSCA.
Products and services of Swissquote are only intended for those permitted to receive them under local law.
All investments carry a degree of risk. The risk of loss in trading or holding financial instruments can be substantial. The value of financial instruments, including but not limited to stocks, bonds, cryptocurrencies, and other assets, can fluctuate both upwards and downwards. There is a significant risk of financial loss when buying, selling, holding, staking, or investing in these instruments. SQBE makes no recommendations regarding any specific investment, transaction, or the use of any particular investment strategy.
CFDs are complex instruments and come with a high risk of losing money rapidly due to leverage. The vast majority of retail client accounts suffer capital losses when trading in CFDs. You should consider whether you understand how CFDs work and whether you can afford to take the high risk of losing your money.
Digital Assets are unregulated in most countries and consumer protection rules may not apply. As highly volatile speculative investments, Digital Assets are not suitable for investors without a high-risk tolerance. Make sure you understand each Digital Asset before you trade.
Cryptocurrencies are not considered legal tender in some jurisdictions and are subject to regulatory uncertainties.
The use of Internet-based systems can involve high risks, including, but not limited to, fraud, cyber-attacks, network and communication failures, as well as identity theft and phishing attacks related to crypto-assets.

EURGBPI'm looking at a short-term trade to the upside—low risk. I’d typically go aggressive on setups like this, since I'm trading with the current trend. Price has formed a lower high and a lower low, and now I’m anticipating a lower high within an emerging uptrend.

EURGBP - Follow The Bulls!Hello TradingView Family / Fellow Traders. This is Richard, also known as theSignalyst.
📈EURGBP has been overall bullish trading within the rising channel marked in blue. And it is currently retesting the lower bound of the channel.
Moreover, the orange zone is a strong daily support.
🏹 Thus, the highlighted blue circle is a strong area to look for buy setups as it is the intersection of the lower blue trendline and support.
📚 As per my trading style:
As #EURGBP approaches the blue circle zone, I will be looking for bullish reversal setups (like a double bottom pattern, trendline break , and so on...)
📚 Always follow your trading plan regarding entry, risk management, and trade management.
Good luck!
All Strategies Are Good; If Managed Properly!
~Rich
Disclosure: I am part of Trade Nation's Influencer program and receive a monthly fee for using their TradingView charts in my analysis.

Do you agree with a big profit in EURGBP?Hi my dears
The pattern seems to be broken, so let's go up.
Join me with a guaranteed profit.
If you liked my analysis, please support my page.

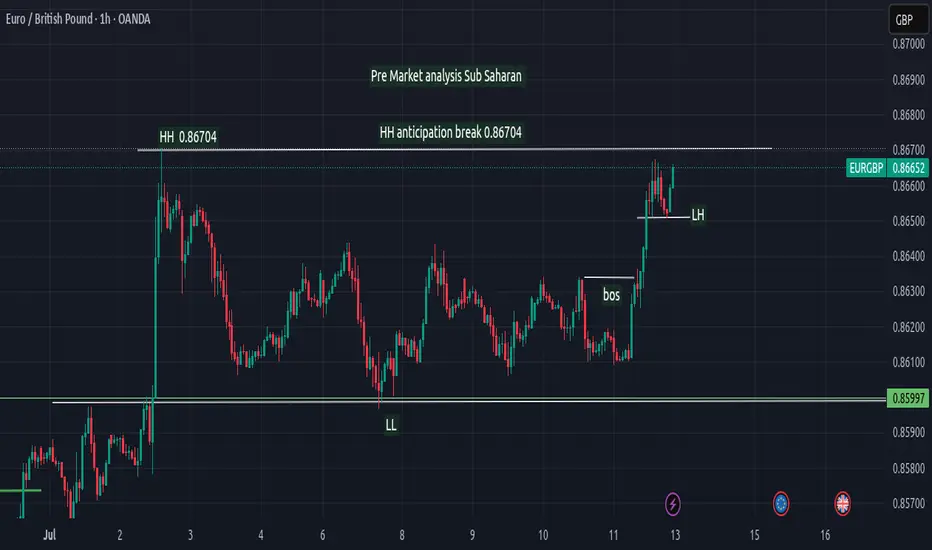
EURGBP EUR/GBP Pre-Market Top-Down Analysis
Date: July 13, 2025
Session: London Pre-Market
Analyst: Sub Saharan
🕰️ 1H Chart Overview
EUR/GBP is currently trading around 0.86652, with bullish momentum pushing toward the previous high at 0.86704, marked as HH (Higher High) on the chart. This level is a significant resistance, and a confirmed break and close above it could signal further bullish continuation.
🔍 Structure Breakdown
Key Levels and Market Structure:
HH (Higher High): 0.86704
LL (Lower Low): 0.85997
Recent HL (Higher Low): Series of HLs forming support during the rally.
Break of Structure (BOS): Occurred on July 11, indicating a shift from bearish to bullish momentum.
Key POI (Point of Interest): 0.86586 – Marked for potential buy entries based on LH structure.
🔁 Scenario Planning
🔼 Bullish Continuation Scenario
Bias: Buy on retracement
Plan: If price pulls back and respects the LH zone (0.86586) without breaking below it, look for bullish setups with target around or above 0.86704.
Confirmation: Rejection candle or bullish engulfing at POI
🔽 Bearish Reversal Scenario
Bias: Sell if structure shifts
Condition: If price breaks below the last HL to form a Lower Low (LL), it may indicate weakness.
Plan: Wait for a pullback to the broken LH zone (0.86586) to re-test as resistance, then sell with confirmation.
Target: Mid-range or previous low near 0.85997
🧠 Trading Insight
The price is in a bullish correction phase within a rising trend.
Aggressive buyers may consider early entries at or above 0.86586, but conservative traders should wait for price action confirmation.
If a lower low prints, treat it as a signal for potential structure change and reposition for short-term sells.
🧾 Trade Management Tips
Use 0.86704 as your decision point. Break and hold = bullish continuation.
POI at 0.86586 is key for both buy re-entries or sell re-tests.
Set alerts for structural changes (new LL or break of HH).
📌 Summary
Bias Key Level Action
Bullish 0.86586 Buy on retracement (if HL forms)
Bearish Below 0.86586 Sell if LL forms, re-test at LH
Stay patient and react to structure—not emotions. London session volatility may provide the liquidity needed to trigger setups.
EURGBP 1D: This isn't a breakoutEURGBP 1D: This isn't a breakout — it's a deep reaction before the real move
EURGBP continues to form a textbook bullish megaphone, a structure designed not to trend, but to destabilize — forcing liquidity on both sides while smart money quietly positions. Two touches above (January and April), two below (February and May) — clean geometry, expanding volatility. Price is now reacting from the lower boundary, but we are still inside the pattern — and that matters.
The reaction zone sits right on the 0.786 Fibonacci level, near 0.8350, precisely where price meets the lower trendline and the 200-day moving average. The bounce didn’t come from noise — it came from confluence. Candle structure is clean, volume slightly expands — not panic, but controlled demand. As long as price holds above the MA200, the scenario remains intact. A break below kills the setup — but that hasn’t happened.
We’re not in breakout mode — yet. But price action is shifting. Pullbacks are weak, candles are full-bodied, and sellers don’t press. Momentum indicators confirm early recovery, but the real signal lies in how price holds its ground at key structure without struggle. Buyers aren’t running — they’re holding position.
If the market pushes above 0.8430–0.8480 and confirms — acceleration begins. Until then, we remain in balance. Every candle is a stress test — and so far, the structure is holding strong. If smart money controls 0.8350, the breakout won’t just be bullish — it’ll be aggressive.

EURGBP reached strong resistance: Likely reversal incomingPrice has been in a strong impulsive rally, pushing aggressively into a well established resistance zone. This zone is marked by a prior sharp sell-off, suggesting it could trigger selling interst again.
The current move appears overextended in the short term. The ascending channel is extremly vertical, showing momentum, but this type of movement often leads to exhaustion, especially when met with a key zone like so. Volume profile shows a lack of recent trading activity at these levels, which can exaggerate volatility once price enters this area.
Given how clean and one-sided the climb has been, a pullback is not only likely, but it would be healthy. The projected reaction toward the 0.85800 area makes sense technically: it corresponds with key Fibonacci retracement levels (between 0.5 and 0.618), adding confluence to the idea of a corrective move before any continuation or reversal.
Until there’s a clear break above the upper bound of this zone with sustained volume, this remains a high-probability area for short-term rejection or distribution.
If price starts printing long upper wicks, slowing momentum, or bearish engulfing patterns on lower timeframes, that could offer early signals of weakness and a shift in momentum.
Just sharing my thoughts on support and resistance, this isn’t financial advice . Always confirm your setups and manage your risk properly.
Disclosure: I am part of Trade Nation's Influencer program and receive a monthly fee for using their TradingView charts in my analysis.

EURGBP Perfect Channel Up giving one more buy opportunity.Last time we looked at the EURGBP pair (May 30, see chart below) we gave the most timely buy signal right at the bottom (Higher Lows trend-line) of the Bullish Megaphone, and the price is only a few candles away from the 0.87400 Target:
If we look at the price action from a 4H perspective we can see that it is a Channel Up that has been driving the pair upwards since the May 28 bottom and today's rebound is taking place after a direct hit on the 4H MA50 (blue trend-line).
This is the start of the new Bullish Leg. Since the previous two have increased by +1.90%, this rally has the potential to even exceed our 0.87400 Target marginally. Still, this is a perfect bullish set-up.
-------------------------------------------------------------------------------
** Please LIKE 👍, FOLLOW ✅, SHARE 🙌 and COMMENT ✍ if you enjoy this idea! Also share your ideas and charts in the comments section below! This is best way to keep it relevant, support us, keep the content here free and allow the idea to reach as many people as possible. **
-------------------------------------------------------------------------------
Disclosure: I am part of Trade Nation's Influencer program and receive a monthly fee for using their TradingView charts in my analysis.
💸💸💸💸💸💸
👇 👇 👇 👇 👇 👇

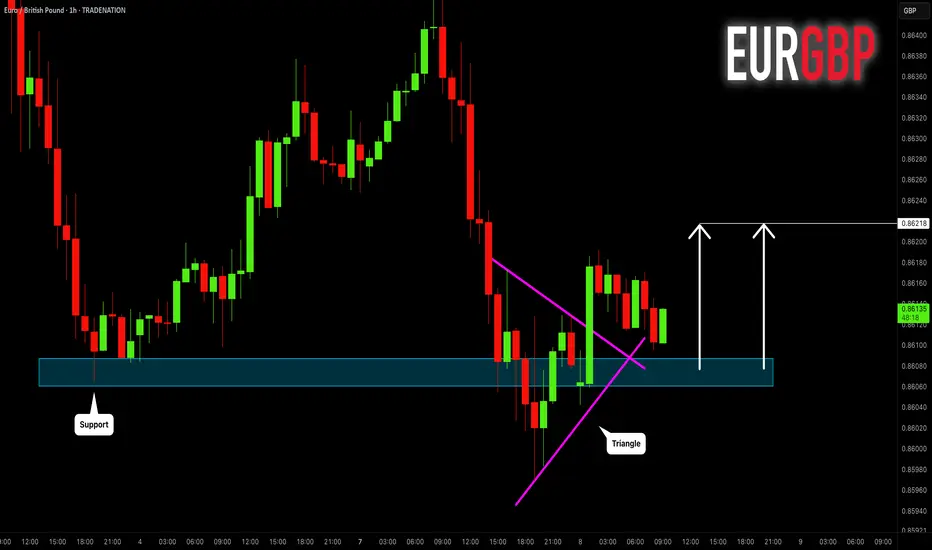
EURGBP: Bullish Move After False Breakout 🇪🇺🇬🇧
EURGBP will likely go up from a key daily/intraday support,
following a bullish breakout of a resistance line
of a bullish triangle on an hourly time frame.
The price may go up to 0.86218 level then.
❤️Please, support my work with like, thank you!❤️
I am part of Trade Nation's Influencer program and receive a monthly fee for using their TradingView charts in my analysis.
EURGBP Uptrend continuation breakout?The EURGBP remains in a bullish trend, with recent price action showing signs of a corrective pullback within the broader uptrend.
Support Zone: 0.8600 – a key level from previous consolidation. Price is currently testing or approaching this level.
A bullish rebound from 0.8600 would confirm ongoing upside momentum, with potential targets at:
0.8670 – initial resistance
0.8700 – psychological and structural level
0.8720 – extended resistance on the longer-term chart
Bearish Scenario:
A confirmed break and daily close below 0.8600 would weaken the bullish outlook and suggest deeper downside risk toward:
0.8590 – minor support
0.8570 – stronger support and potential demand zone
Outlook:
Bullish bias remains intact while the EURGBP holds above 0.8600. A sustained break below this level could shift momentum to the downside in the short term.
This communication is for informational purposes only and should not be viewed as any form of recommendation as to a particular course of action or as investment advice. It is not intended as an offer or solicitation for the purchase or sale of any financial instrument or as an official confirmation of any transaction. Opinions, estimates and assumptions expressed herein are made as of the date of this communication and are subject to change without notice. This communication has been prepared based upon information, including market prices, data and other information, believed to be reliable; however, Trade Nation does not warrant its completeness or accuracy. All market prices and market data contained in or attached to this communication are indicative and subject to change without notice.

EURGBP SHORT DAILY FORECAST Q3 D8 W28 Y25EURGBP SHORT DAILY FORECAST Q3 D8 W28 Y25
Professional Risk Managers👋
Welcome back to another FRGNT chart update📈
Diving into some Forex setups using predominantly higher time frame order blocks alongside confirmation breaks of structure.
Let’s see what price action is telling us today! 👀
💡Here are some trade confluences📝
✅Daily Order block identified
✅4H Order Block identified
✅1H Order Block identified
🔑 Remember, to participate in trading comes always with a degree of risk, therefore as professional risk managers it remains vital that we stick to our risk management plan as well as our trading strategies.
📈The rest, we leave to the balance of probabilities.
💡Fail to plan. Plan to fail.
🏆It has always been that simple.
❤️Good luck with your trading journey, I shall see you at the very top.
🎯Trade consistent, FRGNT X

Market Analysis: EUR/GBP Accelerates HigherMarket Analysis: EUR/GBP Accelerates Higher
EUR/GBP is rising and might climb above the 0.8670 resistance.
Important Takeaways for EUR/GBP Analysis Today
- EUR/GBP is gaining pace and trading above the 0.8600 zone.
- There was a break above a contracting triangle with resistance at 0.8630 on the hourly chart at FXOpen.
EUR/GBP Technical Analysis
On the hourly chart of EUR/GBP at FXOpen, the pair started a decent increase from the 0.8500 zone. The Euro traded above the 0.8580 resistance level to enter a positive zone against the British Pound.
The pair settled above the 50-hour simple moving average and 0.8620. It traded as high as 0.8670 before a downside correction. There was a move below the 23.6% Fib retracement level of the upward move from the 0.8507 swing low to the 0.8670 high.
However, the pair is stable above the 0.8600 support zone. The next major support is near the 50% Fib retracement level of the upward move from the 0.8507 swing low to the 0.8670 high at 0.8590.
A downside break below 0.8590 might call for more downsides. In the stated case, the pair could drop toward the 0.8545 support level. Any more losses might call for an extended drop toward the 0.8505 pivot zone.
The EUR/GBP chart suggests that the pair is facing resistance near the 0.8635 zone. A close above the 0.8635 level might accelerate gains. In the stated case, the bulls may perhaps aim for a test of 0.8670. Any more gains might send the pair toward the 0.8700 level.
This article represents the opinion of the Companies operating under the FXOpen brand only. It is not to be construed as an offer, solicitation, or recommendation with respect to products and services provided by the Companies operating under the FXOpen brand, nor is it to be considered financial advice.

EURGBP Bullish Flag Pattern!
HI,Traders !
EURGBP is trading in an
Uptrend and made a bullish
Breakout out of bullish flag
Pattern so we are
Bullish biased and we
Will be expecting a
Further bullish move up !
Comment and subscribe to help us grow !


Long EURGBPEntry: Break out
Stop Loss: Above swing low
Take Profit: previous high 0.87386 or floating
Set up: Break out, Major support and price above Ma

EURGBP SHORT DAILY FORECAST Q3 D10 W28 Y25EURGBP SHORT DAILY FORECAST Q3 D10 W28 Y25
Professional Risk Managers👋
Welcome back to another FRGNT chart update📈
Diving into some Forex setups using predominantly higher time frame order blocks alongside confirmation breaks of structure.
Let’s see what price action is telling us today! 👀
💡Here are some trade confluences📝
✅Daily Order block identified
✅4H Order Block identified
✅1H Order Block identified
🔑 Remember, to participate in trading comes always with a degree of risk, therefore as professional risk managers it remains vital that we stick to our risk management plan as well as our trading strategies.
📈The rest, we leave to the balance of probabilities.
💡Fail to plan. Plan to fail.
🏆It has always been that simple.
❤️Good luck with your trading journey, I shall see you at the very top.
🎯Trade consistent, FRGNT X

EURGBP SHORT – WEEKLY FORECAST Q3 | W29 | Y25💼 EURGBP SHORT – WEEKLY FORECAST
Q3 | W29 | Y25
📊 MARKET STRUCTURE SNAPSHOT
EURGBP is currently reacting from a key higher time frame supply zone, with price action showing weakness at premium levels. Momentum has slowed, and early signs of distribution are appearing. With structure aligning bearishly across multiple timeframes, the pair presents a short bias opportunity.
🔍 Confluences to Watch 📝
✅ Daily Order Block (OB)
Price reacted from a high-probability bearish OB.
Rejection wicks and a shift in candle body control point to supply dominance.
Momentum is fading, confirming the presence of smart money sellers.
✅ 4H Order Block
Clear mitigation of 4H OB followed by an internal break of structure (iBoS).
Price is respecting the OB zone, printing lower highs beneath key supply.
Perfect mid-timeframe confirmation of trend transition.
✅ 1H Order Block
1H structure shifted bearish, validating LTF trend alignment.
Price building supply chain with continued lower highs and bearish engulfing patterns.
Ideal zone for entry on pullback or liquidity sweep.
📈 Risk Management Protocols
🔑 Core Principles:
💰 Max 1% risk per trade
📍 Only execute at pre-identified zones
⏰ Set alerts — avoid impulsive trades
📉 Respect RR — minimum 1:2 per position
🧠 You're not paid for frequency. You're paid for discipline and execution quality.
🧠 Weekly FRGNT Insight
“Trade what the market gives, not what your ego wants.”
Stay mechanical, stay focused, and allow the probabilities to play out. Your job is to control risk — not the outcome.
🏁 Final Thoughts from FRGNT
📌 The structure is clear.
📌 The confluences are stacked.
📌 The bias is confirmed.
Let your execution reflect your discipline, not your emotions.
❤️ Good luck this week, and as always – I’ll see you at the very top.

EURGBP SHORT DAILY FORECAST Q3 D11 W28 Y25EURGBP SHORT DAILY FORECAST Q3 D11 W28 Y25
It’s Fun Coupon Friday! 💸🔥
Professional Risk Managers👋
Welcome back to another FRGNT chart update📈
Diving into some Forex setups using predominantly higher time frame order blocks alongside confirmation breaks of structure.
Let’s see what price action is telling us today! 👀
💡Here are some trade confluences📝
✅Daily Order block identified
✅4H Order Block identified
✅1H Order Block identified
🔑 Remember, to participate in trading comes always with a degree of risk, therefore as professional risk managers it remains vital that we stick to our risk management plan as well as our trading strategies.
📈The rest, we leave to the balance of probabilities.
💡Fail to plan. Plan to fail.
🏆It has always been that simple.
❤️Good luck with your trading journey, I shall see you at the very top.
🎯Trade consistent, FRGNT X

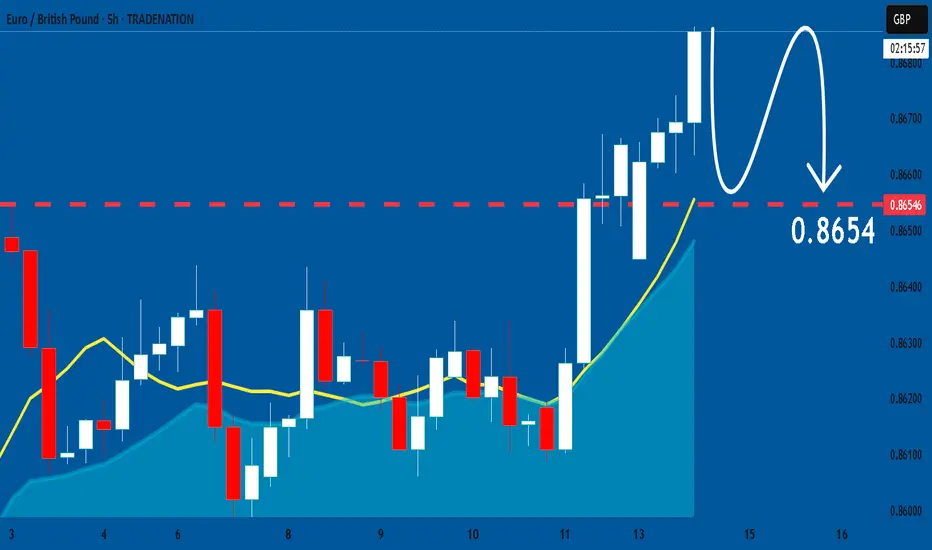
EURGBP: Bears Will Push Lower
Remember that we can not, and should not impose our will on the market but rather listen to its whims and make profit by following it. And thus shall be done today on the EURGBP pair which is likely to be pushed down by the bears so we will sell!
Disclosure: I am part of Trade Nation's Influencer program and receive a monthly fee for using their TradingView charts in my analysis.
❤️ Please, support our work with like & comment! ❤️
EURGBP Short Trade Risking 1% to make 1.3%OANDA:EURGBP Short swing trade, with my back testing of this strategy, it hits multiple possible take profits, manage your position accordingly.
Risking 1% to make 1.35%
Don't overload your risk like greedy, be disciplined trader, this is good trade.
Use proper risk management
Looks like good trade.
Lets monitor.
Use proper risk management.
Disclaimer: only idea, not advice

