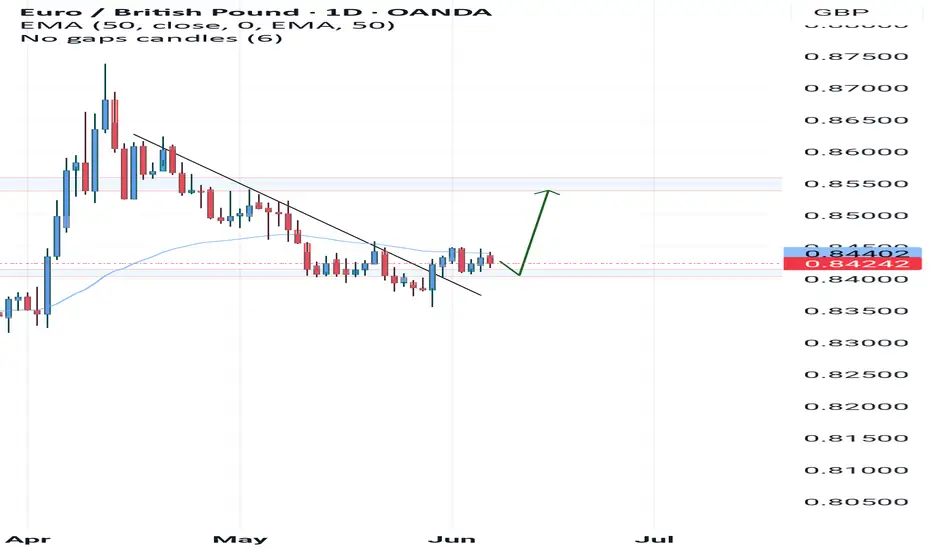
Possibility of uptrend The price is expected to consolidate above the current resistance level and then continue its upward trend. Otherwise, a correction to the indicated support level is possible.
EUXGBP trade ideas

EUR/GBP Bullish Setup – 4H Breakout & Key Level WatchFollowing up on my previous analysis, EUR/GBP has broken out on the 4H timeframe, signaling potential bullish continuation. I’m now watching for a pullback and a 4H candle close above 0.84583 for confirmation before considering a long entry.
📌 Key Level: 0.84583
🕒 Timeframe: 4H
📈 Bias: Bullish (pending confirmation)
📉 Strategy: Breakout → Pullback → Confirmation Entry
Waiting for price action to show commitment above the level before entering. Always manage risk and wait for clear confirmation.
💬 Let me know your thoughts below or share your own analysis!


eurgbp-h1-longBreak of Trend Line: The price has broken below a descending trend line, indicating a potential shift in momentum.
Retest: After the break, the price appears to be retesting the trend line from below, which often acts as a confirmation of the breakout.
Ichimoku Cloud: The price is interacting with the Ichimoku Cloud. A move above the cloud could signal a bullish trend, especially if accompanied by a Tenkan-sen (conversion line) crossing above the Kijun-sen (base line).
Support Zone: The price is near a highlighted support zone (green area), which could act as a springboard for a buy if it holds.
Potential Entry: A buy position could be considered if the price breaks above the trend line during the retest, confirms with a close above the Ichimoku Cloud, and shows bullish momentum with candlestick patterns like a strong bullish candle.

EURGBP: Bearish Continuation & Short Signal
EURGBP
- Classic bearish formation
- Our team expects fall
SUGGESTED TRADE:
Swing Trade
Sell EURGBP
Entry Level - 0.8455
Sl - 0.8471
Tp - 0.8425
Our Risk - 1%
Start protection of your profits from lower levels
Disclosure: I am part of Trade Nation's Influencer program and receive a monthly fee for using their TradingView charts in my analysis.
❤️ Please, support our work with like & comment! ❤️

IDEA EURGBPThis entry might play out in the EURGBP. I'm sharing two ideas: one for those of you who are trading tonight, and another one that I personally like more, although I don't rule out either of them. I'm sharing them now because I'm heading to rest.

Eurgbp I didn't get my entry on this trade so I didn't enter de trade but as we see price is going to de uptrend as predicted

EUR/GBP Potential Bullish SetupHi Traders.
We see a clear breakout from a falling wedge pattern and now we are forming a bigger inverse
HnS Pattern. Wait for the right shoulder to complete to confirm this setup.

EURGBP possible long for 0.8675 even highereurgbp weekly chart formed double bottom. eurgbp retraced back to 0.8356 and hold the previous HL (higher low)0.8317, weekly key reversal bar formed , made a new low closed on the high. indication for long for coming days and weeks. stop loss below 0.8317, target 0.8675.

EURGBP Potentially BullishHi there,
EURGBP appears bullish on the M30 timeframe but remains within a broad bearish range. The 0.84124 low seems to reinforce the 0.84077 support zone within this bearish context.
Price targets are set at 0.84344 and 0.84468, with a bias toward 0.84566.
Happy Trading,
K.
Not trading advice.

possibility of uptrendIt is expected that a trend change will form within the current support range and we will witness the start of an upward trend. A break and consolidation above the resistance range will be confirmation of the upward trend.

EURGBP forex rallying as expected off weekly demand levelWeekly uptrend. Weekly demand imbalance at 0.83 is still in control and trying to play out as expected. Any swing long positions should be managed. I hope you could take advantage of long positions using the smaller timeframes for those intraday and short-term forex traders.

EURGBP Technical & Order Flow AnalysisOur analysis is based on a multi-timeframe top-down approach and fundamental analysis.
Based on our assessment, the price is expected to return to the monthly level.
DISCLAIMER: This analysis may change at any time without notice and is solely intended to assist traders in making independent investment decisions. Please note that this is a prediction, and I have no obligation to act on it, nor should you.
Please support our analysis with a boost or comment!

EURGBP Hits SupportEURGBP Hits Support
EUR/GBP declined steadily below the 0.8440 and 0.8430 support levels.
Important Takeaways for EUR/GBP Analysis Today
- EUR/GBP is trading in a bearish zone below the 0.8450 pivot level.
- There is a connecting bullish trend line forming with support at 0.8415 on the hourly chart at FXOpen.
EUR/GBP Technical Analysis
On the hourly chart of EUR/GBP at FXOpen, the pair started a fresh decline from well above 0.8460. The Euro traded below the 0.8440 and 0.8430 support levels against the British Pound.
The EUR/GBP chart suggests that the pair even declined below the 0.8420 level and tested 0.8415. It is now consolidating losses and trading below the 50-hour simple moving average. However, there is a connecting bullish trend line forming with support at 0.8415.
The pair is now facing resistance near the 50% Fib retracement level of the downward move from the 0.8442 swing high to the 0.8416 low at 0.8430.
The next major resistance could be 0.8440. The main resistance is near the 0.8450 zone. It coincides with the 1.236 Fib extension level of the downward move from the 0.8442 swing high to the 0.8416 low.
A close above the 0.8450 level might accelerate gains. In the stated case, the bulls may perhaps aim for a test of 0.8480. Any more gains might send the pair toward the 0.8500 level.
Immediate support sits near 0.8415. The next major support is near 0.8405. A downside break below the 0.8405 support might call for more downsides. In the stated case, the pair could drop toward the 0.8380 support level.
This article represents the opinion of the Companies operating under the FXOpen brand only. It is not to be construed as an offer, solicitation, or recommendation with respect to products and services provided by the Companies operating under the FXOpen brand, nor is it to be considered financial advice.


EurgbpEurgbp is on a uptrend so we are trading with de trend and not against the trend but we are expecting a retracment back to the zone then we buy
EUR/GBP...BUYPrice is currently creating a head & shoulders reversal pattern and according to the COT report the buyers are stepping in this week so we might see a trend change.

EUR/GBP - A symmetrical triangle breakout to the downside
On the 30 minute chart we observe a symmetrical triangle that broke out on the downside on high volume. The price objective for a triangle is the distance of the widest 2 points of the triangle, projected in the direction from the breakout point.
On the chart we can see that the price objective is about 34 pips. A trade is placed near the breakout point, projected around 34 pips downward. I placed this trade before the breakout occurred, with my reasoning being this symmetrical triangle will breakout in continuation of the current trend which is downward. I did not expect the breakout to occur on the upside.
The price objective hasn't be met yet, which gives me reason to stay in the current trade until it has, or until new technical patterns arise.

Price action Gbpeur broke structure to the upside came to collect some liquidity now targeting a low with some liquidity will see from there what the market does

possibility of uptrendIt is expected that a trend change will form within the current support line and we will see the start of an uptrend. If the price breaks through the support line, the downtrend will continue.

EURGBP Potential H&SI´m following a potential reversal for EURGBP as a Head and Shoulders pattern.
Neckline break at 0.845 would take us to the next strong resistance level at 0.853.
Bullish RSI divergence is supportive of this scenario.

EURGBPKey resistance levels on the chart:
– 0.8715
– 0.8800
Price is currently in a sideways range after a long downtrend, showing signs of stabilization above a previous support zone
Trading idea: watch how price reacts to 0.8620
A breakout and close above it signals a move toward 0.8715
Rejection could lead to a retest of the recent low near 0.8350

EURGBP Just a few minutes ago, the AUDUSD trade I shared closed in profit — now it's time to look at the next opportunity. One of those is a sell setup on the EURGBP pair.
🔍 Trade Details
✔️ Timeframe: 15-Minute
✔️ Risk-to-Reward Ratio: 1:2
✔️ Trade Direction: Sell
✔️ Entry Price: 0.84149
✔️ Take Profit: 0.84106
✔️ Stop Loss: 0.84170
🔔 Disclaimer: This is not financial advice. I’m simply sharing a trade I’ve taken based on my personal trading system, strictly for educational and illustrative purposes.
📌 Interested in a systematic, data-driven trading approach?
💡 Follow the page and turn on notifications to stay updated on future trade setups and advanced market insights.
