Fartcoin Tests Major Support Zone: Will a Reversal Emerge?Fartcoin has reached a critical support zone that may serve as the foundation for a potential reversal. Traders are closely watching this level for signs of a bottoming structure before confirming a trade.
Price action is now testing the $1.05 region—a key technical support level with multiple overlapping indicators. This zone is not just a psychological round number, but also aligns with the point of control (POC), the VWAP-based support-resistance (VWAPSR), the value area low, and the 0.618 Fibonacci retracement. This confluence makes it a prime candidate for a potential bullish reaction if buyers step in and form a structural base.
Key Technical Points:
- Support at $1.05: Aligns with the POC, VWAPSR, value area low, and 0.618 Fibonacci
- Reversal Watch: A bottoming structure needs to form on the daily timeframe for confirmation
- Key Level for Trade Setup: Current price region offers a technical point of interest, but confirmation is still required
The current zone at $1.05 has become a focal point for market participants due to its technical significance. It represents a major area of price memory and historical volume interaction, making it an ideal level to monitor for a shift in trend. However, while price has arrived at this zone, it has not yet shown clear signs of reversal or structural confirmation.
A reversal from this level would require the formation of a bottoming pattern—such as a double bottom, bullish divergence, or a higher low structure—on the daily timeframe. Without such a structure in place, any bounce should be treated with caution. The current environment presents potential, but a well-defined entry model needs to materialize before considering an actionable trade.
From a broader market structure perspective, the $1.05 region stands out as a potential inflection point. The fact that it aligns with so many technical metrics—POC, VWAPSR, value area low, and the 0.618 Fib—adds credibility to the level as a valid support zone. If a bullish setup forms and volume begins to build from here, the probability of a reversal increases, potentially initiating a new leg toward recent highs.
What to Expect in the Coming Price Action
Fartcoin is trading at a high-confluence support level where a reversal could begin forming. Traders should closely monitor for structural confirmation and volume influx to validate a long setup. Without a bottoming structure, further downside remains possible, but the current level offers an attractive technical area for a potential reversal to develop.
FARTCOINUSDT trade ideas
fart long entry soon as per analysisits not afinancial advice #dyor
evry thiong is mentioned on chart as u can see clearly
and this is strongly bullish until turn this below order block to breaker blok with heavy volume

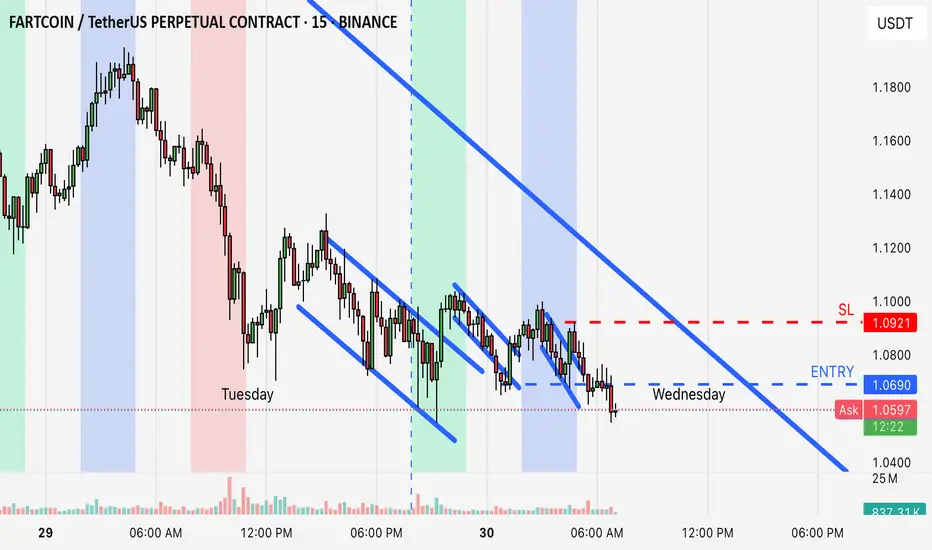
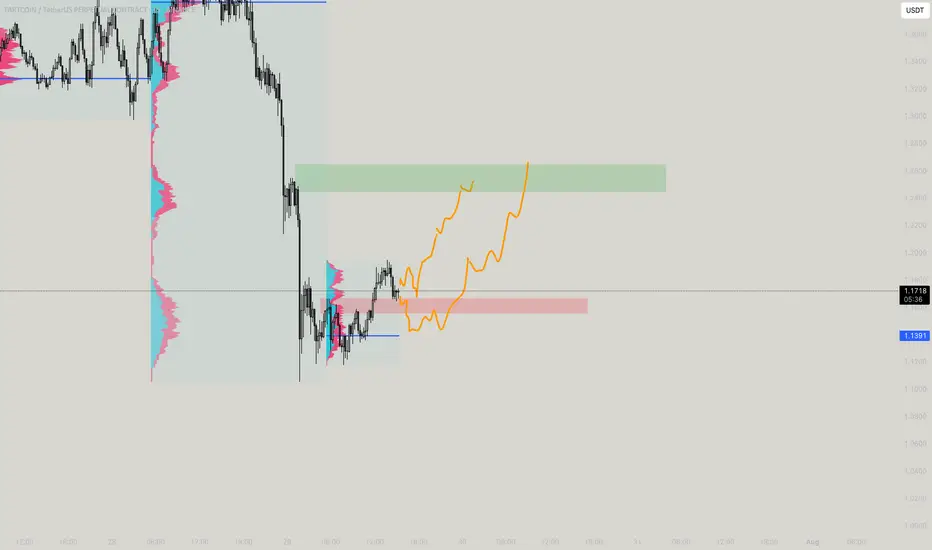
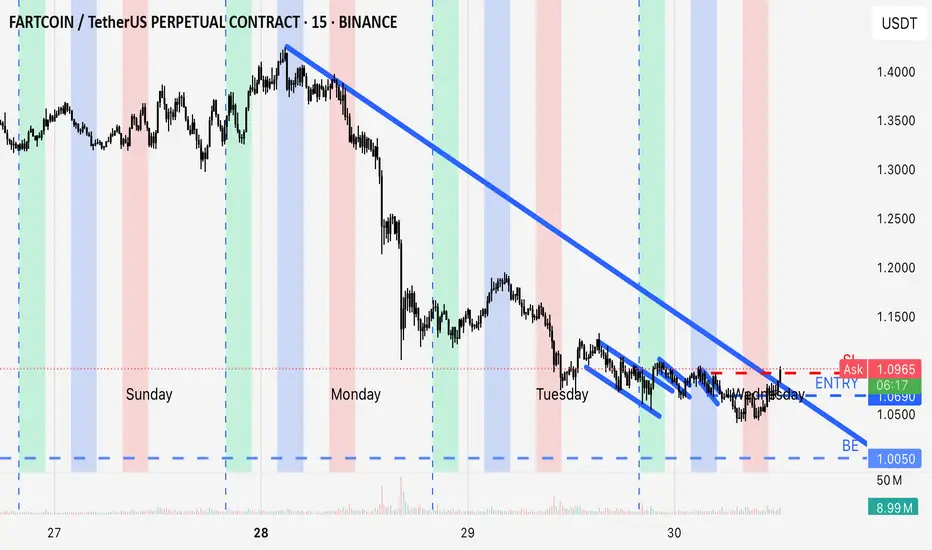
Parabolic channelMade a channel before Asia, before London and another one during London, finally following through 1 hour prior to newyork session . Trying to capture the second leg move of a powerful full breakdown
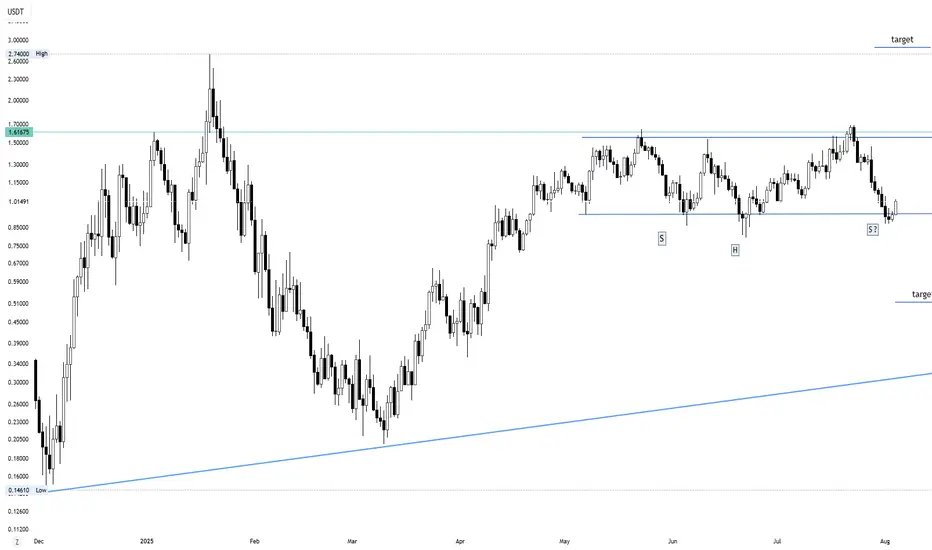
A possible inverse head and shoulder formingIn this daily chart, it clearly shows the formation of inverse head and shoulder. For it to be a valid inverse head and shoulder, the right shoulder should complete. The pattern is developing inside a rectangular pattern. A breakout will target New ATH. A pullback and close below the possible head which no longer makes it head, and shoulder increases sell pressure.
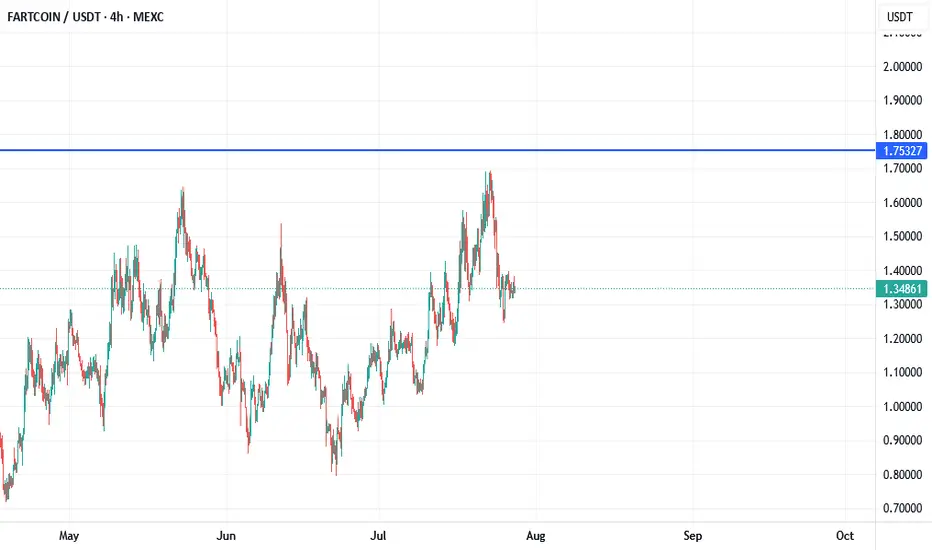
FartCoin $1.75 As soon as possibleHello,
FartCoin go to the $1.75 soon.
What is your opinion?
Thank you
Silent and Mega FartsSo silent farts will fall and go back and mega will directly blow the top off hahahaha
Fartcoin Hello Traders,
After major Pullback, Fartcoin gives a Chance to Enter for the Long Setup in illustrated Price Level.
Take Profit will be at Swing High of the Order block. You can also take partially TP in minor swing highs.
Disclaimer
This trading setup is provided for educational purposes only and does not constitute financial advice. Trading involves significant risk, and past performance is not indicative of future results. Users should conduct their own research and consult with a qualified financial advisor before making any investment decisions. xAI and its affiliates are not liable for any losses incurred from using this information.

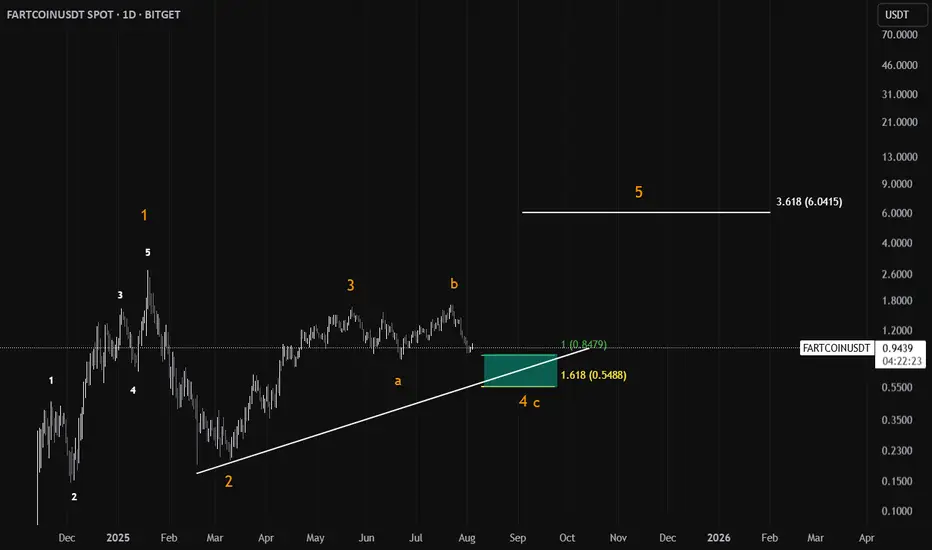
Fartcoin price analysis. Wave -(5)- coming soon ?)📢 Almost 3 months have passed since our last #Fartcoin post
During this time, the #FartcoinUSDT price has corrected itself well.
📈 What do you think about making another wave up - (5) - the final one?
Well, at least looking at our interpretation of the wave analysis on this chart, it turns out that there is a chance for this !)
🚀 Growth to $2 and $2.37
ℹ️ The main and unshakable condition is that the #Fartcoin price cannot fall below $0.87 for this analysis and forecast to be relevant!
________________
📚 Follow us ❤️ for daily crypto insights & updates!
🚀 Don’t miss out on important market moves

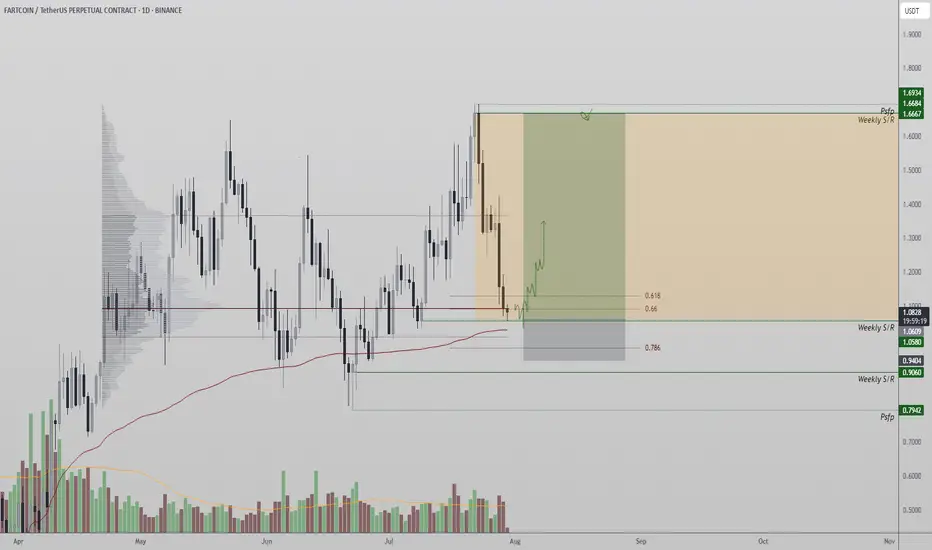
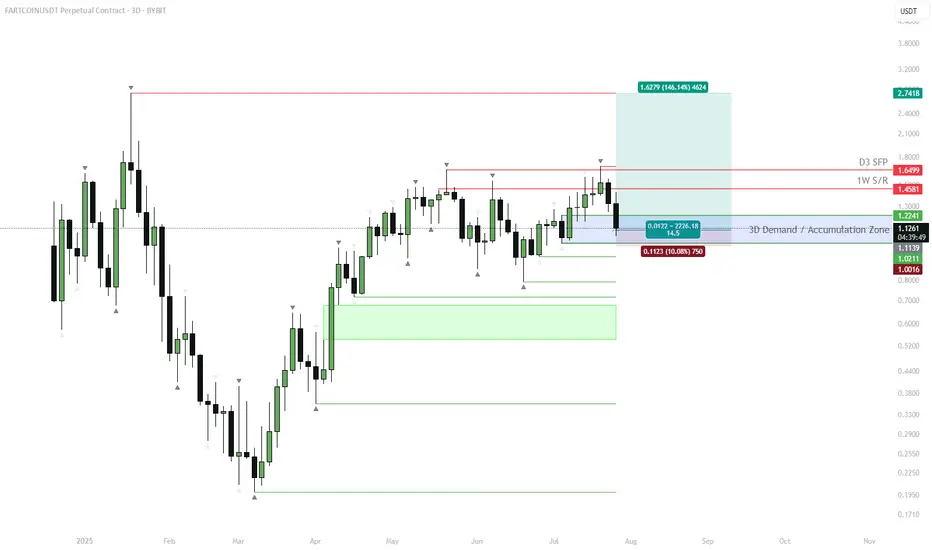
FARTCOIN | #3D — Swing Long from SupportFARTCOIN just tapped into a key 3D support zone after a sweep below prior range lows. The rejection from 1.65–1.45 weekly resistance has set up a fresh entry at demand, with risk well-defined.
Step-by-Step Price Scenario:
Support Confirmation: Price swept the range lows and rebounded from 1.12–1.22 demand. This area is now critical for bulls to hold.
Entry Logic: Accumulation within the blue box is favored for a swing long. Stop loss placed below $1.00 (invalidating the idea if broken).
First Objective: Look for price to reclaim 1.22, with a move toward the weekly S/R at 1.45 as first resistance.
Main Target: If momentum follows through, next key target is 1.65 (D3 SFP), with a possible extension to $2.74 (measured move).
Risk: Breakdown below $1.00 negates the idea and opens the door to much deeper downside (next demand block $0.60–0.80).
Why:
The setup offers a high R:R, with clear invalidation. Reclaiming 1.22 after a sweep typically triggers fast mean reversion, especially on volatile alts. Watch for signs of strength — strong candle closes above 1.22 or a quick retest.
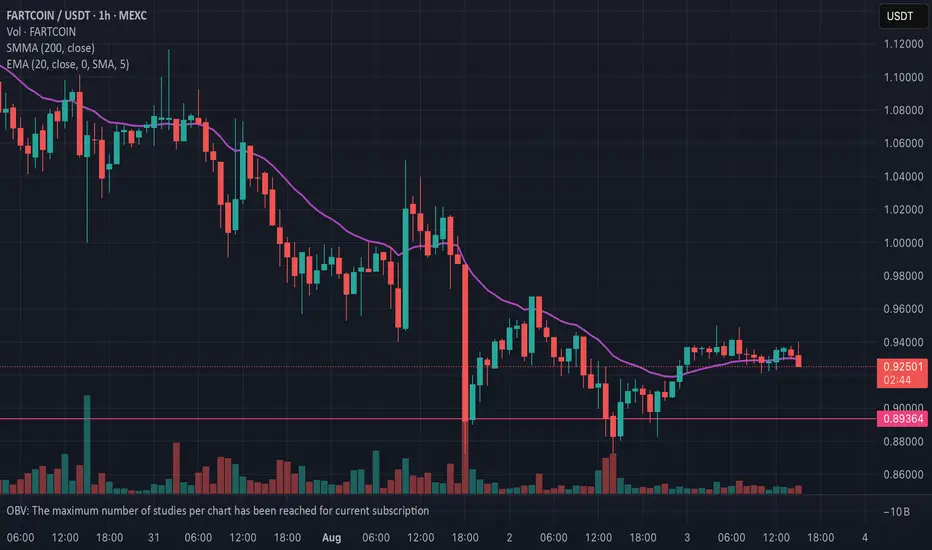
FART coin Short x10Short 10x
Entry $0.9297 on the 20EMA
Target $0.893 on the Trend line
Stop $0.937 above candle on the 20EMA
Add B/E when it hits $0.917
Risk 5/10

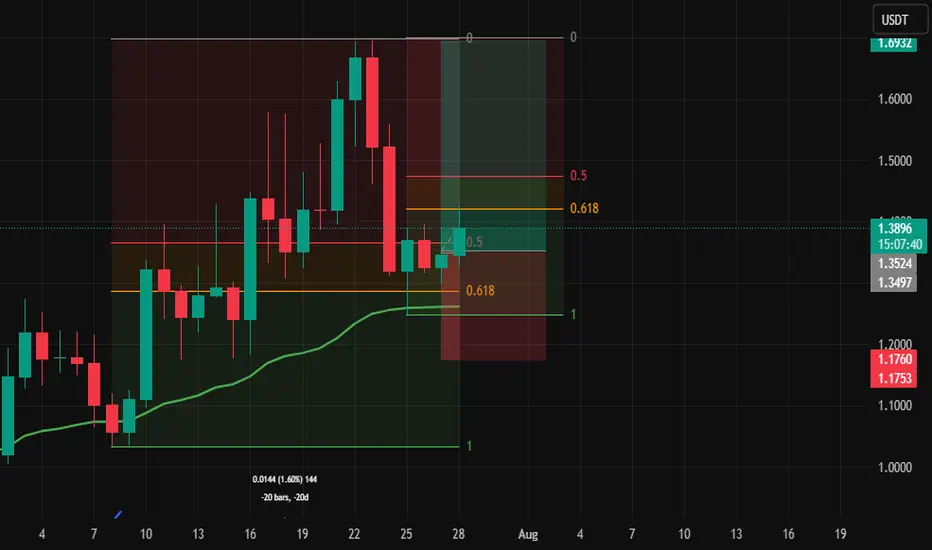
Ascending Channel Bounce – Long SetupAscending Channel Support Test – Potential Reversal Setup 📈
Price has just tested the lower boundary of the ascending channel and reacted strongly, signaling potential buying interest at this level.
RSI is hovering near the oversold zone, adding confluence to a possible bullish reversal scenario.
Trade Idea:
Entry: 0.89
Target 1: 1.178
Target 2: Previous swing high at 1.69
Stop-loss: Below the channel support breakout
A break and hold above 1.178 could pave the way for a continuation toward the previous high. Watching for volume and bullish candlestick confirmation before adding to the position.
#TechnicalAnalysis #AscendingChannel #RSI #CryptoTrading #ChartPatterns #PriceAction #TradingSetup #BullishScenario #SupportAndResistance #SwingTrade #CryptoSignals


Fart Ichimoku Breakout Test📈 Checking bullish signals on the chart
✅ Positive signs:
- The price is stable above the cloud and the candles show the strength of buyers.
- Indicators such as RSI and trading volume are in a good position.
- The cloud broke with the body
First profit limit 1/451
Second profit limit 1/551
Limit of loss 1/320

What’s Next? 🚨 $FARTCOIN Cup & Handle Pattern Forming – What’s Next? 📈
$FARTCOIN has formed a bullish Cup & Handle pattern — but is it over?
❌ Not yet. $FARTCOIN hasn’t shown any strong bearish signals for now.
🔍 We’re watching two key green line levels below.
📉 If the price drops toward these zones, we may see buyers step back in — creating a potential entry, but only with confirmation.
✅ Stay patient — no rush to jump in without a setup. Let the chart guide us.

day twodecending triangle into the low, suppotted by the 20ma.breaks the low and now going down. will breakeven then hold till next asian market open

FARTCOIN | Out of SteamFARTCOIN appears to be running out of steam after its impressive rally from the March lows. The chart shows a clear breakdown from the ascending trendline support that had been holding since early 2025.
Key Technical Signals:
Price has broken below the major ascending trendline
RSI shows declining momentum, failing to maintain bullish territory
Recent price action suggests exhaustion after the parabolic move
Bearish Setup:
A potential decline toward the green support zone around $0.40-$0.50. This represents the previous consolidation area that could act as strong support.
Risk Considerations:
Meme coins can be highly volatile and unpredictable
Any sudden narrative shift could invalidate the bearish thesis
Stop loss above the broken trendline would be prudent

3rd Trade on Fart - 10x with bigger Stop10x
Target $0.892
Confident it will hit the trend line target
Entry $0.932
SL $0.942 above the current high candle
Risk 4/10
2.0 Short FART x202nd Trade on Fart using same metrics
x20 - Very tight stop
Entry $0.9327 Breaking through 25EMA
Stop $0.937 above the next highest candle close
Target $0.89 which is trend line
Risk 6/10

fart/usdt buy side trade dyorthis is formation of wave structure and handle cup formation
but DYOR im not a financial advisor

Mistake learnedIf it doesn’t break inside the timing window then it is not worth trying, it will go sideways all day or reverse
FaRTCOIN 20%+ ??I got an entry on Fart. It traded below the last 20day DR and it could trade through external liquidity.
I wanna use this opportunity to grow a 1/4 of my spot with this week's price action.
$FARTCOIN/USDT – 4H(Not Financial Advice)
🔍 Key Technical Insights:
BOS (Break of Structure)
A clear BOS is marked near the 1.46 level, confirming a bearish market structure.
Price broke below the higher low, suggesting lower highs and lower lows in progress.
Supply Zone (Entry Region)
1.5189 – 1.5729 USDT is the defined supply zone where price is expected to react.
Current price is below this zone, indicating potential pullback entry for shorts.
Entry Strategy
Ideal short entry is upon rejection within supply, targeting previous demand zones.
Entry would be around 1.56 – 1.57 (red box top), stop just above 1.5729.
Targets
TP Zone (Demand): 1.3151
Mid-level TP: 1.4616 (prior support turned resistance)
Full TP: At the lower purple box between 1.21 – 1.31
Risk-to-Reward (RRR):
Visually, the trade setup shows an RRR > 2:1, making it favorable if rejection occurs.
🔧 Confluence & Bias
✅ BOS confirms trend shift
✅ Price rejected from premium zone
✅ Bearish candles confirming weakness
❌ No bullish market structure yet
❗ Watch for fakeouts in thin liquidity weekend
