FARTCOIN | Midrange Retest After Rejection from Range HighClassic midrange scenario: defend $0.97 for another leg up, or risk testing the lower demand.
FARTCOINUSDT trade ideas

FARTCOIN/USDT Short Setup – 1H Chart🧠 FARTCOIN/USDT Short Setup – 1H Chart
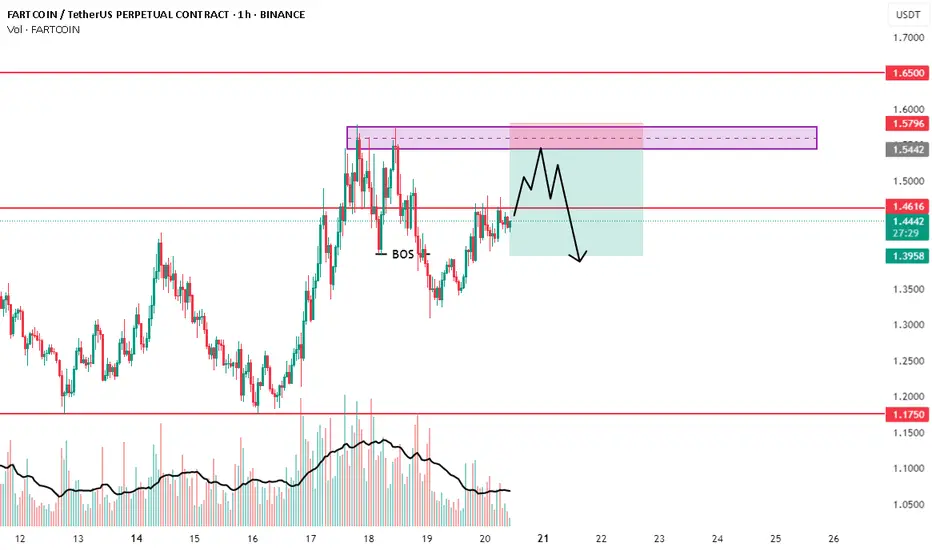
The market recently showed a Break of Structure (BOS) to the downside, confirming bearish pressure. Price has now retraced back into a major supply zone between 1.5442 – 1.5796, where multiple rejections have already formed — suggesting potential distribution.
You're looking to short around 1.4355, aiming for a drop back toward the 1.3958 demand level.
The stop-loss is placed above the supply zone at 1.5796, which, if breached, would invalidate the setup completely and flip bias to bullish. The take-profit sits at 1.3958, a clean target just above previous support.
🎯 Trade Details
Entry: ~1.4355
Stop-loss: 1.5796
Target: 1.3958
Risk/Reward: ~3.6R
❌ Invalidation :
This setup gets invalidated if price breaks and holds above 1.5796, showing strong bullish momentum and reclaiming the supply area. A 1H candle closing above that zone would be your exit signal.
✅ Conclusion
FARTCOIN/USDT is showing a clear bearish setup after a break of structure, with price reacting strongly from a key supply zone. A short position around 1.4355 targeting 1.3958 offers a solid 3.6R risk-to-reward. Invalidation is cleanly defined above 1.5796. As long as price stays below the supply, the bearish bias remains valid.
📉 Clean setup based on structure + supply
🧠 Trade at your own risk | NFA
📲 Follow @Ali15349323 for more setups
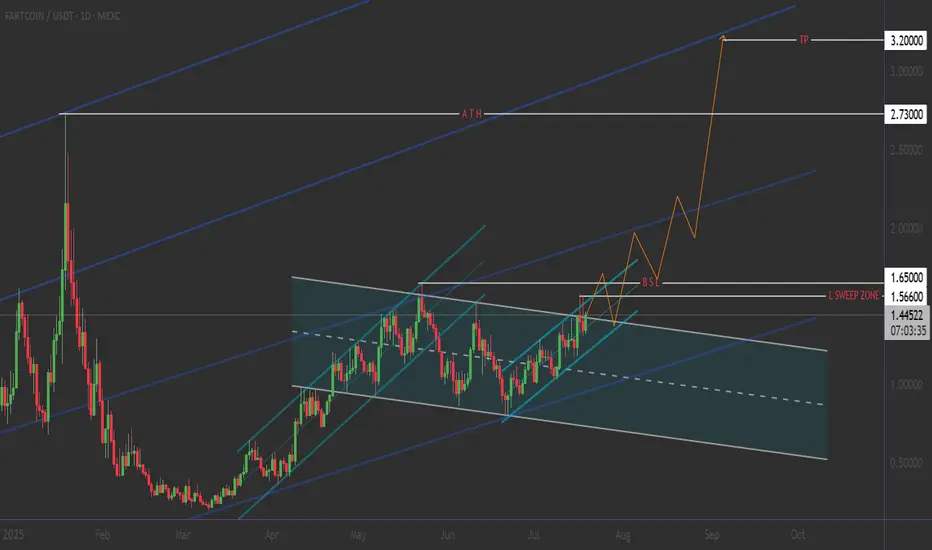
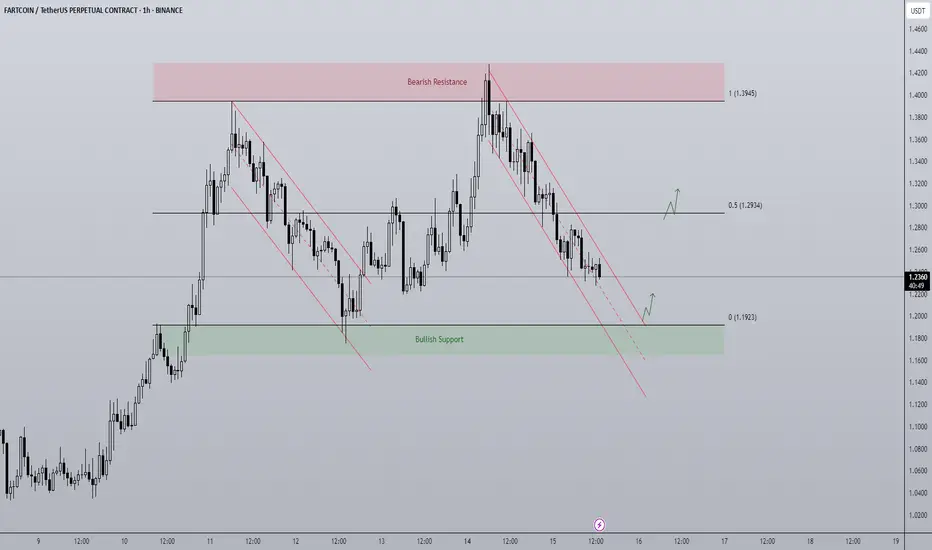
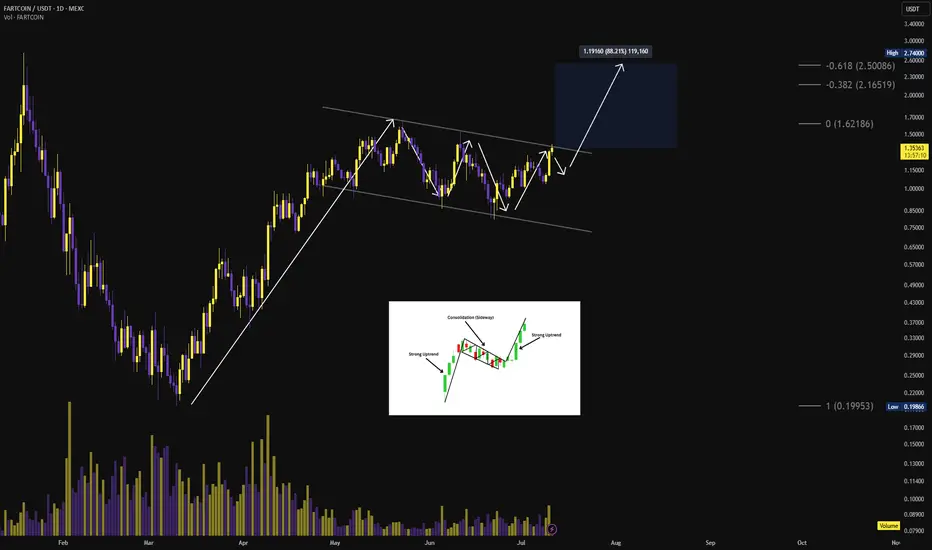
FANTCOIN: The Perfect Storm - Bullish Breakout Analysis💡 CREATIVE TRADING STRATEGY: "The Triangle Rocket :
4-month ascending triangle = BREAKOUT TIME!
___________________
🟢 BULLISH SCENARIO (High Probability)
ENTRY ZONES📈
🛡️ Conservative: $1.30-$1.35 (Pullback to support)
TARGETS:
🎯 Target 1: $1.85 (+28% from current)
🎯 Target 2: $2.30 (+60% from current) : L S S
🎯 Target 3: $2.73 (+88% from current) : ATH
🚀 Moon Shot: $3.20 (+120% from current) & EXIT ZONE ⏰
STOP LOSS:
❌ $1.15 (Below ascending support)
____________ NOTE __________
⚠️ RISK MANAGEMENT
⚠️ DYOR
Remember: No setup is guaranteed. Always manage risk and never invest more than you can afford to lose.
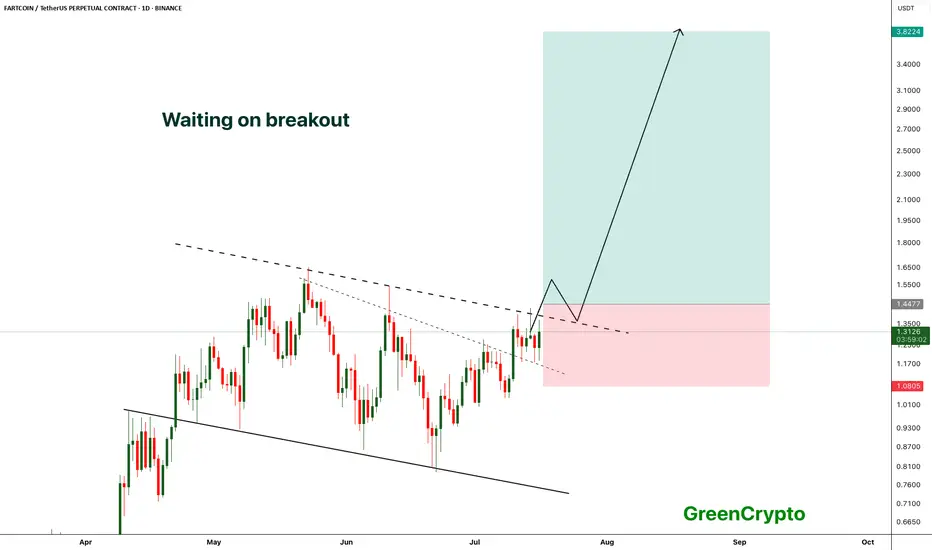
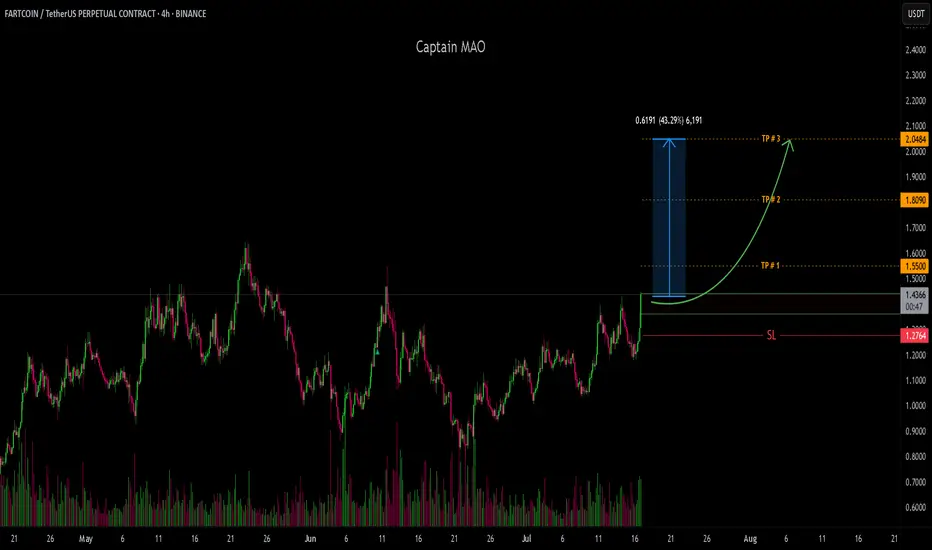
FARTCOIN - Breakout from the channel- FARTCOIN is waiting to breakout from the channel, a confirmed breakout would push the price to new all time high
- we have long trade opportunity once the price breaks above the resistance trendline
Entry Price: above 1.44
Stop Loss: Below 1.08
TP1: 1.6464
TP2: 1.8923
TP3: 2.2450
TP4: 2.9973
TP5: 3.8224
Max Leverage: 5x
Don't forget to keep stoploss
Cheers
GreenCrypto
Fart coin about to move.Very like it.
Consolidation was nice, time to move on and show some fart in the air ?
I like it.
FARTCOIN Holding the Trendline Like a ChampFARTCOIN is currently consolidating in a sideways range, forming a clean accumulation zone just above the rising trendline support. This kind of structure often builds energy for the next leg up.
As long as the price respects the rising trendline, the bulls remain in control. A breakout above the sideways zone could trigger a strong move toward the upper resistance levels.
Keep an eye on this one — it’s showing strength and gearing up for a potential breakout.

Farcoin #fartcoin As you see fartcoin is finishid the correction from 4hr arc shape and flag continuation pattern of 3 touch bottom and 2 touch top so it;s now preparing to shift upward
GOODBAY FARTCOIN-USDT ..💨 FARTCOINUSDT: The Gas That Could Ignite!
📊 Current Market Snapshot
- Price: $1.2446 (-2.85%)
- Volume: $351.81K (Medium liquidity)
- Key Levels:
- Support: $1.22
- Resistance: $1.28
- Psychological Level:** $1.30
🎯 Trading Strategy
- Long Setup:
- Entry: $0.67 - $0.72
- Targets: $1.2 → $1.35 → $1.60
- Stop Loss: $0.64
- QUICK TRADE
- Entry: $0.94
- Targets: $1.15 → $1.10
- Stop Loss: $0.90 - close 4h
⚠️ Risk Warning
1. Extreme volatility expected
2. Low liquidity can cause slippage
3. Monitor BTC dominance for market trends
📌 The Opportunity
FARTCOIN offers:
- High-risk, high-reward potential
- Perfect for quick scalps
- Clear technical levels
---
📊 | Not financial advice - DYOR

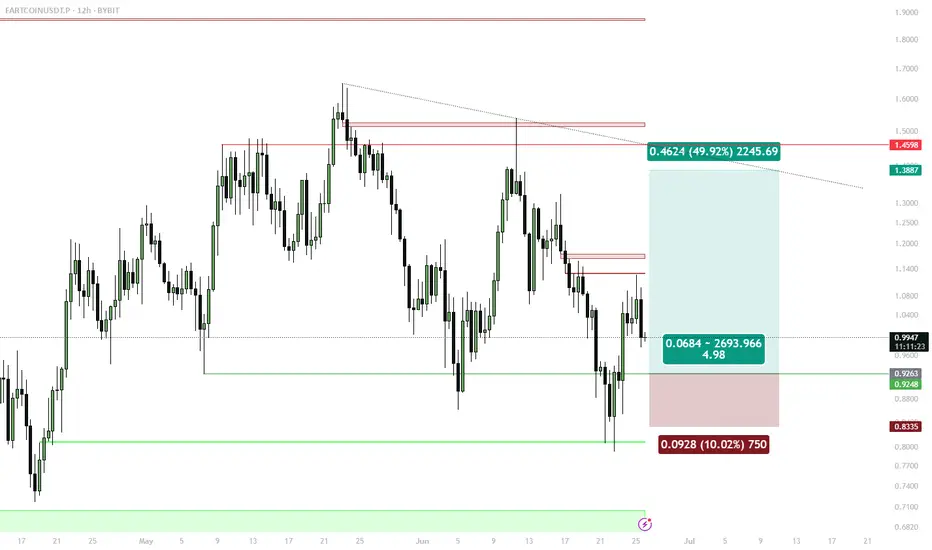
Fartcoin - Rangebound repeat? A BTC makes new highs attention has turned towards altcoins to play catch up.
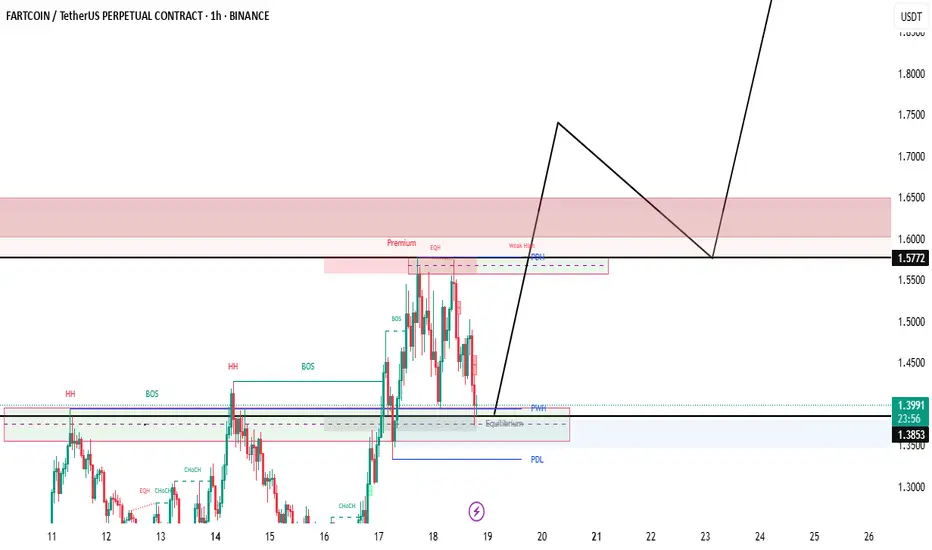
FARTCOIN has been a top performer of the last month and currently on the 1D timeframe finds itself in a rangebound environment capped between $1.1923 - $1.3945. The end of last week price trended down in a bearish channel from top to bottom and it looks to be doing the same currently. As the supply zone above the range high got swept, price printed a SFP getting back inside the range and began trending down, for me there are two actionable long entries here:
- A range low bounce + breakout of trend channel would be an ideal long entry. An area of clear support coupled with a breakout is a historically strong setup with a clear invalidation if price breaks below the range and gets accepted.
- A more aggressive but potentially less ideal setup would be a breakout of the downtrend before hitting range lows. Higher risk as the level of support is not as defined but in the more risk-on environment crypto is currently in, the chance of major support levels being front run does go up as buyers become more impatient when FOMO grows.
The midpoint is key level to look out for too as a reclaim would mean a run at the highs, rejection opens the door to retest the lows.
x10 FART SHORT @ $1.63 Taking a short on the spike into technical on $1.63
STOP is at $1.70
x10
Target $1.45
Risk factor 7/10
FART ~ Just fart once more?He is just holding is farts because he out of beans, but yes ive given him beans to consume and then yes, thats what you want!
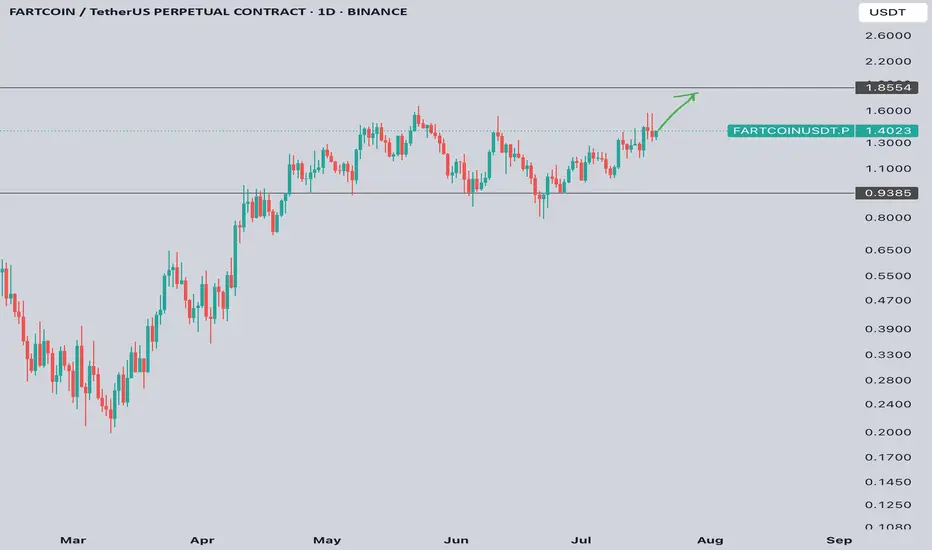
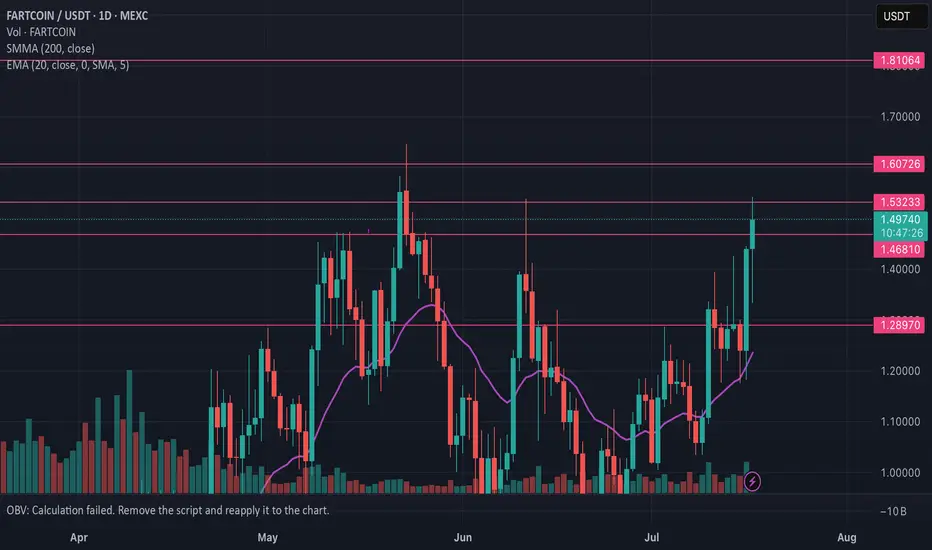
FARTCOIN/USDT >>2$FARTCOIN/USDT – One of the strongest-performing memecoins in the current cycle, showing resilience and consistent upside momentum. After consolidating steadily, price has now broken out from the current resistance zone, indicating bullish continuation. Momentum is building, supported by sustained volume and strong community backing.
FART Long Bounce off 200 - 10XEntry $1.2 bounce off 200
10X
Tight Stop Loss
STOP $1.185
Target 25% Sell @ $1.30

FARTCOIN Swing Long — Reclaimed Support, Bids at Bullish OBSwing Long Setup:
Entries: Limit orders in $0.91–$0.93 (12h OB zone, 1D support)
Stops: 4h close below $0.86–$0.87 (support invalidation)
Targets: $1.16 (first TP), $1.43 (secondary target)
🔔 Triggers & Confirmations:
Only stay in trade if 1D/12h support holds on 4h closes
Re-enter on reclaim if stopped out and structure recovers
🚨 Risk Warning:
Breakdown of reclaimed S/R flips setup invalid — exit on signal

Fartcoin long positionWaiting for retest on the weekly support for entry, Should get a nice bounce from this region.

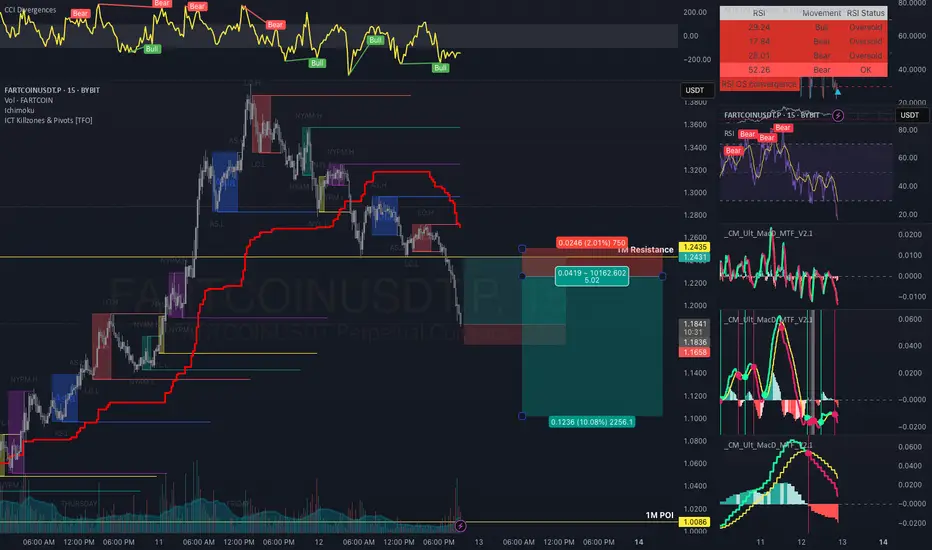
Fartcoin Short SetupWaiting for a bounce and rejection from around 1.22-1.25 before we continue to go down. as we have no reason to long this yet. RSI is not showing any bull divs just yet. but our CCI does. so it simply means that this is the 1st bounce or more of w4/wc corrections

$FART Bull flag can breakout here!🚨 SEED_WANDERIN_JIMZIP900:FART about to rip faces clean off with a bull flag breakout! ⚠️📈
Weeks of consolidation, fakeouts, and shakeouts… and now it’s knocking on the $1.40 breakout level🌪️
Break that line — and we’re heading straight for $2.00, with $2.50 in the crosshairs. 🎯
$FARTCOIN has the structure is textbook. Volume creeping. Momentum building.
#FART isn’t just a meme anymore… it’s a rocket with fuel to burn. 🚀
FARTS to SHARTSOkay so as I see this happening, What i have learnt, this is best way to catch all the buyers!

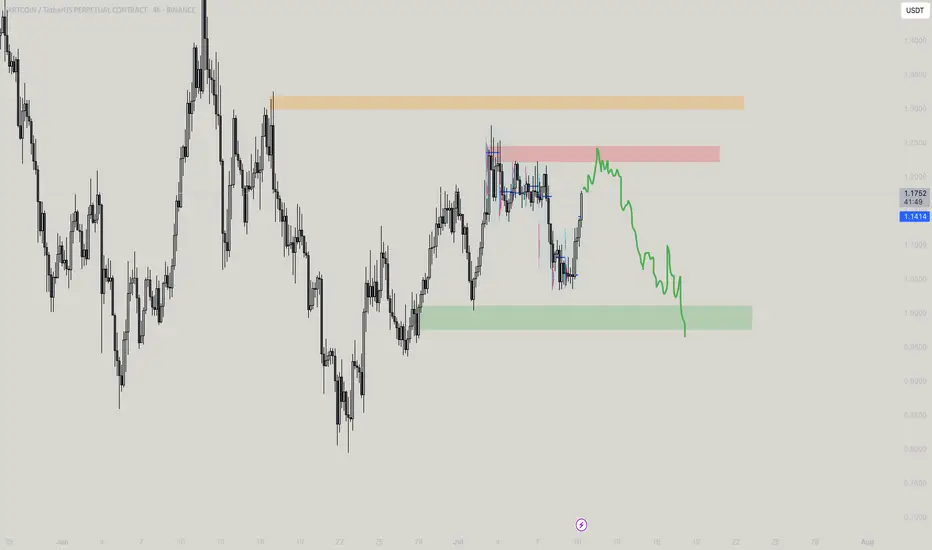
The MEGA FART SHOWYEs its a fartshow! Okay so got so many DM for ALT's, I am going to write something what I see, As per move, ETH looks strong till $3,200 and except for that all just moved without any heavy institutional moves means volume is just based on Future OI which isnt a perfect move, So i wont comment unless full OB forms, but seeing this - You get another huge short oppurtuunity- this fartcoin is having the range marked, it would be a positional short/ and a hold trade as stated if you create position in the red and if it briefly touches the orange box, dont exit! Its the plan you know now!
Fartcoin to the moon again !!!!Fartcoin: Eyeing a Rebound to $1.20 USDT 🤑
🚀🚀🚀
Technical indicators suggest Fartcoin (FARTCOIN/USDT) could be poised for a significant price recovery, potentially reaching $1.20 USDT. After a period of consolidation between $0.95 and $1.05 USDT, signs of accumulation are emerging.
Key Technical Signals:
•RSI Reversal: The Relative Strength Index (RSI) is showing a bullish reversal, moving up from oversold conditions, indicating waning selling pressure.
•MACD Crossover: A potential bullish crossover on the MACD (Moving Average Convergence Divergence) suggests growing upward momentum.
•Volume Profile: Accumulation within the current range, with buying interest absorbing selling, points to a potential price floor.
•Fibonacci Target: The $1.20 USDT level aligns with a significant Fibonacci retracement point, making it a plausible target if upward momentum continues.A confirmed breakout from the current consolidation, supported by increased buying volume, would strengthen the case for a rally towards the $1.20 USDT mark !!!

FARTCOIN — Choppy Zone, Support Buy Setup1. Choppy price action likely until sale is done
2. Buy on retest and bounce from 1D support ($0.90)
3. Only long above support, stop below $0.90
