Freshly goldencrossed Fetch heading towards inverse h&s targetGoldencross just occurred and so far fetch is responding with a green candle. It has been slowly climbing up its inverse head and shoulder measured move line but we could see it do something similar here to how Render reacted recently. I expect price to hit both of these targets in the near future *Not financial advice*
FETUSD trade ideas

lets play fetch Catch? Fetch? This is an Ai play but most importantly the chart looks delicious. FETUSD is above the 100/200 sma on the daily a weekly. IT is also above the daily 20/50/10 ema AND weekly Ema's. Looks bullish to me

Fetch.AI - Bullish breakout incoming?FET seems to be on the verge of a breakout that would start the next run up with a minimum price target of $17.50, looking at the 1:1 extension of the 2020-2021 bull run. Price has been breaking above weekly descending trend lines and further confirmation would be received with candle closes above the last swing high (~$16) and the 0.618 fib level (~$2)

FETUSDT LONGThis is my take for FETUSDT
The chart says it all , this is the second largest AI coin.
Huge upside potential

Will Artificial Superintelligence Alliance retest its lows?ASI(FETUSD) has recently retested the resistance area around the 1.70-1.80 area and may have gotten rejected. However, with BTCUSD at near ATHs again its possible the crypto market will experience a pullback where BTCUSD retests its prior resistance as support in the 70-75k area. With SPY and QQQ also at major yearly resistance levels which could indicate a short term pullback in the stock market and with lower highs on ASI's RSI, I think it makes sense to prepare for the possibility of FETUSD retesting its prior lows around the $0.80 area. If this occurs, this would be a good area to go long with the caveat that there are reasons to believe that the markets are close to topping as a whole.
I do think we will get a recession next year for a multitude of macro reasons. One of the first obvious signs would be once unemployment in the US starts sustainably going up which could happen as soon as December and January. If this plays out, I think crypto as a whole will get a nasty crash and altcoins like this one will see severe drawdowns potentially back to prices seen in 2023.


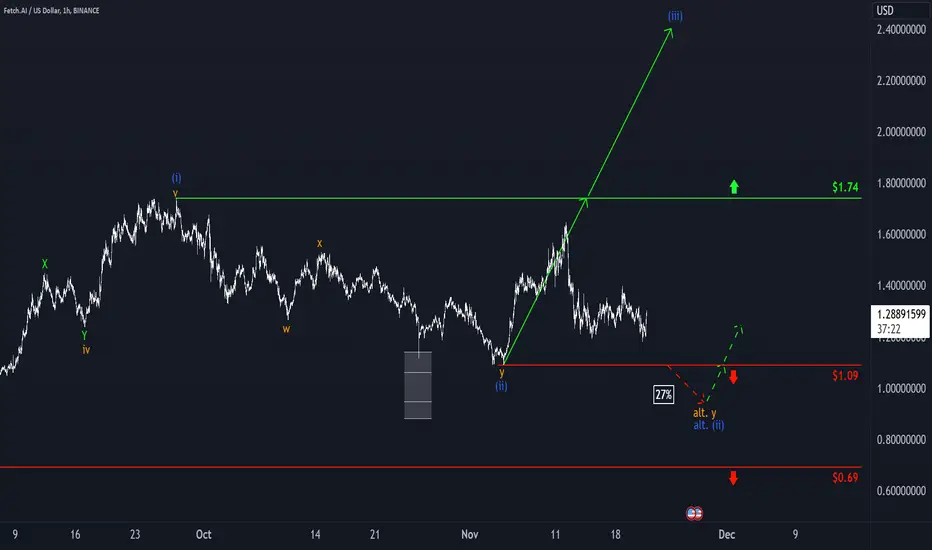
Fetch: Recovery!FET has shown some recovery in recent days. We have now refined the blue wave (iii), breaking it down into a more detailed substructure based on the current price action. This structure suggest that the altcoin has completed the low of the orange wave ii and is working on the initial stages of the corresponding orange wave iii. During this movement, we expect a breach of the resistance at $1.74. The upward momentum should only pause significantly further north, where a wave-iv correction is anticipated. After establishing the low of this correction, the final leg of the blue wave (iii) should resume its ascent. That said, we must keep in mind our alternative scenario (27% likely). This scenario calls for a lower low of the blue wave alt.(ii).

FET is very Wyckoffy right now!TLDR — FET is cleared for takeoff.
FET on the 15 minute view has just printed a near perfect Wyckoff Cycle with phases A though D... and is now in phase E before the next leg up.
FET did not pump on with the Trump effect. But now it looks like it's ready to move into the next leg of the cycle.
So I am bullish on FET at the moment. I believe It will reac over the $2.00 range soon.

FETUSD - updateA nice inverted H&S pattern. Look for the confirmation - the neckline should be broken on increasing volumes. Looks really juicy.
The minimum target IMO is the ATH. Just in case, can verify the potential upside as the x2 size of the pattern.
Trade safe

FET to $5Gaining exposure to AI as rotation should come.
Buying in at $1.32 with circa $5 target, subject to Elliott count. Breaking above $1.8 on increased volume will serve as confirmation.

FETUSD Buy it while it is still cheap.Artificial Superintelligence Alliance (FETUSD), commonly known as Fetch.ai, has been trading within a 4.5-year Channel Up since the March 2020 market bottom and following the 2022 Inflation Crisis that bottomed on the week of November 21 2022, it has entered a new Channel Up.
That is technically the new Bullish Leg of the 4.5 year Channel Up, which is the new Bull Cycle. Naturally, it shares many common characteristics with the previous Bullish Leg/ Cycle. The symmetry between its Legs (blue Arcs) is strong and so is their tendency to reach the 0.5 Fibonacci retracement level upon pull-backs and then rebound.
It appears that right now we are at the final stage of the Channel Up, where after finding Support on the 0.5 Fib and more importantly holding the 1W MA100 (green trend-line) on the August 05 Low, it is aiming for the last rebound.
Based on the % rise of the previous Bullish Legs, this should be on a +1050% minimum, so our Target is $8.000.
It is interesting also to notice the MACD squeeze, after the last 2 Bullish Crosses, which is a clear bottom sign.
-------------------------------------------------------------------------------
** Please LIKE 👍, FOLLOW ✅, SHARE 🙌 and COMMENT ✍ if you enjoy this idea! Also share your ideas and charts in the comments section below! This is best way to keep it relevant, support us, keep the content here free and allow the idea to reach as many people as possible. **
-------------------------------------------------------------------------------
💸💸💸💸💸💸
👇 👇 👇 👇 👇 👇

Why FET/USD looks like ETH/BTC ??noticed this this morning maybe there is a very simple explication, feel free to share it,
I'm not a pro charter so I'll not be able to put the pic of ETH/BTC directly on the chart but here is it
timeframes are different but there remains proportionals
it's a pattern that consists in :
- a vertical move (early 2024 for FET, early 2016 for ETH)
- a distribution that bring us to a higher low from before that vertical move (Low for FET was 6 august 2024, for ETH/BTC early September 2019)
- a move up that create a inverse H&S, that distribution is the left leg
- another distribution from that previous move that finished this month for both pairs, yesterday was THE low for ETH/BTC if my whole idea is working, it was a local low for FET/USD but this one touched the channel where FET is evolving + it's a 0.5 fib retracement from previous move up
TP 15???¿

Fetch: Bearish PressureFET experienced significant bearish momentum over the past seven days. We interpret this movement primarily as part of the substructure of blue wave (iii). Consequently, we expect the coin to recover and climb above the resistance level at $1.74. However, if it falls below the support level at $1.09 (27% probability), we will have to anticipate a deeper low of blue wave alt.(ii).
$FET - I Wish It Were Not So...NYSE:FET forming a bear flag...if it plays out, it'll drop to test the $1.00 range.
Hey Fetch.AI, time to focus on rewarding your bag holders vs. crushing token-omics with more mergers.

FET to $2?FET will pump due to Chatgpt. Agix is also pumping.
Please do your DD not investment advice

Narrative Based Crypto Projects - Ai EditionI am purely looking for the best Ai projects based on the chart set-up. FET looks like it's at the bottom of this channel. Excellent entry at $1.30. PT above $10.00

FETUSD - buyRepeats the same pattern. Price is flagging slightly above the broken corrective trend line.
The best entries are usually the simplest. Don't invent the wheel - trend is your friend )

few understand how quickly this FET token is going to do 10x title says it all. few understand the strength and speed at which this is going to make a 10x move. likely far more than 10x towards the end of the current new bull cycle.
AI-related coins are garnering increasing attention from traders and investors. I personally like the team and project. something to look into if you haven't yet done so.
lots of strength in price action has been observed previously in this one. I see it ready to make a 10x move AT LEAST from current level during this renewed buy cycle on BTC. likely by summer 2025.
patience will pay sizable returns to those with the discipline required to hold.
the token is called Artificial Superintelligence Alliance and ticker is FET on Coinbase.
Remember:
"The profit isn't made in the buying or the selling, but in the waiting" - Munger

FET to ATHFET or ASI has been in a strong bullish trend since Nov 2022.
As long as it's above the SMA111, I expect it to make a new ATH.

Fetch: Low set!We now view Fetch in the same-colored wave 3, which should lead it above the $1.73 resistance. With the Target Zone deactivated, investors could move stop-losses closer to the entry price. Stops could protect against our alternative scenario (33% likely), which implies a lower low of green wave alt.2.

FETUSD on the Channel Up bottom. Buy opportunity.The Artificial Superintelligence Alliance (FETUSD) has been trading within a Channel Up since the August 05 bottom. The price is currently at the bottom of the Channel Up and around the 1D MA50 (blue trend-line), where the last Higher Low was priced (September 06).
The proper Support is offered by the 1D MA100 (green trend-line), marginally below. This price action appears to be an attempt to form the new bottom, but since the previous two Bullish Legs were confirmed upon a 1D MACD Bullish Cross, you may wait for such confirmation.
The Target is at least 2.000 (proportional % rise compared to the previous Bullish Legs. Since however the 1D MA200 (orange trend-line) provided the last rejection on the September 25 Higher High and is essentially holding as Resistance since June 27, you may wait until this breaks (candle closing above it) and then commit to a long. Trade based on your risk appetite.
-------------------------------------------------------------------------------
** Please LIKE 👍, FOLLOW ✅, SHARE 🙌 and COMMENT ✍ if you enjoy this idea! Also share your ideas and charts in the comments section below! This is best way to keep it relevant, support us, keep the content here free and allow the idea to reach as many people as possible. **
-------------------------------------------------------------------------------
💸💸💸💸💸💸
👇 👇 👇 👇 👇 👇

FETUSD BULL / Bear If weekly closes around $1.33 or lower, could be a sign of a new low. closing pattern would be Evening Star www.investopedia.com . But there is also a head and shoulders pattern if support $1.10 holds. stop loss at $1.00. under a dollar, the next support could be as low as .54$ or around .88$ for a high end support. These next few weeks could be crazy in the US market. Gonna be watching a few markets closely

Fetch: Home StretchFET has sold off as planned over the last seven days, reinforcing our primary assumption that the final subwave of wave 2 in green is currently unfolding. To catch the low of this movement, we’ve added a green Target Zone onto the chart; it ranges from $1.14 to $0.8810. Investors could enter long positions there, with stops placed about 1% below the lower edge or at the support level of $0.80. Once the low is confirmed, we anticipate a rise above the resistance at $1.73. However, if this level is breached earlier (38% probability), we will already place the coin in the green wave alt. 3.
