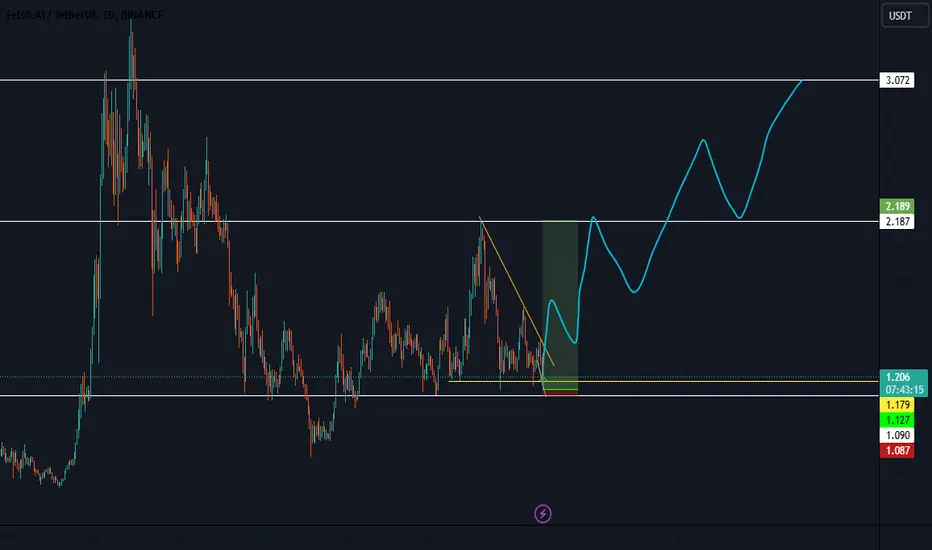
Time to BUY Fetch_aiHi fellow traders, FETUSDT is ready to make a move higher after completing the smaller correction. Target the 4 USDT level. Good luck and trade safe!
FETUSDT.P trade ideas


FET and why we can see - 70% again? BINANCE:FETUSDT
Possible Targets and explanation idea
➡️ Weekly fib legit. After AI narrative we saw perfect test 0.618 lvl
➡️ Still didn't sweep liquidity in 0.27 zone.
➡️ We can close at least 2 of green weekly gaps at least -70% again
➡️ Fundamental value based on Take Profit indicator last yellow line 0.14$
➡️ All lines are dynamic. After sweep liquidity at the bottom road will be open to weekly gap over 0.70$
Hope you enjoyed the content I created, You can support with your likes and comments this idea so more people can watch!
✅Disclaimer: Please be aware of the risks involved in trading. This idea was made for educational purposes only not for financial Investment Purposes.
---
• Look at my ideas about interesting altcoins in the related section down below ↓
• For more ideas please hit "Like" and "Follow"!

TRADE PLAN FOR FET FOR PROFITSHello traders, Another opportunity on FET , we trade what the chart tells us.
Enjoy.
Tradehubng

TradeCityPro | FET: Exploring the AI-Driven Ascendancy👋 Welcome to TradeCityPro!
In this analysis, I will examine the coin FET, a project within the artificial intelligence sector that experienced significant growth during last year's AI hype.
📅 Weekly Timeframe
In the weekly timeframe, we see an ascending trend line starting from a low of $0.058 and extending to a new ATH at $3.099. Currently, the price has responded to this region during a corrective phase, but it has technically broken this trend line in terms of time.
🔍 Although the price is no longer above the ascending trend line, it does not signify a definitive break of the trend line as the drop and bullish momentum have not directly caused a breach. The price range has resulted in a temporal break, so I personally do not consider the trend line broken yet and will wait to observe clear price momentum.
📊 Should the price gain upward momentum and the RSI return above 50, we can anticipate a rise to retest the $3.099 resistance. If this movement occurs alongside an increase in buying volume, the price might even break above this level. In such a scenario, the Fibonacci 1.0 target, which is approximately $12.6, could be reachable.
🔽 In case of further correction, the initial support is at $0.810, a significant PRZ overlapping with the Fibonacci 0.5 area. If this level breaks, subsequent supports at Fibonacci 0.618, identified on the chart as $0.488, will be tested. A break below $0.488 could signal a bearish phase as the next major support lies at $0.185. The first trigger for bearish momentum entering the market would be a break below 44.12 on the RSI.
📅 Daily Timeframe
The daily timeframe displays a range between $1.114 and $2.165. Currently, the price is at the lower end of this box, forming a descending trend line. If the price is supported at the box’s base and breaks the trend line, we can expect a move towards the upper boundary, supported by good buying volume.
🔼 If the trend line is broken, the first long position trigger is at $1.408. Concurrent breakage of this support with the RSI surpassing 50 would serve as a robust confirmation.
📉 Moreover, the bearish momentum in the market is significant, weakening the $1.114 support with repeated tests. A breach here could lead to price declines toward $0.810 and $0.488.
🧩 Overall, movements of altcoins like FET, which have a market cap below $10 billion, are greatly influenced by indices like TOTAL and TOTAL2. Thus, it is advisable to take cues from broader market indices and major coins like Bitcoin and Ethereum before making entry decisions in such altcoins.
📝 Final Thoughts
This analysis reflects our opinions and is not financial advice.
Share your thoughts in the comments, and don’t forget to share this analysis with your friends! ❤️

FET ChallengeFET moves into a decreasing triangle; if it breaks this trend, it could go to the illustrated target.


FETHi
bullish signals from RSI is evident
price is below the 50 and 200 Moving average therefore increasing the chances for buy since buyers can earn FET for cheap
two possible scenarios but I favour the 3.2 Target
good luck

FET/USDT Trade IDEA, AI coin for BULL run FET have strong potential in the AI sector and weekly chart looks good for buying for the coming bull run investment.
key area for FET need to hold at 1,
otherwise, it will go down further

Is FET About to Bounce or Break Down Completely?Yello, Paradisers! FETUSDT is at a make-or-break point right now. The recent retracement looks healthy, and the pair has taken out liquidity (inducement) from weaker hands. But can it hold this support zone and bounce?
💎If we start seeing bullish signs such as a bullish I-CHoCH (internal change of character) or reversal patterns like a W pattern or an inverse head and shoulders on the lower timeframes, the probability of a bullish move significantly increases.
💎However, be prepared for more retracement or panic selling. If that happens, the next strong support zone could trigger a bounce, but again—we need to see bullish confirmations on lower timeframes to consider entering long positions.
💎If the price breaks below the key support zone and closes candles underneath it, the entire bullish idea will be invalidated. In that case, it’s best to stay patient and wait for better price action to form before making any moves.
🎖Patience and discipline are the keys here, Paradisers. Always wait for the highest probability setups to reduce risk and increase your edge. Remember, it’s not about predicting the market—it’s about reacting to what the market gives you.
MyCryptoParadise
iFeel the success🌴

Currently, the market is moving toward the 5th wave.It is possible to buy now, but the risk might be high. The market can be utilized up to the higher high; beyond that, time will tell.

FET Set for $5.700: Key Entry and Target Levels➡️ NYSE:FET USDT
➡️Next Target: $5.700
🔵 Long Zone:
1️⃣ $1.200
🎯 Targets:
1️⃣ $3.130
2️⃣ $4.374
3️⃣ $5.700
Stop Loss: Below $1.100

FET/USDTKey Level Zone : 1.3090 - 1.3130
HMT v4.1 detected. The setup looks promising, supported by a previous upward/downward trend with increasing volume and momentum, presenting an excellent reward-to-risk opportunity.
HMT (High Momentum Trending):
HMT is based on trend, momentum, volume, and market structure across multiple timeframes. It highlights setups with strong potential for upward movement and higher rewards.
Whenever I spot a signal for my own trading, I’ll share it. Please note that conducting a comprehensive analysis on a single timeframe chart can be quite challenging and sometimes confusing. I appreciate your understanding of the effort involved.
Important Note :
Role of Key Levels:
- These zones are critical for analyzing price trends. If the key level zone holds, the price may continue trending in the expected direction. However, momentum may increase or decrease based on subsequent patterns.
- Breakouts: If the key level zone breaks, it signals a stop-out. For reversal traders, this presents an opportunity to consider switching direction, as the price often retests these zones, which may act as strong support-turned-resistance (or vice versa).
My Trading Rules
Risk Management
- Maximum risk per trade: 2.5%.
- Leverage: 5x.
Exit Strategy
Profit-Taking:
- Sell at least 70% on the 3rd wave up (LTF Wave 5).
- Typically, sell 50% during a high-volume spike.
- Adjust stop-loss to breakeven once the trade achieves a 1.5:1 reward-to-risk ratio.
- If the market shows signs of losing momentum or divergence, ill will exit at breakeven.
The market is highly dynamic and constantly changing. HMT signals and target profit (TP) levels are based on the current price and movement, but market conditions can shift instantly, so it is crucial to remain adaptable and follow the market's movement.
If you find this signal/analysis meaningful, kindly like and share it.
Thank you for your support~
Sharing this with love!
HMT v2.0:
- Major update to the Momentum indicator
- Reduced false signals from inaccurate momentum detection
- New screener with improved accuracy and fewer signals
HMT v3.0:
- Added liquidity factor to enhance trend continuation
- Improved potential for momentum-based plays
- Increased winning probability by reducing entries during peaks
HMT v3.1:
- Enhanced entry confirmation for improved reward-to-risk ratios
HMT v4.0:
- Incorporated buying and selling pressure in lower timeframes to enhance the probability of trending moves while optimizing entry timing and scaling
HMT v4.1:
- Enhanced take-profit (TP) target by incorporating market structure analysis

FETUSDT ready to take off if we break and quickly reclaim GPAI in crypto season is almost here, FET is getting ready to kickstart the Bull run with the Channel aligned to my GOLDEN POCKET fib set up... lets see how this is gonna foldout....

FET's downfall is close!BINANCE:FETUSDT
I'm still bearish on FET.
head and shoulder Pattern can be reliable, and I think we should say goodbye to the price!😅
if a bearish movement happens, the price shall decrease as much as the head length which will reduce the price by 45%
⚠️ Disclaimer:
This is not financial advice. Always manage your risks and trade responsibly.
👉 Follow me for daily updates,
💬 Comment and like to share your thoughts,
📌 And check the link in my bio for even more resources!
Let’s navigate the markets together—join the journey today! 💹✨

Rebuy Setup For FET (8H)This analysis is an update of the analysis you see in the "Related publications" section
As we showed in the previous analysis, FET is in a large diametric pattern. Currently, wave F is forming, and it will soon be completed, leading to the beginning of wave G.
Wave G is bullish. The targets have been marked on the chart.
Closing a daily candle below the invalidation level will violate this analysis.
For risk management, please don't forget stop loss and capital management
When we reach the first target, save some profit and then change the stop to entry
Comment if you have any questions
Thank You

FET about to be teleported to new highHi, I'm slowly building a SPOT position on FET since last week. I'm buying a little bit every times FET goes under 0.50$^.
I feel like what we are seing is a vertical accumulation on FET and even if FET feel disgusting to buy so close to the local ATH, it's probably going to nuke it and reach new high.
I'm speaking of a more than 100% pump in the span of two weeks.
Of course because of the way it look, i'm not using leverage because if it wick down before pumping just to flush longs that would be unfortunate :D
----------------------------------------------------------------------------------------------------
Goal : 2 000 000$ from 2 000$
Wallet last update : 2583$
Wallet today : 3104$
----------------------------------------------------------------------------------------------------

FETUSDT - Follow the arrows!FETUSDT looks very strong af, need to touch value gaps below to go up, Make the positions while the dip goes off!

FET/USDT LONG TRADE SETUP !!This is a long trade setup for FET/USDT with specific entry, stop-loss, target, and leverage details:
Entry: Current Market Price (CMP) and $1.4744
Stop-Loss: $1.44
Target: $1.6200
Leverage: 5x to 10x
Let me know if you’d like further assistance or adjustments!
DYOR. NFA

"Fetch.ai: Powering the Future of AI and Blockchain"#FET
Fetch is transforming the AI and blockchain space with a decentralized machine-learning network. Its platform democratizes AI access, enabling secure, autonomous task execution globally. From optimizing DeFi services to improving smart grids, the use cases are vast.
Our strategy for #FET is to accumulate during market dips, positioning for long-term growth as demand for AI solutions rises. #FET is set for future gains.
Accumulation zone: $1.10 to $1.30.
DYOR, NFA


