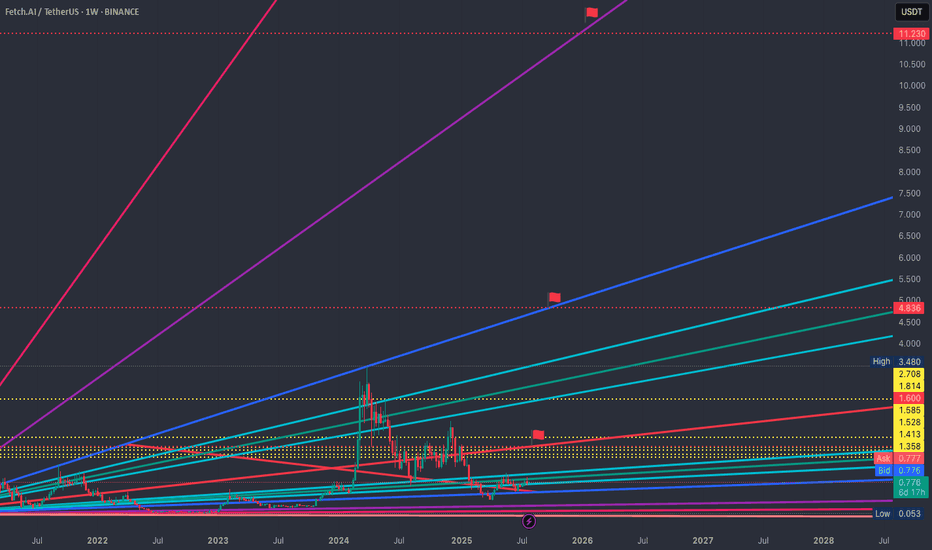
$FET is back in the zone that sparked 15,000%+ rallies?NYSE:FET is back in the zone that sparked 15,000%+ rallies. Same setup. 50x incoming?
FET continues to respect its multi-year ascending channel structure, active since 2020.
Price Action History:
🔹 Wave 1 (2020–2021): +15,600% rally from channel support to resistance
🔹 Wave 2 (2022–2024): +6,400%
Related pairs
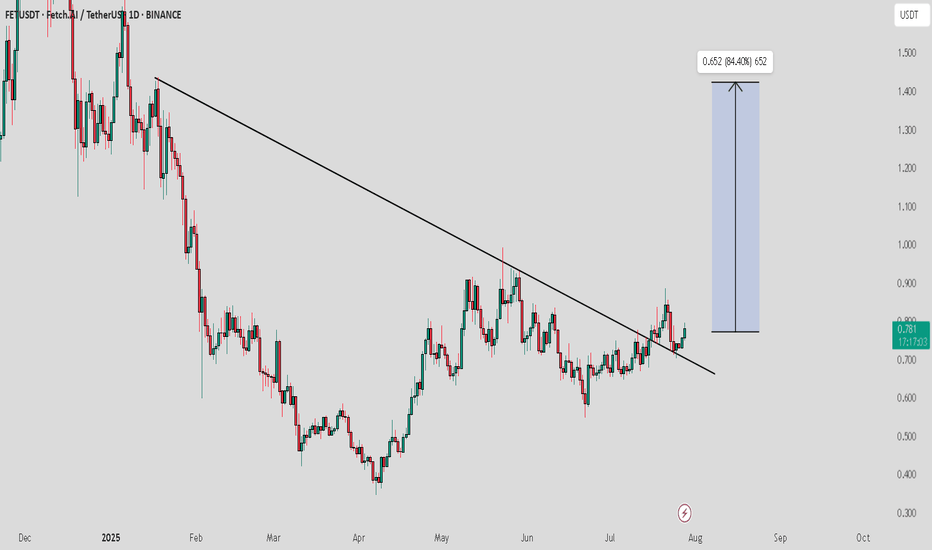
FETUSDT|C&H Setup +100% Breakout MA cluster-A High Quality BreakCup&Handle setup with a high quality breakout the confluent MA cluster—especially the 200-day— as the gatekeeper.
If price hold above the ma200 (and the nearby 20/50) cluster a high-quality breakout and more likely to break the handle and the cup rim.
Here is how I’d weigh it and trade it: DON'T
Will FETUSDT Trap the Bulls Before a Brutal Drop?Yello Paradisers — is FETUSDT setting up the perfect bull trap before a sharp sell-off? The current market structure suggests danger ahead, and ignoring it could be costly.
💎FETUSDT remains in a clear bearish market structure. After taking inducement, price is now moving toward a key resistance zon
FET on Fire: Volume-Backed V-Pattern Breakout in 4H Structure💀 Hey , how's it going ? Come over here — Satoshi got something for you !
⏰ We’re analyzing FET on the 4-hour timeframe .
👀 After breaking out of its range around $0.75, FET experienced a solid upward move , reaching $0.876 . However , it was rejected from that level and faced heavy selling pressu
Artificial Alliance (FET): Good Opportunities For Trades HereBINGX:FETUSDT.P can provide us with favorable risk-to-reward trades in both directions. We are looking for now for a bullish outcome here, where we are targeting upper zones of $0.77 and $0.88, but this game plan will be active only as long as we are above $0.60.
As if sellers take over that $0.6
FET/USDT Testing Fibonacci – Bounce Incoming or Breakdown Ahead?📊 Technical Analysis Overview:
FET/USDT is currently testing a strong demand zone aligned with the Fibonacci Retracement 0.5 – 0.618 levels, specifically between $0.648 and $0.584. This “golden pocket” area is historically significant and often acts as a pivot zone for price reversals.
🔍 Chart Pat
Artificial Superintelligence (FET): Looking For Buy Entry 2We are shifting our focus currently to the 200EMA, where we are expecting the price to reach that area this week; after that, we will be looking for a proper breakout from that region.
In total we still got those 3 entry points we've been aiming for since last time so we wait patiently, not rushin
See all ideas
Summarizing what the indicators are suggesting.
Oscillators
Neutral
SellBuy
Strong sellStrong buy
Strong sellSellNeutralBuyStrong buy
Oscillators
Neutral
SellBuy
Strong sellStrong buy
Strong sellSellNeutralBuyStrong buy
Summary
Neutral
SellBuy
Strong sellStrong buy
Strong sellSellNeutralBuyStrong buy
Summary
Neutral
SellBuy
Strong sellStrong buy
Strong sellSellNeutralBuyStrong buy
Summary
Neutral
SellBuy
Strong sellStrong buy
Strong sellSellNeutralBuyStrong buy
Moving Averages
Neutral
SellBuy
Strong sellStrong buy
Strong sellSellNeutralBuyStrong buy
Moving Averages
Neutral
SellBuy
Strong sellStrong buy
Strong sellSellNeutralBuyStrong buy
Displays a symbol's price movements over previous years to identify recurring trends.
Frequently Asked Questions
The current price of Fetch.AI / TetherUS (FET) is 0.723 USDT — it has fallen −2.38% in the past 24 hours. Try placing this info into the context by checking out what coins are also gaining and losing at the moment and seeing FET price chart.
Fetch.AI / TetherUS price has risen by 9.75% over the last week, its month performance shows a −2.38% decrease, and as for the last year, Fetch.AI / TetherUS has decreased by −11.40%. See more dynamics on FET price chart.
Keep track of coins' changes with our Crypto Coins Heatmap.
Keep track of coins' changes with our Crypto Coins Heatmap.
Fetch.AI / TetherUS (FET) reached its highest price on Mar 28, 2024 — it amounted to 3.480 USDT. Find more insights on the FET price chart.
See the list of crypto gainers and choose what best fits your strategy.
See the list of crypto gainers and choose what best fits your strategy.
Fetch.AI / TetherUS (FET) reached the lowest price of 0.007 USDT on Mar 13, 2020. View more Fetch.AI / TetherUS dynamics on the price chart.
See the list of crypto losers to find unexpected opportunities.
See the list of crypto losers to find unexpected opportunities.
The safest choice when buying FET is to go to a well-known crypto exchange. Some of the popular names are Binance, Coinbase, Kraken. But you'll have to find a reliable broker and create an account first. You can trade FET right from TradingView charts — just choose a broker and connect to your account.
Crypto markets are famous for their volatility, so one should study all the available stats before adding crypto assets to their portfolio. Very often it's technical analysis that comes in handy. We prepared technical ratings for Fetch.AI / TetherUS (FET): today its technical analysis shows the buy signal, and according to the 1 week rating FET shows the neutral signal. And you'd better dig deeper and study 1 month rating too — it's sell. Find inspiration in Fetch.AI / TetherUS trading ideas and keep track of what's moving crypto markets with our crypto news feed.
Fetch.AI / TetherUS (FET) is just as reliable as any other crypto asset — this corner of the world market is highly volatile. Today, for instance, Fetch.AI / TetherUS is estimated as 7.09% volatile. The only thing it means is that you must prepare and examine all available information before making a decision. And if you're not sure about Fetch.AI / TetherUS, you can find more inspiration in our curated watchlists.
You can discuss Fetch.AI / TetherUS (FET) with other users in our public chats, Minds or in the comments to Ideas.


