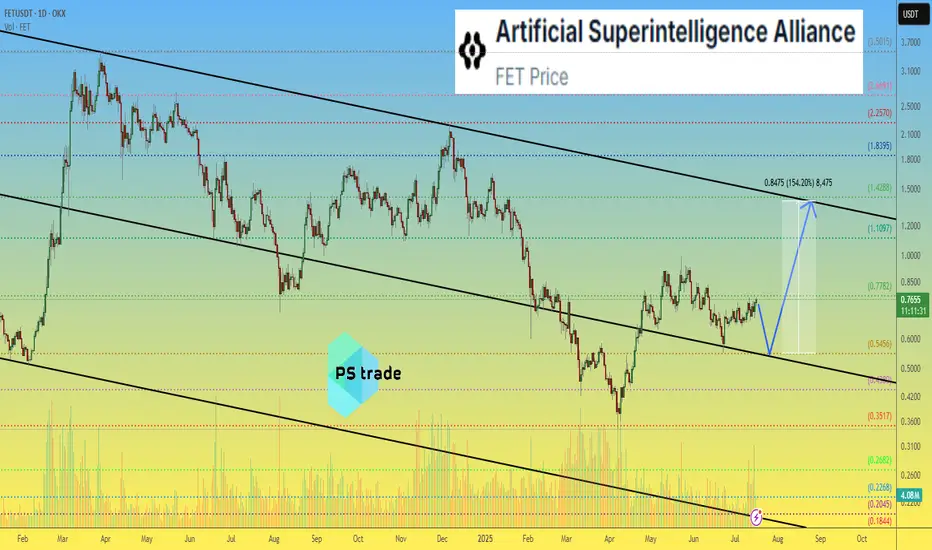
Artificial Superintelligence Alliance (FET) Enters Bullish PhaseThere is always really high volume on this chart. FETUSDT trading is very active and this is always a good signal regardless of the overall picture. It means there is interest in this trading pair. Some pairs you can see have absolutely no volume and you know only bots are trading it. When volume is high, you know there are some people buying and selling behind the scenes and when the market goes on a trend, it tends to produce wild moves. So high volume is always good.
The trend is the uptrend next. We already saw a major downtrend starting March 2024. After a low in August 2024, the classic dead-cat-bounce led to a lower high in December and then the final bottom, just two months ago. This is the correction end and bottom and from this bottom we grow. Market conditions are changing.
The bearish phase is over and it lasted more than a year. One year and one month. We are now entering a new phase and it will be a bullish cycle. How long will it last? Can the bullish cycle last just 3 months while the bearish cycle lasted 13 months? These are good eye opening questions. It shows that we might be setting ourselves up for an entire year of growth.
Actually, can be 4 months, 6 months, 8 months, 12 months or more... It doesn't matter, we are going up. Artificial Superintelligence Alliance —FET.
Namaste.
FETUSDT trade ideas

FET — The AI narrative isn't over yetFET is still being held back by the 0.75–0.80 zone, but bulls are not giving up. On the daily timeframe, a trend reversal is emerging based on the moving averages. A breakout above resistance could send the price toward the $1 area — a potential 50–60% gain, which looks quite attractive for a spot long. Support lies at 0.67–0.70. With multiple attempts to break through, there’s a strong chance the next test of the 0.80 zone will lead to a breakout.
Entry on confirmation above $0.80, targeting $1.20

Artificial Superintelligence (FET): Looking For Buy Entry 2We are shifting our focus currently to the 200EMA, where we are expecting the price to reach that area this week; after that, we will be looking for a proper breakout from that region.
In total we still got those 3 entry points we've been aiming for since last time so we wait patiently, not rushing.
It does not matter which entry will be triggered; once we see that, we will be opening a decent R:R position (more info once we reach certain zones).
Swallow Academy

FET Secondary trend 19 07 2025Logarithm. Time frame 1 week for clarity.
Main trend is an ascending channel.
Secondary trend is a descending channel
Local trend is a Ross hook, at the median resistance. Reversal zone.
By the way, the trading idea from 2022 FET/BTC is still relevant. Pay attention to where the price is.
FET/BTC Main trend. Pump zone cycles . 2022 06

FET Setup: Reclaim, Retest, RallyScenario:
Price reclaimed the 1W order block (OB), confirming strong support in the $0.60–$0.70 area.
If price consolidates above this weekly OB, expect continuation toward the $0.96 equilibrium/resistance zone.
A pullback to retest the 1W OB as support (especially in August) is possible and would be a high-probability entry zone for longs.
Failure to hold the 1W OB would invalidate the bullish setup, so stops should be placed below this level.
Reasoning:
The successful reclaim of the weekly order block signals a structural shift from bearish to bullish. Holding above this area invites further upside, as demand is confirmed. A retest and bounce from the 1W OB would provide a strong confirmation for additional upside, while failure to hold would indicate the move was a deviation. Patience for a clean retest is likely to reward, with targets toward the equilibrium near $0.96.

Artificial Superintelligence Alliance - FET price analysis📈 It looks like the price of the combined and updated #FET is trying to consolidate at the top of the channel.
All that remains is to wait for confirmation, i.e., for the OKX:FETUSDT price to stay above $0.55 in the coming days/weeks.
🤖 And then the #ArtificialSuperintelligenceAlliance token (the name is more complicated than the stop word from the movie “Eurotrip” — "hello olds" :) can be purchased for an investment portfolio with a growth potential of at least +150%.
_____________________
Did you like our analysis? Leave a comment, like, and follow to get more
Artificial Superintelligence (FET): Seeing Buying OpportunitySeeing a good opportunity for buying forming here, where we are seeing a proper overturn of trend happening.
We are not going to rush but wait for a proper break of structure to form, which would give us our last confirmation for upcoming bullish movement on FET so focus your attention on the buy entry for now.
Swallow Academy

Realistic targets for fet Dear Traders,
Fet have a nice potential im also invested in , here the full targets and realistic ,
you can check my analysis on my profil and see how most of my analysis hit targets ,
fet may take time its too slow
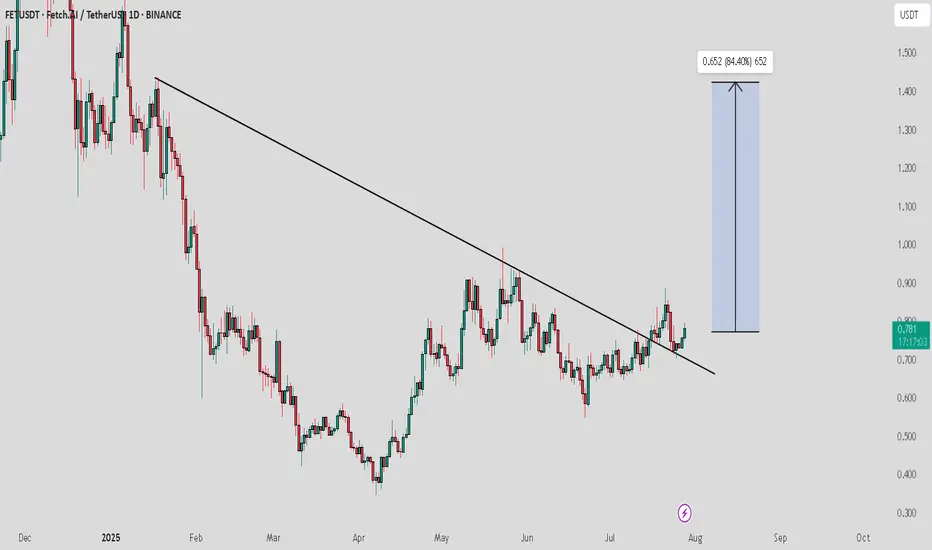
FET / USDT : Momentum building after successful retestFET/USDT has successfully broken out of the descending trendline resistance and is now holding strong after a successful retest. With momentum building, we are expecting a significant move towards the $1.5 level in the coming weeks.
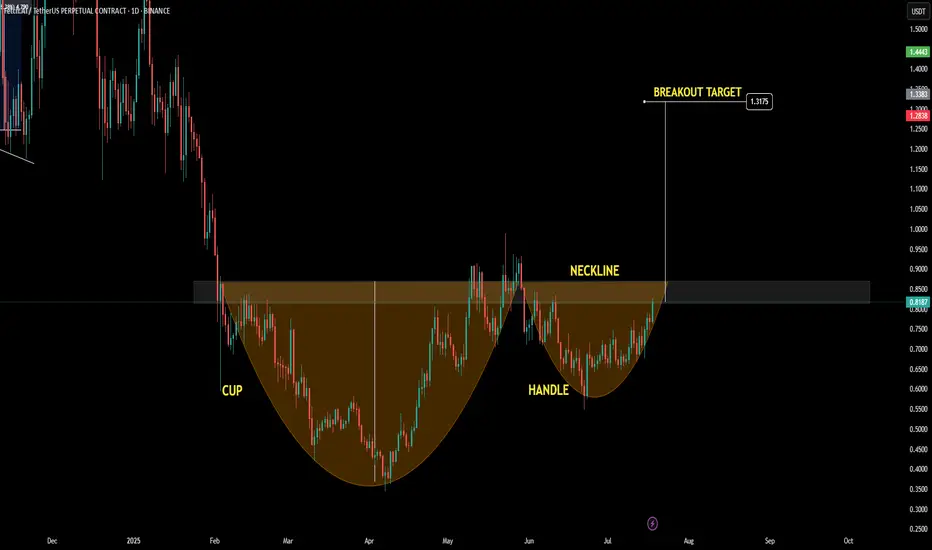
$FET possible Cup & Handle pattern forming!🚨 NYSE:FET possible Cup & Handle pattern forming!
Price is currently at resistance (neckline), a small correction could come before the breakout.
Let’s hope CRYPTOCAP:BTC continues to pump or at least move sideways for this to play out. If BTC dumps, most altcoins will follow.
FET - Perfect trade for beginner- FET is breaking out from the flag pattern and we have clear and confirmed breakout
- most of the like flag pattern breakout succeeds, this gives a high confidence trade
Entry Price: 0.775 (current price)
Stop Loss: 0.5307
TP1: 0.9072
TP2: 1.1495
TP3: 1.3791
TP4: 1.7927
TP5: 2.1468
Max Leverage 5x
Don't forget to keep stoploss
Cheers
GreenCrypto

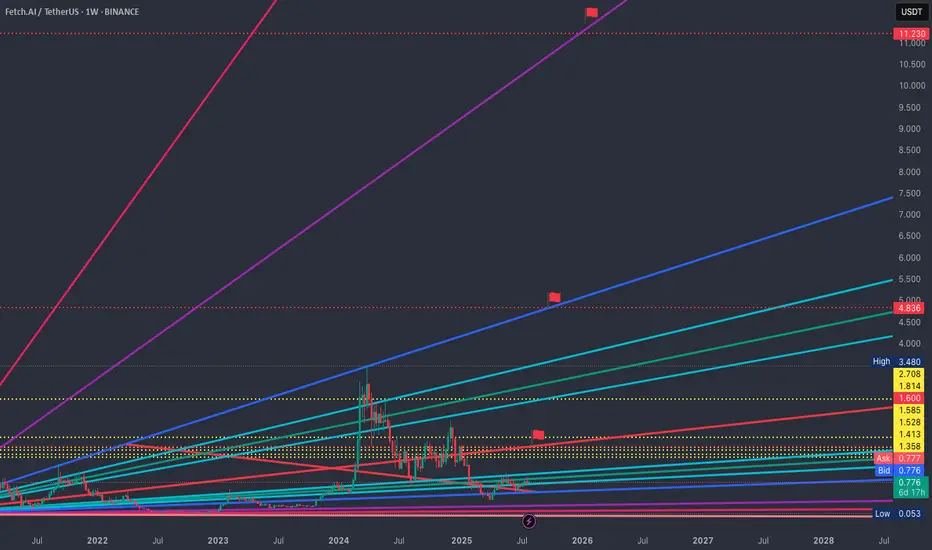
FET weekly view and lookout FET doesn't give much weekly indicators but there can be a channel assumed in which the upper end (channel top) is a current resistance indication of parabolic rises in the future and the lower end (channel bottom) a support indication.
if we follow the channel top towards end of 2025, a price of roughtly $5 can be assumed. of course trajectory and upside are volatile and with major news the channel top might be even breached. since BINANCE:FETUSDT already has a more than doubling of it's price top compared to 2022, it's hard to guess where we go from here.
I'd assume it'll respect the bottom trendline a few times before making its next big move up. Especially since it's recent partnership with agix and ocean protocol and the still not really happened AI craze of the AI sector in crypto (comparatively speaking).
maybe the 4h gives more indications in my next post.

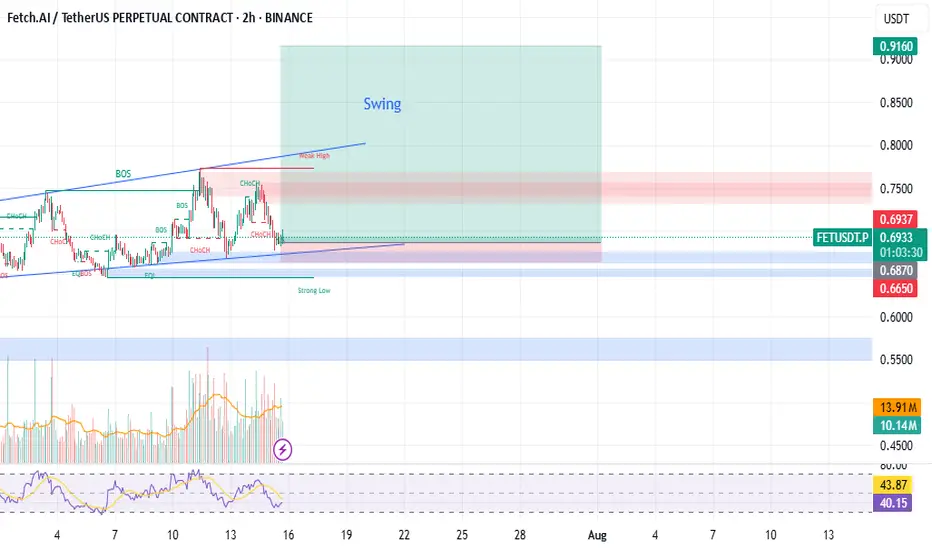
Fet to LongFet is trading in an ascending pattern. one can take a long entry. with stoploss closing below previous high.
Entry : 0.6870
Stop-Loss : 0.6650
Tp 1 : 0.7650
Tp 2 : 0.9160
Trade at your own risk
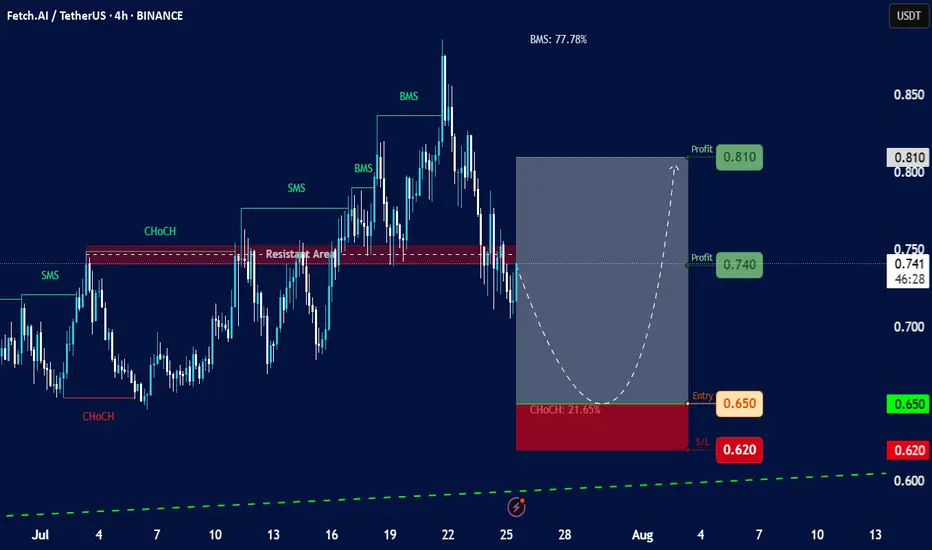
Fetch.AI (FET) against TetherUS (USDT)Chart Overview:
Asset: Fetch.AI (FET) against TetherUS (USDT).
Timeframe: 4-hour (4h) candles.
Current Price (approximate based on chart): Around 0.741 USDT.
Date and Time on Chart: July 25, 2025, 15:11 UTC+4 (This matches the current provided time context, so the chart is very recent).
Overall Trend: The chart shows a recent upward movement followed by a retracement. There are clear indications of "SMS" (Structural Market Shift) and "BMS" (Break in Market Structure) bullish movements, indicating an uptrend was in play.
Key Technical Observations and Labels:
"ChoCH" (Change of Character):
Initial Bullish ChoCH (early July): An initial "ChoCH" is marked early July, signaling a potential shift from bearish to bullish sentiment.
"SMS" (Structural Market Shift) & "BMS" (Break in Market Structure):
Several "SMS" and "BMS" points are identified, suggesting consecutive higher highs and higher lows, confirming an uptrend. The "BMS: 77.78%" label might refer to the percentage gain from a previous low to a recent high, or a percentage of the total movement.
"Resistant Area":
A significant horizontal red dashed line labeled "Resistant Area" is present around the 0.74-0.76 USDT level. This area previously acted as resistance, and the price is currently retesting or struggling with it.
Current Price Action:
The price has recently come down significantly from a peak around 0.88 USDT, retesting the "Resistant Area." It appears to have broken below some immediate support levels.
Proposed Trade Setup (Green Box & Red Box):
Entry (Green Line): 0.650 USDT. This is positioned below the current price, suggesting a "buy the dip" strategy.
Stop Loss (Red Line): 0.620 USDT. This is a tight stop loss, indicating a risk management level if the price drops further.
Profit Targets (Green Boxes):
Profit 1: 0.740 USDT (already very close to the current price, potentially hit or missed depending on execution).
Profit 2: 0.810 USDT.
"ChoCH: 21.65%" (near entry zone): This likely indicates the percentage retracement from the peak to the proposed entry zone, suggesting it's a significant pullback.
Projected Path (Dashed White Line): The curved dashed line shows an anticipated price movement: a dip down to the 0.650 entry zone, followed by a bounce back up towards the profit targets.
Analysis of the Proposed Trade:
Risk-Reward:
Risk: From 0.650 (Entry) to 0.620 (S/L) = 0.030 USDT risk.
Reward 1: From 0.650 (Entry) to 0.740 (Profit 1) = 0.090 USDT reward. (Ratio: 3:1)
Reward 2: From 0.650 (Entry) to 0.810 (Profit 2) = 0.160 USDT reward. (Ratio: approx. 5.3:1)
The risk-reward ratio appears favorable for this proposed trade.
Logic: The setup seems to be based on the idea of a significant retracement (pullback) to a key support level (the proposed 0.650 entry, potentially an order block or demand zone not explicitly marked but implied by the "ChoCH: 21.65%" label in that area) after a strong bullish run. The "Resistant Area" at 0.74-0.76 becomes the first target as the price would need to break back above it.
Considerations and Potential Risks:
Validity of Support: The effectiveness of the 0.650 level as strong support is crucial. If it breaks, the price could fall further.
Market Structure Shift (again): While the uptrend had strong "BMS" signals, the current deeper retracement could lead to a bearish "ChoCH" on a higher timeframe if the 0.650 support fails.
Liquidity: Ensure sufficient liquidity at the proposed entry and exit points, especially with a tighter stop loss.
Overall Market Conditions: The performance of Bitcoin (BTC) and the broader crypto market will significantly influence FET's price action.
Volume: The chart doesn't show volume indicators, which would provide additional insight into the strength of price movements.
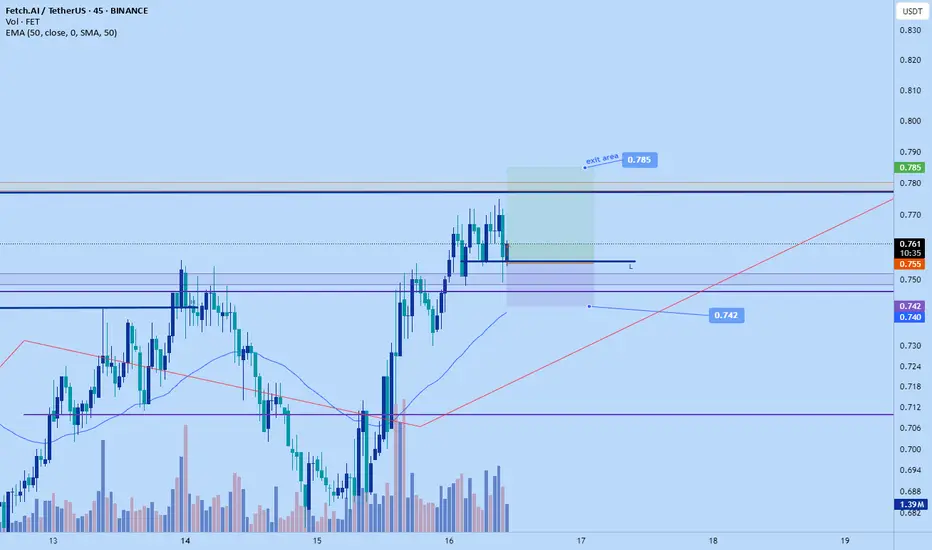
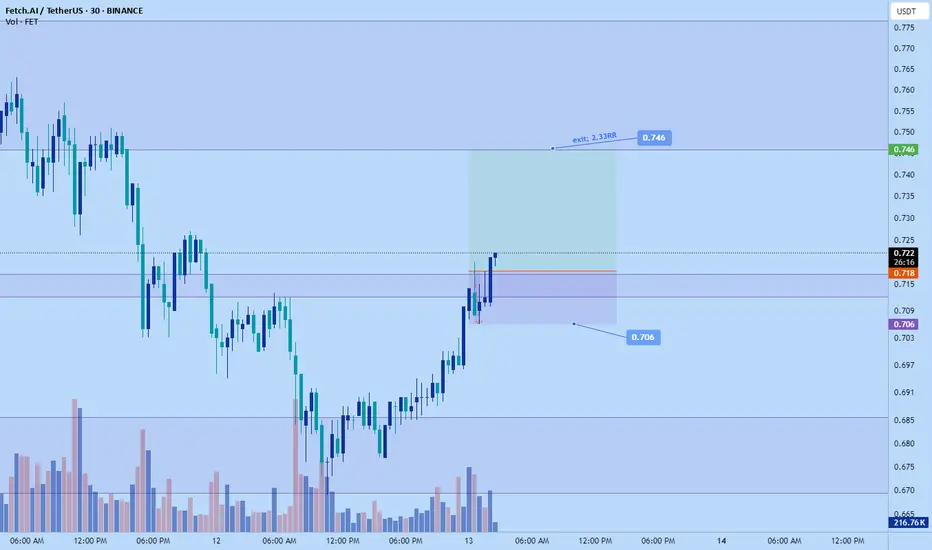
Fet pump to $0.785 todayWent long on FeT
Target area: $0.785
Stop: $0.742
Roughly 2 RR
If pull back to entry it be good to enter as if you just seeing will probable only able to get 1 RR
FETArtificial Superintelligence Alliance
Fetch.AI is a decentralised digital world in which useful economic activity takes place. This activity is performed by Autonomous Agents.
Everything is clear on the chart.
I wish everyone abundant profits.
Like and follow
for more.

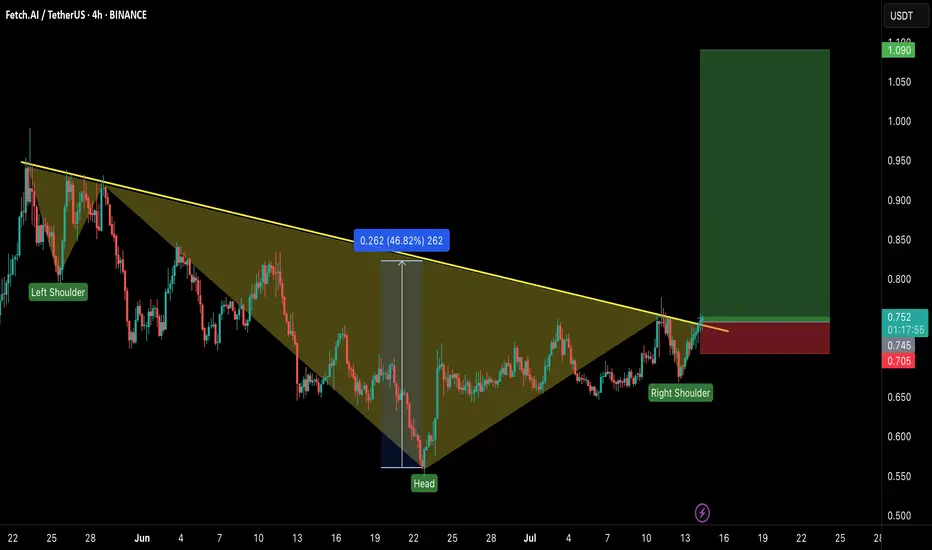
FET/USDT – Head & Shoulders Breakout!Hey Traders — if you're into high-conviction setups with real momentum, this one’s for you.
ONDO is trading inside a falling wedge on the daily chart — a classic bullish structure that often leads to explosive breakouts. 📈
FET just broke out of a classic inverse head & shoulders pattern — a strong bullish reversal structure! The breakout looks clean with a confirmed close above the neckline and volume starting to pick up.
💼 Entry: CMP ($0.75)
🎯 Targets: $0.85 / $0.95 / $1.09
🛑 Stop-loss: $0.705
📈 Risk-Reward: Favorable
🧠 Why it matters:
Clean breakout above resistance
Strong trend reversal structure
Potential for 40%+ move ahead.
💬 Are you in this breakout play or watching from the sidelines? Let’s talk below!
👉 Smash that LIKE and FOLLOW for more real-time setups!
FET – HTF Setup Primed for ExpansionFET is looking strong here from a high time frame perspective — currently sitting around $0.739, well into the discount zone of the macro trend channel.
We’ve got:
✅ Price holding monthly demand
✅ A clear swing higher low forming on the weekly and 3W
✅ Already seen the first expansion leg out of demand
✅ Now potentially loading the next move higher
Zooming out, price is still trading below the midline of the long-term uptrend channel — and a move back to the upper boundary puts targets in the $6 region, aligned with a new higher high.
📈 HTF Structure
Midline rejection flipped support
Demand tested and respected
HL printed after clean retest
370% upside just to retest the prior HH at $3.50
HTF trend structure still fully intact
This setup is also supported by the broader HTF bullish bias across BTC, ETH, and majors, which adds confluence to a potential larger expansion phase for alts — especially strong narratives like AI.
🎯 Targets
🎯 $3.50 = prior high
🎯 $6.00+ = upper channel target / next HTF extension zone
From current levels, risk/reward looks very clean.
1W:
3W:
3M:

FET — AI Market Wake-Up Above $0.801. Watch for breakout & close above $0.80
2. Enter on confirmed weekly hold > $0.80
3. TP: $1.12–1.25 (major resistance)
4. Key support: $0.73–0.71 (must hold)
5. Stop: below $0.71

$FET Broke out from the bull flag!!🚨 NYSE:FET is broke out from a falling channel — and it’s about to go FULL SEND! ⚠️📈
It’s pressing above the breakout zone💣
Break above $0.72, and we’re ripping to $0.84 → $1.00 like it’s programmed. 🔥
🤖AI season heating up. Chart structure loaded.
💥The breakout candle has come. Be early — or be exit liquidity.

FET to 1$ this week?NYSE:FET Has broken out of the bull flag!✔️
This has so far come +40% and now looks certain to test the benchmark level next!
Potential Target should be 1$ atleast! This has a potential of going 50x from 1$ as well but we discuss that later when the time comes✍🏻

Buy Trade Strategy for FET: Backing the Future of AI & BlockchaiDescription:
This trading idea highlights FET (Fetch.ai), a cryptocurrency powering a decentralized network that merges artificial intelligence and blockchain to create autonomous economic agents. These agents are designed to optimize services such as transportation, supply chain, and smart city infrastructure. FET is at the forefront of this innovative fusion, aiming to decentralize machine learning while reducing inefficiencies in data-driven industries. Backed by strong development momentum, strategic partnerships, and increasing relevance of AI technology, FET presents a compelling long-term use case in a rapidly evolving digital economy.
Still, it's important to understand that the crypto market remains highly volatile. News related to regulation, tech adoption, and market sentiment can rapidly shift valuations. Projects like FET, though fundamentally strong, are not immune to speculative pressure and risk.
Disclaimer:
This trading idea is for educational purposes only and should not be considered financial advice. Investing in cryptocurrencies like FET involves a high level of risk, including the potential for total capital loss. Always conduct your own due diligence, assess your financial condition, and consult a licensed financial advisor before making any investment decisions. Past performance is not indicative of future results.
