FET turns bullish at demandFet accumulating long position swapping all the cheap tokens from traders and adding more ATR.Trade RR is 1:30 which is incredible
FETUSDT trade ideas

FET.AI-USDTWe have a big push to the up side from 0.80$ to 3.48$ we a 5 wave and we are in And a corrective triple came. Or let's say a corrective price channel. On our Relative Strength Index, we have divergence. Price difference. Now we are waiting for the rise and the breakout of the trend shown below in the Relative Strength Index box.Once the price breaks out and the trend line is broken in the RSI, a bomb will occur in this currency and we are targeting a new high higher than the previous high at $3.40.

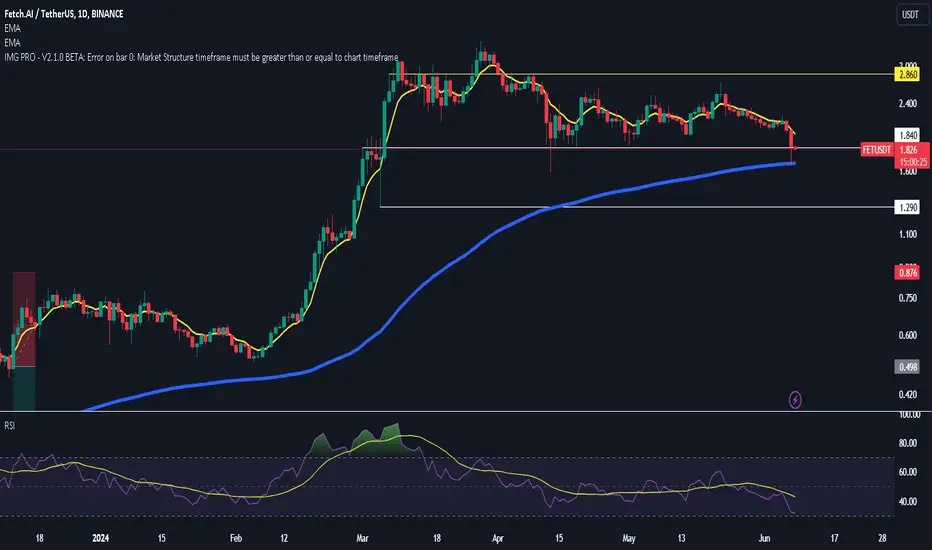
FETUSDT 1DThere is a significant bullish flag formation on the #FET daily chart. #FET has rebounded from the middle line of the channel and is currently approaching the EMA200, which is approximately $1.653. In the event of a successful breakout, the following targets are in consideration:
$2.002
$2.351
$2.782
$3.480

FETCH AI (FET/USDT) GOING VIRALAfter local accumulation we can see another good buy from a diller with structure change, which can lead price to a new highs which are located on the chart

#FET: LOW RISK, HIGH REWARD TRADE SETUP!Hey everyone! If you enjoy this content, please consider giving it a thumbs up and following for more analysis.
FET looks good here in ltf. It breaks out the bull flag-like structure in 1hr time frame and a retest is also done. It might start another good rally from here. Long some here and add more in the dip.
Entry range:- $1.54-$1.60
Target:- 20-25%
SL:- $1.50
Lev:- 5x-10x
What are your thoughts on FET's current price action? Do you see a bullish pattern? Share your analysis in the comments below!

Fetch.ai flashes bullish MACD signal on the 1D chart!FET has flashed a bullish MACD crossover on the 1D chart.
Based on backtests, the signal shows a solid probability of achieving more than 10% gains.
The signal calculates the profit potential even higher at a level of 34%.
However, based on the current chart, this would imply a break of resistance at $2. If FET manages to break through, a run towards $2.5 looks possible.
However, it might wise to take first profit at the $2 level — which still results in 20% gains.
Let me know your thoughts.

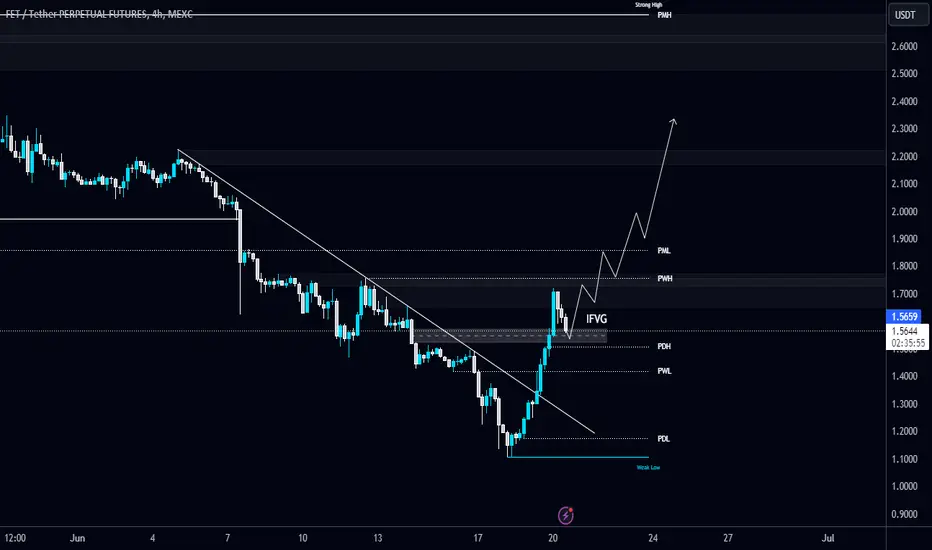
#FET/USDT breaks the Diagonal Trendline and currently testing IF#FET/USDT breaks the Diagonal Trendline and currently testing IFVG in 4-Hour TF!
I'm expecting a bounce from here. The breakdown of this IFVG will invalidate the trade. The local resistance level is PWH $1.76.
FET priceThe price action signifies that the token has signalled a positive buy signal and trapped the seller army.

FETUSDT(Fetch.AI) Daily tf Range Updated till 20-06-24FETUSDT(Fetch.AI) Daily timeframe range. PA trying to break out of 1.708 but it needs a valid close for that. breaking it clean will lead it to 1.999 which is not that far away. local support is at 1.160.

FET FETCH.ai about to define its final targetLets start with the local inner fibs: Got a nice 5 wave structure obeying the rules and possibly going to end near this 8.236/16.236 confluence. Could as well still go to 3-4-5 usd before reversing as trend is very strong.
On the intermediate it would be very good to trigger 2.618 @ $5.30 on this leg to get a final high target in 4.236 area. If it fails to trigger, it most likely "only" will reach max 3.618
On the large fibs if it happens to trigger 1.886 on the run this will ultimately set even more higher targets for the next leg up to come after this cycle.
---
If you like my content, if it helps you gain profit, give it a like!
Thanks!
---
Hold my beer pls
----
No financial advice, do your own research, don't be stupid

FET retest strong support !FET / USDT
Price is bouncing hard from old resistance zone which is turned into support now
this support wasn’t formed in days or weeks but in years between 2019-2024 Which make it very strong support zone and with important indicator
As long as this support is holding the sentiment is extremely bullish
Important note : FET will merge with OCEAN and AGIX and will turn into ASI token soon
Best of wishes

Possible Double Bottom on FET/USD Daily ChartIf you're seeing a double bottom pattern forming on the daily chart of FET/USD, it could be a sign of a potential trend reversal. Here's what a double bottom typically indicates:
Price Decline: The price falls to a support level (bottom 1), then rallies but fails to break significantly above a resistance level.
Retest and Support: The price declines again (bottom 2), ideally retesting the previous support level (bottom 1) or forming a slightly higher low. This retest demonstrates buying pressure at that price point.
Breakout: If the price breaks above the resistance level (neckline) connecting the two bottoms, it suggests a potential trend reversal from downtrend to uptrend.
Target Price Based on Double Bottom:
The technical analysis concept suggests a price target can be projected by measuring the distance between the neckline and one of the bottoms and adding that distance to the breakout point. In your case, if the neckline breakout occurs and the target is $3+, then the measured distance between the neckline and the bottom would be the difference between the target price and the current breakout price.

Quickie on FETOpened a long at current prices, expecting a push into 2$ next week, prob. tue/wed.
Stay safe!

ASI - Fetch AI Downtrend on the short-term and until mergerThe price has been consolidating after its all time high. Sell pressure is pretty high.
The 50 and 100 Moving Averages have crossed after hitting the SELL Order Blocks at ATH getting us a selling volume of over 167M and 83M (A, A2).
Price has broken through the small buy OBs (B2) and it's headed towards the OBs which I marked with A3 and B. With the upcoming merger (sometime hopefully this year if the team is actually being serious about this whole ordeal and won't disappoint degens with further delays.)
Conclusion: Even though the price seems to be in a confirmed downtrend, I'm staying hopeful and thinking about a good scenario: once the fat OBs at B gets filled (539.683M) and if the merger will be in any way successful - price is gonna turn hard erected with green bars towards astronomical gains. Partnership with Deutsche Telekom is also VERY based, I'm wondering if they're going to be utilizing Agents as Customer Support or if the use cases would go out to be more complex than that. Either way, price actions stays negative until we reach the bottom OBs.
What's your thoughts on ASI/FET? Where do YOU see it heading price-wise?

FETUSDT still on the bearish trend. FETUSDT is still on the bearish, but retracement is incoming soon. Before the bearish trend continue

FET multiple bullish divergences....Multiple Divergences on $FET!
After the local downtrend, a bottom is going to be in this area.
Patience.

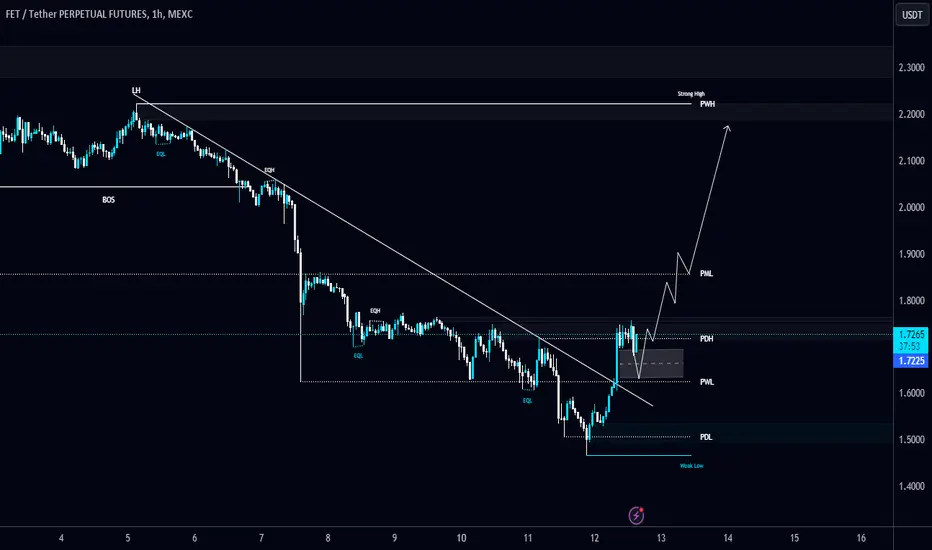
#FET/USDT breaks the Diagonal Trendlien in 1-Hour TF!#FET/USDT breaks the Diagonal Trendlien in 1-Hour TF!
Keeping an eye on mid-level of the FVG, I will wait for confirmation to open the Long position. The local resistance level is PML $1.8585.
FET ANALYSIS (1D)According to the FET, it is inside the large C wave and this wave is a large diametric. It seems that we are at the end of the e wave of C.
From the red range it can drop in the medium term to complete the big F wave to the green range.
Closing a daily candle above the invalidation level will violate the analysis
For risk management, please don't forget stop loss and capital management
Comment if you have any questions
Thank You

FET/USDT - 2021 High Revist, Wave 4 pullback into GP?Fet to ASI merger has just been postponed till 15th July.

FETCH AI Before mergerJust an idea I still need to develop further, as you can see fetch has had a beautiful runup until this point. It's a big question if it will follow the same pattern after the merger, but just in case it does continue on this track - we can use this chart to further explore the upwards channel.

$FET reclaim white line or go for liquidity below 200 ema then pop
either way watching for now
rsi looks to be reset...almost
#FET is currently at 0.618 fib level, which is important..Almost every altcoin fell during yesterday's market dump! I expect the price to hover around this level for some time or even dip slightly to take out the liquidity below, gathering the necessary momentum to start a new uptrend.
Holders will make it. Traders, not so much. :)

📈Fetch AI can go high to $20 level / Alt Season rally📉BINANCE:FETUSDT
COINBASE:FETUSD
Hello traders.
Fetch AI is my Second suggestion for the altcoin market.
As you can see, the price has broken its long-term pitch-fork structure. As long as the price rally is ongoing outside the pitchfork, the $6.4 and $9 targets are active.🎯
Considering the previous price rally, there is a possibility of a price correction to the middle levels of the pitchfork (dynamic and then static supports).🧨
The best strategy for altcoins is to allocate a certain percentage of assets (for example, 10% of the total portfolio) to buy potential altcoins.🎲
In the following week, I will introduce and complete the list of my suggested altcoins.
I plan to monitor these altcoins weekly.
