FETCH to $1 Fetch decentralized AI still bullish, very strong fundamentals
another strong buy signal.
Thoughts for 2024 - $5
FETUSDT trade ideas

1$ FETUSDT COMING SOON!HI Guys!
BINANCE:FETUSDT is one of the best in the field of artificial intelligence , which everyone, including myself, believes will experience great growth in the upcoming Bullrun .
My mid-term targets will be $0.5, $0.6, and $1 , but we have to wait for the pullback to be confirmed and completed before buying .
I think the price of 25 to 27 cents can be suitable for BUY .
Consider a possible stop loss lower than the price of 18 cents !

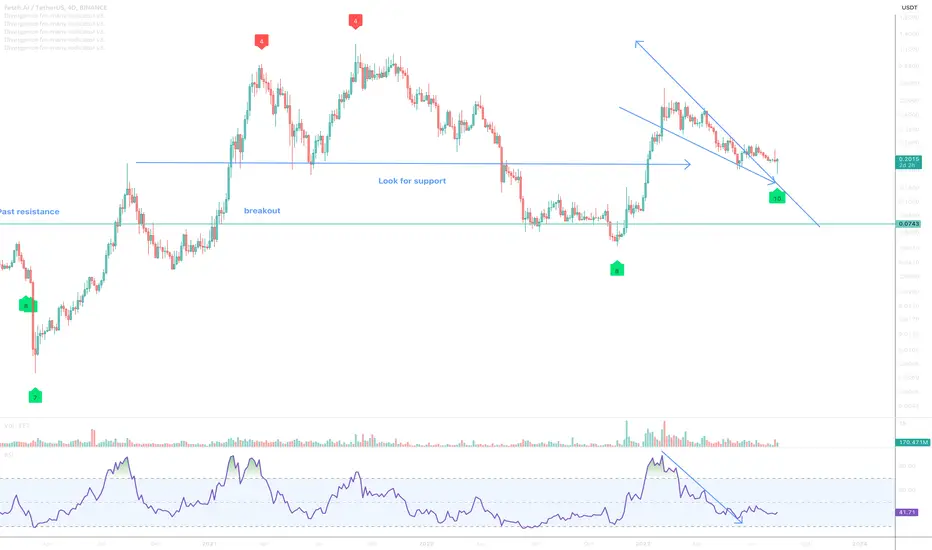
Fetch.ai FET - Bullish divergence On the above 4-day chart price action has corrected 70% since the sell signal in November. Now is a excellent moment to be long. Why?
1) Price action and RSI resistance breakout.
2) Regular bullish divergence. Multiple oscillators are printing positive divergence with price action.
3) Price action tests past support that first printed 3 years ago.
Is it possible for price action to fall further? Sure.
Is it probable? No.
Ww
Type: trade
Risk: <=6% of portfolio
Timeframe: Now
Return: Awesome return. Will say elsewhere
FETUSDTEverything on the chart, let's see how this will play out within the next months and two to three years

FET USDT FIBFET in discovery after breaking all time high. With Strong monthly close this coin can run until BTC tops. Let's see how far it goes.

FET After Last Successfull trade Here We Try Another One## FET Coin: Short Fundamentals, Recent News, and Disclaimer
**Fundamentals:**
* **Fetch.ai (FET):** A platform for building and deploying artificial intelligence (AI)-powered applications in a decentralized manner.
* **Launched:** March 2019.
* **Market Cap:** ~$1.5 billion (as of Mar 3, 2024).
* **Rank:** #63 on CoinMarketCap.
* **Unique Features:**
* **Open Collective Intelligence (OCI):** Allows AI agents to interact and collaborate, forming a decentralized “collective intelligence.”
* **Fetch.ai Network:** Enables secure and verifiable data exchange between AI agents and applications.
* **FET Token:** Used for staking, governance, and accessing services on the network.
**Recent News:**
* **Feb 23, 2024:** Fetch.ai participates in the World Economic Forum, showcasing its work on AI and blockchain.
* **Feb 15, 2024:** Integrates with Chainlink to enhance oracle services for AI applications.
* **Feb 10, 2024:** Announces partnership with Ocean Protocol to facilitate data sharing for AI models.
**Disclaimer:**
* This information is for educational purposes only and should not be considered financial advice.
* Cryptocurrency investments are highly volatile and carry significant risks.
* Do your own research before making any investment decisions.
**Additional Note:**
* FET price has seen recent gains but remains volatile, reflecting broader market trends.
* The recent news highlights Fetch.ai's focus on real-world applications of AI and blockchain technology.
* As always, be aware of the risks involved in cryptocurrency investments before making any decisions.


FETCH.AI (Y24.P1.VIDEO1).PRICE BULLISH BUTHI TRADRES,
The main purpose of this video is to demonstrate 2 approaches to finding levels of significance and potential macro targets as many don't do this.
I'm still bullish macro and by doing this and tracking it, it will be a strategy to know when to take profit if we see a reaction at those levels....even potentially shorts as we make our way to the top of the market, in this case, ATHs.
Based on what I see, we are at a pause position and likely a small shorting opportunity which we discuss.
Please give me a like and share, come over to my main area of video posts to subscribe and get more regular posts.
All the best,
S.SAri
another reason this will be a local target, 2.618

FET - TOKEN MANAGEMENT (MARCH 2024)FET - TOKEN MANAGEMENT (MARCH 2024)
While we enjoy experiencing pumping from Alts, we must manage our tokens on the way to get the most profit out of it.


Long Term Fet prediction! Weekly chart (Hopeum Edition)Please feel free to zoom in and out of the chart for better clarity. For quite some time I was stuck in 4 hourly daily charts. Given the current situation ,I personally avoided checking larger weekly time frames for quite some time until now. I am not saying we are out of the bag yet!!. It still feels like this bottomless well is sucking us in. Then I said to myself wait, this is how we are supposed to feel just before the tide changes direction.
I felt the same when btc hit around $4000 last time. When zoomed out of the weekly chart, I noticed that only 2 buy signals generated(many common buy indicators are lighting up at the same time)
First time this happened was back on march 9 2020 ish from that point price went up to ~1.2$ (roughly 11000% growth) I took these numbers as a reference point and also assumed supply increased by 6 folds over the last couple years. I estimated that during the next bull run $fet could possibly grow roughly 2000% percent .

FET/USDT Strong Bullish Movement, Could FET Bounce from support?💎 FET has been a significant player in the cryptocurrency market, and its current position is key to its market trajectory. FET is undergoing a retesting phase at a support area, which was previously a key resistance level. If this retesting phase proves to be successful, we can expect FET to bounce off this support and continue its ascent, potentially creating new highs at a strong resistance area.
💎 However, if FET struggles to recover during this retesting phase and fails to show a positive response at the support level, there's a risk it could lose this support or even break below it. Such a scenario would shift FET's direction towards a downward movement, with the Bullish OB area becoming the next critical point.
💎 The Bullish OB area, particularly around $0.465, is pivotal for FET's market direction. For FET to resume its upward trend, it’s essential that it rebounds from this area and reclaims a position above the resistance level.
💎 Failure to bounce from the Bullish OB area or a breakdown below it could signify a shift to a bearish trend, potentially leading FET towards further decline to the demand area or even a stronger demand zone.

FET by R/R:1💚Support Our idea on TradingView 🙏🏼by boosting 🚀
📈R/R:1 in two position
📊 (Entry) : 1.547
🔴 Stop Loss : 1.510
🎯 Take Profit : 1.590
🔗"Uncover new opportunities in the world of cryptocurrencies with AhmadArz.
💡Join us on TradingView and expand your investment knowledge with our five years of experience in financial markets."
🚀Please boost and💬 comment to share your thoughts with us!

FET/USDT bullish horizons? what next💎 Paradisers, let's focus on #FETUSDT, as the current trend offers a glimpse of a potential bullish turnaround from its vital support zone.
💎 Reviewing #FetchAi's latest market activity, we notice a significant 35% drop from its recent high. Yet, the steadfastness around the support level of $0.5718 suggests a doorway to an upward journey.
💎 Despite the hurdles in achieving new highs or surpassing previous milestones, which has led to a temporary bearish sentiment, the $0.5718 threshold is pivotal for #FET. This level is on the cusp of initiating a considerable bullish movement upon another assessment.
💎 As forward-looking traders, we're always equipped with a backup plan. Should #FET descend further from this support, we're eyeing a bullish revival starting from the secondary support at $0.529. It's important to remember, a fall through this level could indicate a move into deeper bearish territory.
💎 Maintain adaptability in your strategies and keen observation of market trends, Paradisers. Your ParadiseTeam is diligently watching, ready to navigate you through these evolving market conditions.

$FET Testing 1.30 pevelTesting the 1,30 level when resteting is done we push higher i think to 1.50 area.

FET is shaping up to be a clear winner of this bull market cycle- a 2019 shitcoin that is now somehow someway almost trading at new ATHs on a wick basis and already trading at new ATHs on a closing basis
- with it being an AI coin and looking at what NVIDIA is doing in traditional markets it makes sense that AI coins are going to be the hottest narrative of this cycle
- with a setup similar to BNB in 2021 before its run to +600 dollars I can easily see FET at sub 20 dollars before this bull run is well and truly over

Fetchsee the chart!
amazing movement uptrend what to say everything is on the chart.
the resistance and the supports.
have you seen the Cup???

$FET back testing the breakout backtesting the breakout and then up again.
BTC.D also comming to a resitance area that's bullish for alts


Fet Ready to Rip?After the 3 day decline of approximately 20% Fet may be ready for a 10% retrace or another massive leg up. Higher time frame are still over sold but lower time frames are looking more bullish with plenty room to range.
It is hard say how far these can go but AI related projects have been on a relentless tear to the upside. The high may or may not be in and really can't be known but a retrace would be signficant and continuation should be expected until there is brake of trend.
This is the hourly chart and price has pulled back to its trend with hourly osicllators fully reset.
Current Trading Plan:
The 3 day decline produced a 20% range. Trade the retrace to the 50% area and look for signs of continuation. The current low is clear point of invalidation
Trade Well
Your Friend,
Degen

FetchAI | Final Wave?I know. There are not any bearish signals; the chart is super bullish; it is going up.
But... The force of the final move, a massive jump from 5-Feb. through 21-Feb. has final wave potential.
If we look at FETUSDT past action or any bullish action across hundreds of Altcoins, the growth is always gradual. There are moments when the force is strong and these moments mark the end of an impulse.
The last two weeks consist of parabolic growth, basically and yet trading volume is lower compared to November and December 2023. There is a bearish divergence with the RSI.
Lower volume as FETUSDT hits a new high, signals that the bullish trend is losing strength.
I have to admit it, I don't know if this is the peak nor expect it to be; I drew the arrow though on the chart.
Peak or not peak, caution is advised at this point.
If I were a FetchAI holder, I would be looking at the option of taking profits because the best time to take profits is on the way up.
There are two ways to take profits: (1) On strength (moving up as is happening now) or (2) on weakness (when the top is confirmed and reversals signals are clear).
I hope you find this information useful.
Namaste.
