FET/USDT – Daily Technical AnalysisFET/USDT – Daily Technical Analysis
On the daily chart , FET has key weekly support at $0.340 and weekly resistance at $2.00. After a strong upward move, the price has now reached the top of its descending trendline, which may lead to a potential short-term correction.
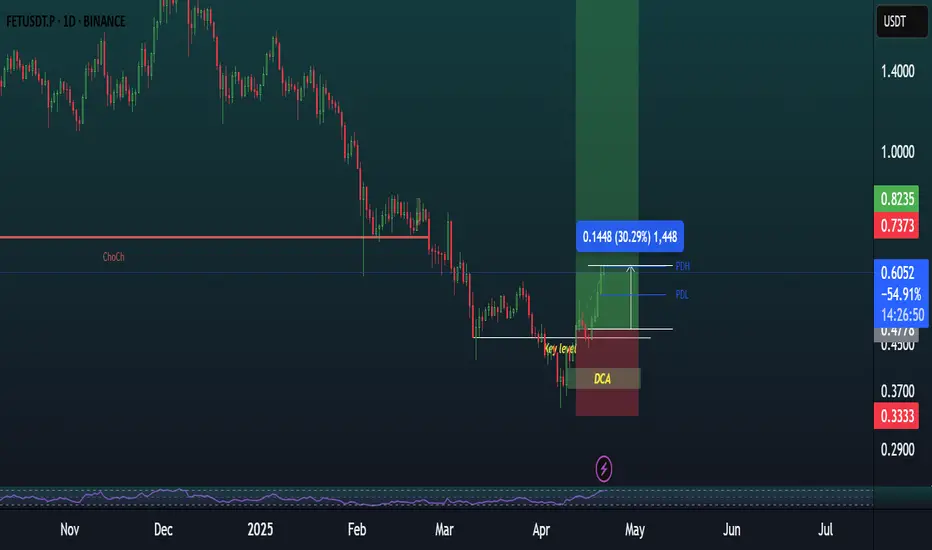
This correction could extend down to the daily support level at $0.50, which is around 20% below the current price.
However, if the price manages to break above the daily resistance at $0.80, it would signal bullish continuation, with a short-term target at $1.00.
🟢 Support Levels:
$0.50 (daily support – potential correction target)
$0.340 (weekly support – major long-term level)
🔴 Resistance Levels:
$0.80 (daily resistance – key breakout level)
$1.00 (initial bullish target after breakout)
$2.00 (weekly resistance – major long-term barrier)
FETUSDT trade ideas


FET Update NEXT TREGT ?
Fetch.ai has officially broken out of the broadening wedge and reclaimed the 100 MA — now acting as support on the daily timeframe ✅
📌 A solid bounce from this zone could ignite a bullish move targeting:
🎯 $0.81
🎯 $1.13
🎯 $1.60
Eyes on confirmation — this could be the start of a strong leg up! 🔥

Dec 2025 I am looking at a $7 FETCHis it really this simple? I only ever use the weekly chart as I am not a day trader, but a long term investor. I DCA and take positions when others are jumping out of windows and saying it's all over. I don't use many indicators, I keep it simple. I look at X to see what others are saying to get a vibe of a project/company. The AI space is here to stay, and some of these projects will soar. Will they survive long-term? No idea. Can we make insane amounts of money short-term (6, 12, 18, 24 months), YES!

FET long termCurrent Price: 0.714
Bullish Target: 1.235
Immediate Resistance: 0.848
Bearish Target: 0.35

TradeCityPro | FET: AI Token Eyes Breakout After Sharp Rebound👋 Welcome to TradeCity Pro!
In this analysis, I’m going to review the FET coin for you. This project is one of the top AI-related projects in the crypto category.
💫 With a market cap of $1.8 billion, it currently ranks 48th on CoinMarketCap.
📅 Weekly Timeframe
In the previous analysis, I mentioned that if the ascending trendline in this timeframe is broken, the price would make a higher high beyond 3.099, and with the activation of the trendline trigger, we could confirm a trend reversal in this timeframe.
✔️ As you can see, that scenario has played out. After breaking the trendline and the 0.382 Fibonacci level, the price dropped sharply down to the 0.786 level.
✨ The price reaction at this level was very quick, and after hitting this zone, it gained bullish momentum again with a bullish engulfing candle and has now reached the 0.797 area.
📈 If the 0.797 level breaks, the price could experience another sharp upward move. The next resistance levels are 1.095, 2.068, and 3.099 — with 1.095 overlapping with the 0.382 Fibonacci level.
📊 The main confirmation of trend reversal will be given by forming a higher high and higher low above the 0.797 level — confirming Dow Theory.
🔽 For a bearish continuation, the confirmation comes with a break of the 0.786 Fibonacci level. The main support levels are 0.185 and 0.058.
📅 Daily Timeframe
In the daily timeframe, we can better see the details of this bullish move. As observed, the price has had a sharp leg up from the 0.379 bottom to 0.791 without any real correction.
🧩 Given the strength of the 0.791 resistance, a correction is more likely here. If the price moves upward without correction, it’s usually not a good sign for trend sustainability. A healthy trend includes corrections.
🎲 However, if 0.791 breaks and RSI enters the Overbought zone, the price could continue rising toward the 1.128 resistance. While this might not be ideal for trend health, the risk-to-reward ratio makes opening a position worthwhile.
🛒 In my opinion, a correction followed by a new bullish wave would be a more ideal setup, increasing the chances of a breakout. Breaking this level could be a strong trigger for both spot buying and futures positions.
📉 For a bearish scenario, we need to wait for the price reaction to 0.791 and then enter after confirmation of trend reversal. Lower-level triggers would be the breaks of 0.567, 0.455, and 0.379.
📝 Final Thoughts
This analysis reflects our opinions and is not financial advice.
Share your thoughts in the comments, and don’t forget to share this analysis with your friends! ❤️

FETUSDT.P Breakdown Incoming? Supply Zone + Rising Wedge FET just tapped into a strong supply zone and formed a rising wedge — usually a bearish sign. Price looks weak here and might break down soon.
If the wedge breaks, I’m looking for a short setup.
Entry: 0.716 - Wait for breakdown
Stoploss: 0.746
Target 1: 0.685
Target 2: 0.657
Target 3: 0.607
Waiting for confirmation before jumping in. Let’s see how it plays out.

Fetch finished it's recent up swing?Could a head and shoulders pattern have formed on Fetch? Hopefully not as I've gone bought non-CFD Fetch.

Fetch AI 1800% move??????Got some triangle (leading diagonal), Aiming for that wave 5. Big gains to be made. From there looking for a short position.

FET Imminent Rise, Easy 333% To 666% Profits PotentialThis is a time sensitive publication. I will explain my thinking and support my conclusions based on TA.
How are you doing in this wonderful day?
Bitcoin is looking good and the Altcoins are looking better by the day. The Cryptocurrency market is heating up and set to grow long-term.
» Imminent, FETUSDT is preparing for a strong rise next.
Here is the thing, the downtrend has been broken. This of itself reveals and confirms a bullish bias.
Next, the 3-Feb. low resistance has been conquered and this is a major development. This is the short-term baseline. Above this level FETUSDT is ultra-bullish.
Finally, The bottom pattern is a classic, iH&S, and supported with really high volume. All these signals are strong, confirmed and good.
Artificial Superintelligence Alliance is set to grow. It is already growing, but this growth will soon speed up. Bullish momentum will manifest and a strong bullish wave will develop.
» First, a 333% target is easy followed by additional growth.
Namaste.

#FET/USDT#FET
The price is moving within a descending channel on the 1-hour frame, adhering well to it, and is heading for a strong breakout and retest.
We are experiencing a rebound from the lower boundary of the descending channel, which is support at 620.
We are experiencing a downtrend on the RSI indicator, which is about to break and retest, supporting the upward trend.
We are looking for stability above the 100 moving average.
Entry price: 0.625
First target: 0.659
Second target: 0.647
Third target: 0.659

#FET/USDT Futures Trade Setup!#FET looks good if you missed.
Two options to enter:
1. You can accumulate .5869 to .6080
2. Wait for the US Open and buy at CMP with confirmations.
Targets : .6377 .6522, .6755, .6838 and .7021
SL .5772
Dyor, NFA
Do hit the like button if you want me to post more setups like this.
Thank you
#PEACE

FET/USDT - Trendline Breakout (22.04.2025)The FET/USDT Pair on the M30 timeframe presents a Potential Selling Opportunity due to a recent Formation of a Breakout Pattern. This suggests a shift in momentum towards the downside in the coming hours.
Possible Short Trade:
Entry: Consider Entering A Short Position around Trendline Of The Pattern.
Target Levels:
1st Support – 0.553
2nd Support – 0.516
🎁 Please hit the like button and
🎁 Leave a comment to support for My Post !
Your likes and comments are incredibly motivating and will encourage me to share more analysis with you.
Best Regards, KABHI_TA_TRADING
Thank you.

FET 30% PROFIT DONE,FETUSDT was shared last week, check previous week chart. It has done 30% pump from last few days.
FET LONG/BUY SETUPHello, TradingView community and my subscribers, please if you like ideas do not forget to support them with your likes and comments, thank you so much and we will start a LONG/BUY outlook on #FETUSDT.P explained

FET/USDT – Inverse Head & Shoulders BreakoutJoin our community and start your crypto journey today for:
In-depth market analysis
Accurate trade setups
Early access to trending altcoins
Life-changing profit potential
FET has formed a classic Inverse Head and Shoulders pattern on the 2H timeframe. The neckline has been broken with notable bullish momentum, confirming the breakout.
Key observations:
Pattern: Inverse Head & Shoulders
Neckline breakout at approximately $0.44
Projected measured move targets around $0.57
Current price trading above the breakout zone, showing strength
A retest of the neckline followed by a successful bounce would further confirm bullish continuation. Holding above the $0.44-$0.45 zone is key for the momentum to sustain.
If you find this analysis helpful, please hit the like button to support my content! Share your thoughts in the comments, and feel free to request any specific chart analysis you’d like to see.
Happy Trading!!

FETUSDTOn the weekly chart, there is a clear bullish guard, but on the daily chart, we have a lower low and high, which is confirmation of the downtrend. If the trend breaks and stabilizes above the 0.60 range and a higher low and high is observed on the daily chart, we can have confirmation of the uptrend.

FETUSDT 1D AnalysisFET ~ 1D Analysis
#FET Buy after successfully penetrating this resistant line with a short -term target of at least 10%+ from here.

#FET/USDT#FET
The price is moving within a descending channel on the 1-hour frame, adhering well to it, and is heading for a strong breakout and retest.
We are seeing a bounce from the lower boundary of the descending channel, which is support at 0.477.
We have a downtrend on the RSI indicator that is about to be broken and retested, supporting the upward trend.
We are looking for stability above the 100 moving average.
Entry price: 0.500
First target: 0.513
Second target: 0.529
Third target: 0.550

FETUSDT Macro-Analysis – Cyclical Patterns in a Long channelJoin our community and start your crypto journey today for:
In-depth market analysis
Accurate trade setups
Early access to trending altcoins
Life-changing profit potential
Let' analyse FETUSDT:
FET is currently moving within a clearly defined ascending channel, visible on the weekly timeframe. This structure has guided price through several major boom-bust cycles, all forming within the same parallel boundaries—providing a strong technical roadmap for long-term accumulation and exit strategy.
Historical Cycle Breakdown:
A to B: 98.4% drop
B to C: 15,458% rally
C to D: 95.4% drop
D to E: 6,310% rally
E to F (current): 90.4% drop so far
The current dump from E to F aligns perfectly with the Fibonacci 0.618 retracement level — just like the historical dumps to points B and D, which also bottomed at the 0.618 zone before staging explosive rallies.
Point F also coincides with the lower boundary of the long-term ascending channel, a region that has historically offered exceptional risk-reward accumulation zones.
This confluence of channel support + fib retracement makes Point F a technically strong zone for smart accumulation.
Accumulation levels:
$0.30 to $0.234
If you find this analysis helpful, please hit the like button to support my content! Share your thoughts in the comments, and feel free to request any specific chart analysis you’d like to see.
Happy Trading!!

Trading opportunity for FETUSDTBased on technical factors there is a Sell position in :
📊 FETUSDT
🔴 Sell Now
🪫Stop loss 0.540
🔋Target 0.350
📏 R/R 2,3
💸RISK : 1%
We hope it is profitable for you ❤️
Please support our activity with your likes👍 and comments📝

FET Swing Long SetupThe major liquidity sweep of FET is completed, I'll be lloking at a breakout of the resistance zone at 0.51, secondly a successful retest of the resistance turned into support.
Placing my limit long orders at 0.51 to 0.43 area, targeting the HTF liquidity zone and major resistance at 1.05, an easy Stoploss just below the HTF liquidity sweep at 0.32.

FET Ready For Re AccumulationAfter a common ABC retrace into the 50-61.8% area since its last low prices are approaching its trend line. FET has already seen major gains this cycle along with the merger of agix and ocean.
Current Trading Plan
Begin to re accumulate and watch crypto market as a whole for potentialy one more push to the upside this cycle.
